| Northern Mountains |
| March-April-May Precipitation |
|
(Return to Main Feature) or go to CD1 | CD3 | CD4 | CD5 | CD6 | CD7 | CD8 |
|
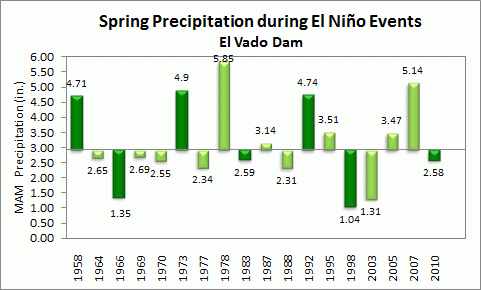
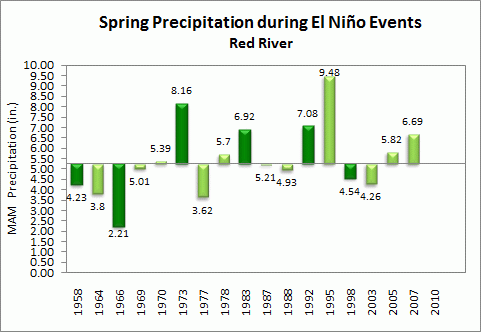
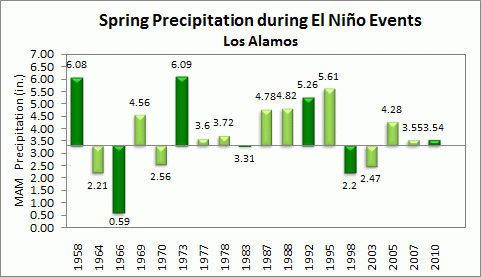
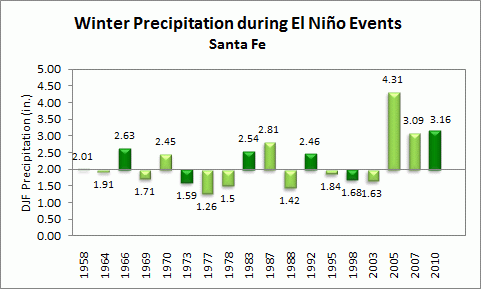
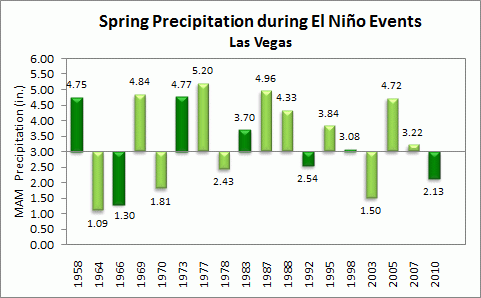
Areas in north central New Mexico, especially locales in the higher terrain, tend to be affected less by the presence of a El Niño event during winter. However, by spring, increases in precipitation are a but more noticeable. For all El Niño events, averages ranged from 100% of the long term average at Eagle Nest to 116% at Los Alamos. And similar to the winter season, anomalies during strong El Niño events, were not as great, and ranged from 72% at Eagle Nest to 116% of normal at Los Alamos.
|
|
A description of the graphs is located at the bottom of the page. |
 |
| Percent of Longterm Average for all El Niño Events = 108% , for strong El Niño Events = 107% |
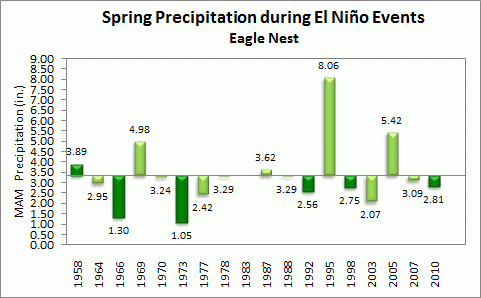 |
| Percent of Longterm Average for all El Niño Events = 100% , for strong El Niño Events = 72% |
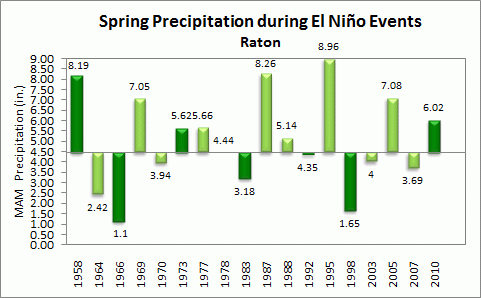 |
| Percent of Longterm Average for all El Niño Events = 114% , for strong El Niño Events = 97% |
 |
| Percent of Longterm Average for all El Niño Events = 104% , for strong El Niño Events = 105% |
 |
| Percent of Longterm Average for all El Niño Events = 116% , for strong El Niño Events = 116% |
 |
| Percent of Longterm Average for all El Niño Events = 108% , for strong El Niño Events = 100% |
 |
| Percent of Longterm Average for all El Niño Events = 112% , for strong El Niño Events = 106% |
|
Precipitation values for 3-month periods during 18 El Niño Events since 1949-50 are plotted with respect to the long term precipitation average, listed to the right of the graph. The precipitation totals for each 3-month period are plotted above or below each bar. Years for which the El Niño Event was considered to be strong are colored in dark green. "M" represents a 3-month period with missing data. Finally, the percents of long term normal for all El Niño events and for the strong El Niño events are listed below each graph. |

