
Flash flooding threatens areas from the Tennessee Valley to the Carolinas as storms repeat along a stalled front. Monsoonal storms may trigger flooding in the Southwest. Dangerous heat expands across the Desert Southwest, Plains, mid-Mississippi Valley and Southern Tier. Critical fire weather for interior Pacific Northwest. Cooler, drier air brings brief relief to the Great Lakes and Northeast. Read More >
| La Niña Conditions in the Tropical Pacific | ||
| What are the effects of La Niña on Precipitation Across New Mexico? | ||
|
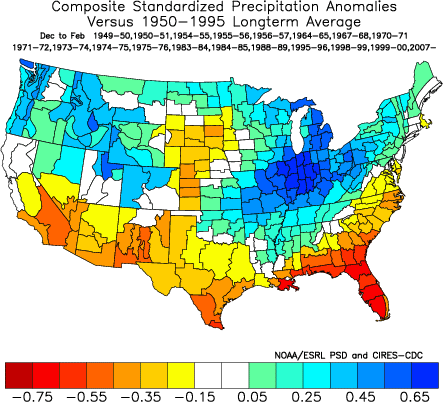
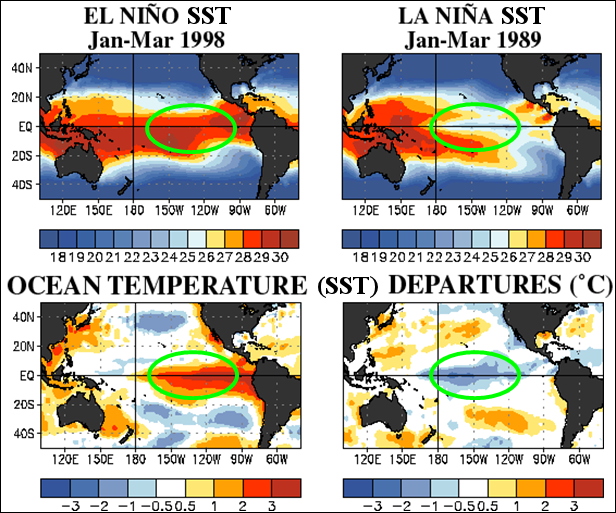
In a cycle of natural climate variability, sea surface temperatures (SST) regularly fluctuate in the tropical Pacific Ocean. During 2010, SSTs in the tropical Pacific varied dramatically. The year started with warm anomalies (an El Niño), but by early summer SSTs were below average and additional cooling has led to the development of a La Niña event. These below average SSTs persisted through much of 2011 such that by fall, another La Niña event was in place. And more recently, during the winter of 2012-2013, SST anomalies remained negative in the tropical Pacific, though the magnitudes were not large enough to be considered a La Niña event by NOAA's Climate Prediction Center. The cycle of warmer-than-normal and cooler-than-normal SSTs is often referred to as the El Niño Southern Oscillation, or ENSO. The changes in SST in the tropical Pacific not only affect the distribution of precipitation near the equator, but also result in modified tropical atmospheric circulations that ultimately change the positions of the jet stream and storm tracks in the higher latitudes, including North America. Climate variability associated with the ENSO cycle has been observed at numerous locations across the globe for many years. In New Mexico, wetter than normal conditions are more likely during El Niño events with drier than normal conditions during La Niña events, particularly during the cool seasons of winter and spring. |
||
|
||
|
Image generated at https://www.esrl.noaa.gov |
||
|
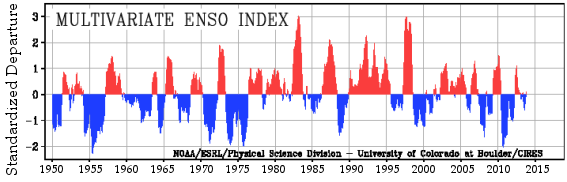
Research scientists have determined that the location and strength of the SST anomalies in the tropical Pacific can affect the pattern and strength of precipitation anomalies at higher latitudes. A number of indices are used to measure the ENSO cycle, as well as to define El Niño and La Niña events. One such index, the Multivariate ENSO Index*, or MEI, is shown below. In general, areas of the graph in red mark El Niño (warm) events, while blue areas represent La Niña (cold) events. Note that the magnitude of the 2010 cooling reached its greatest value since 1975, indicating a strong La Niña. However, using the Oceanic Niño Index, or ONI, NOAA's Climate Predication Center ranked the 2010-2011 La Niña in the moderate category. Note in the graphic below, the MEI continued to be negative into the Fall 2011 season, supporting another La Niña event. |
||
 |
||
| *Information and references on the MEI can be found here . | ||
|
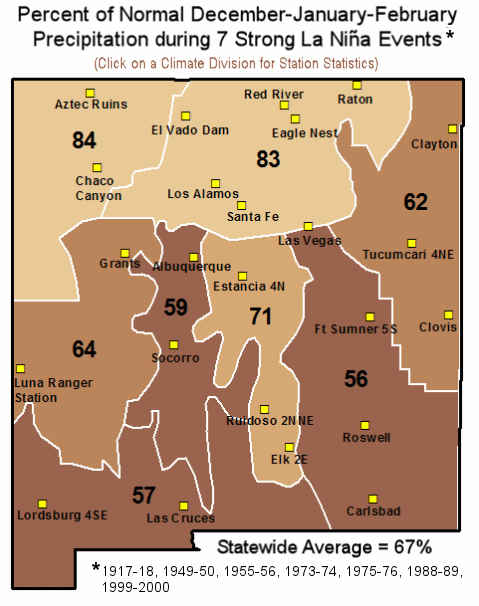
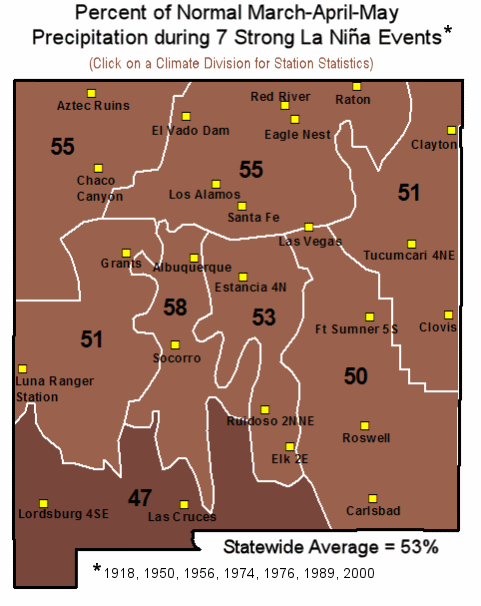
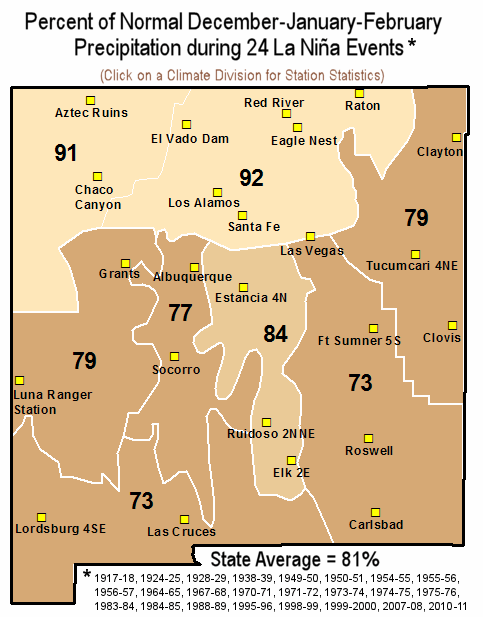
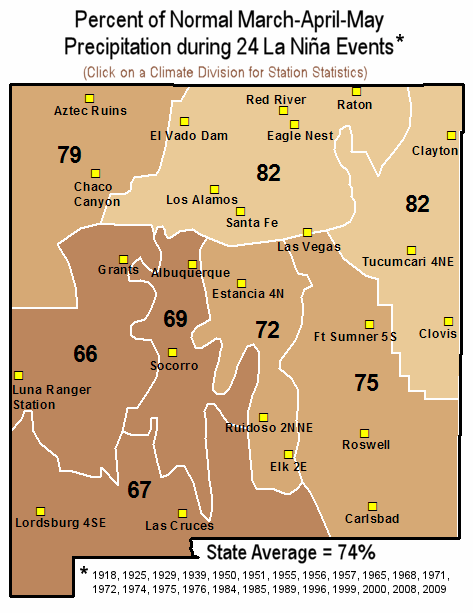
For this feature, we examined precipitation in two formats - area averaged precipitation over climate divisions (depicted as white boundaries in the maps below) and for 24 stations (yellow squares on the maps below). The climate division long term averages represent the period from 1911-2008, during which 24 La Niña events (7 strong) were used for departure statistics. The periods of record for several of the stations are shorter, thus station statistics begin in 1950 and cover 20 La Niña events (6 strong events). Years of the events are listed at the bottom of the Climate Division state maps (links or images below). |
||
|
||
|
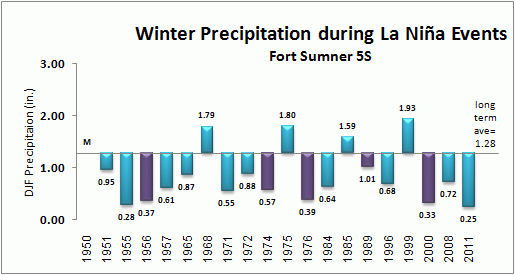
While odds favor a dry winter during an established La Niña event, a review of individual station statistics demonstrates how variable the precipitation can be from event to event. In the graphic below, winter precipitation values for 19 La Niña events are plotted with respect to the long term average at Ft. Sumner 5S. During all strong La Niña events (purple bars), the winter precipitation was less than the long term average. However, during four of the remaining La Niña events, precipitation was above the long term average. Similar statistics for all stations marked on the maps can be obtained by selecting any climate division. |
||
 |
||
|
|
||
|
||
 |
||
|
It is important to note that there are other modes of climate variability that can have an effect on seasonal precipitation. While a La Niña will tilt the odds for a dry winter in New Mexico, it does not guarantee below average precipitation. For example, in 2008 with La Niña conditions in place, southwest New Mexico was dry, but the storm track brought above average precipitation to northwest and north central New Mexico. In 1985, another La Niña year, a strong winter storm crossed the southwest in mid-December bringing widespread snow to the entire state. In 1996, the eastern plains had well above average precipitation from late April through May. Odds of a dry winter or spring, however, are definitely enhanced during strong La Niña events.
Given the strength of the current La Niña, as well as positive SST anomalies in the north Pacific (cold phase of the PDO), our expectations are for another dry winter. The increased chances of drier than normal winter and spring seasons are evident on NOAA's Climate Prediction Center's 3-Month Outlooks. Three month outlook statistics are also downscaled for 11 sites across New Mexico, and are available on our local climate page or here. The Climate Prediction Center (CPC) routinely issues diagnostic discussions describing the current status of the El Niño Southern Oscillation (ENSO) cycle. Look for the "Expert Discussions/Assessments" on CPC's ENSO Page. |

