Hurricane Erin continues to track northward. Tropical storm force winds, storm surge conditions will increase for the Outer Banks today and portions of coastal Virginia. Life-threatening surf and rip currents along much of the east coast of the U.S. this week. Major to extreme HeatRisk with new record high temperatures are expected for many areas of the western U.S. this week. Read More >
|
The 2016 year in Clayton was warmer than normal, following the pattern of the past 10 to 15 years. The graph below lists the actual daily temperatures, as well as the normal and record highs and lows for Clayton in 2016. (click image to enlarge) The average temperature for Clayton in 2016 was 56.5 degrees, which was 2.4 degrees above the 30 year normal of 54.1 degrees, while the long term normal is 53.6 degrees. Monthly temperatures for the Clayton Airport are illustrated in the charts below with monthly average temperatures for Clayton in red, and both long term (purple) and 30-year (blue) normals in the top graph, with departures shown in the bottom graph. |
|
|
|
The 2016 year in Clayton was a warm one, ranking as the 3rd warmest on record since 1910, (although numerous years with considerable missing data - not included here). All months were above normal except May and August. February (tied 7th warmest), March (tied 12th warmest), July (tied 3rd warmest, October (warmest on record) and November (5th warmest) were all responsible for the much warmer than normal temperatures. The average maximum temperature for Clayton was 71.3°F (3.4 degrees above normal), while the average minimum temperature for the year was 41.7°F (1.4 degrees above normal). The maximum temperatures made much more of an impact on the overall warmer than normal temperatures for Clayton.
|
|
PRECIPITATION Precipitation was below normal in Clayton during 2016. The graph below (red line) shows the daily precipitation for the year (red line).
(click image to enlarge) Total precipitation in 2016 was 20.13 inches. This was 4.34 inches above the 30 year normal (1981-2010) of 15.79 inches. This was the 17th wettest year on record for Clayton. The long term average is 15.33 inches. The monthly precipitation (orange) is compared to the 30 year normal (light green), the period of record normal (cyan), and the departures from normal (green or brown).
Precipitation for five of the 12 months in Clayton for 2016 was wetter than normal, six were below normal and January was exactly normal. June and August were the two months mostly responsible for the wetter than normal year. They measured well above normal rainfall, both setting records for the wettest months (June & August) on record. SNOW The Clayton Airport reported 10.1 inches of snow in calendar year 2016 (red line below), while the 30 year normal is 28.0 inches. 2016 was the 15th least snowiest year on record.
(click image to enlarge)
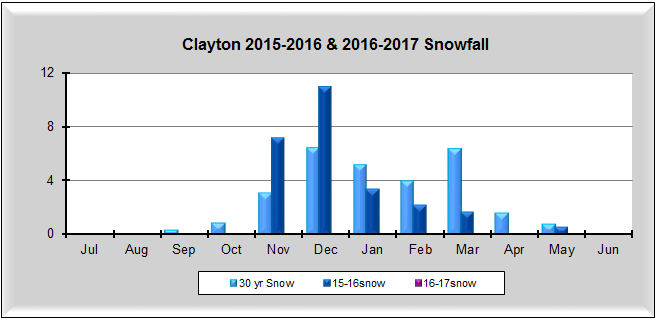
The table below shows the snowfall for the 2015-2016 (25.5 inches) and 2016-2017 (2.6 inches so far) snow seasons, which officially run from July through June.
|


.png)
.png)
.png)
.png)
.png)
.png)
.png)
.png)
.png)