
A heat wave over the Southwest will intensify this week, peaking and expanding into the Intermountain West and northern High Plains this weekend. Critical to extremely critical fire weather conditions are forecast from the Northwest and the northern Great Basin this weekend. Particularly Dangerous Situation Red Flag Warnings have been issued. Read More >
| 2017 Weather Highlights | Hydrology/Drought Status | Fire Weather | Records and Extremes | Monthly Highlights | Severe Weather |


|
New Mexico 2017: Record Warmth - Above Normal Precipitation!
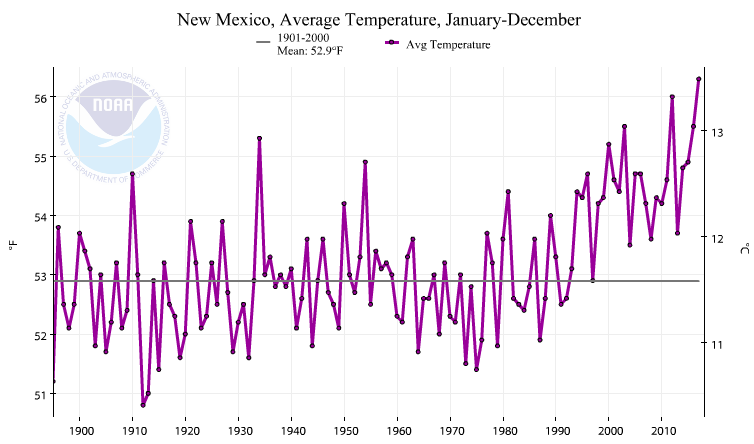
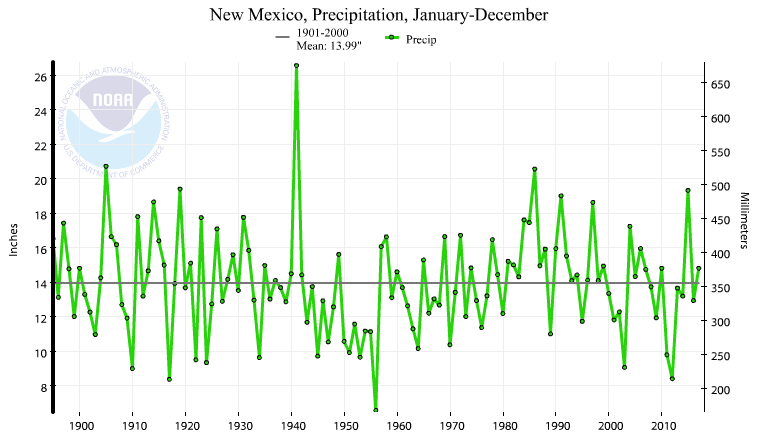
The 2017 statewide average temperature was 3.4 degrees above normal (warmest on record!) The 2017 statewide average precipitation was 0.83 inches above normal (51st wettest)
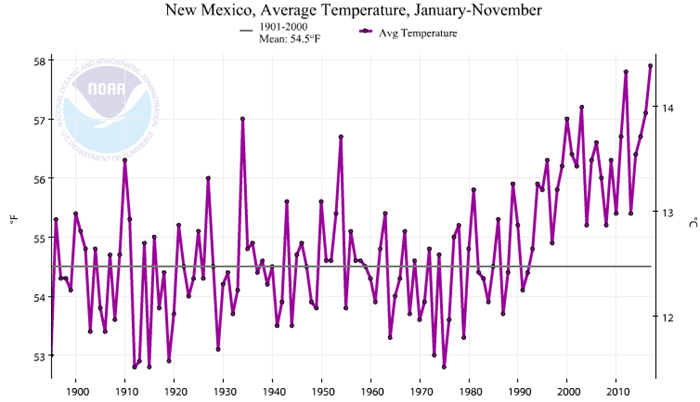
Statewide - Winter 2016/2017, January 2017: Both in the Top 10 Wettest on Record! Statewide - Winter (2016/17), Spring, February, March, November, December: All in the Top 10 Warmest on Record! (linked graphs above are courtesy of the NCEI and National Drought Mitigation Center)
2017 was the warmest year on record for New Mexico! Two seasons and four months were in the Top 10 warmest on record. The winter season (Dec 2016 - Feb 2017) was tied for the warmest on record, spring season (Mar - May) the 7th warmest, February the 2nd warmest, March and November the warmest on record, and December tied for the 6th warmest. When was the last year New Mexico experienced a below normal year? You have to go back to 1992! That's 25 consecutive years with above normal temperatures in New Mexico! 2017 was wetter than normal, by an average of 0.83 inches. This was the 51st wettest year on record, which includes 123 years of data. In the past 20 years, eleven years have been drier than normal and nine years wetter than normal. 2017 In Pictures!
|
|||||||||||||||||||||||||||||
|
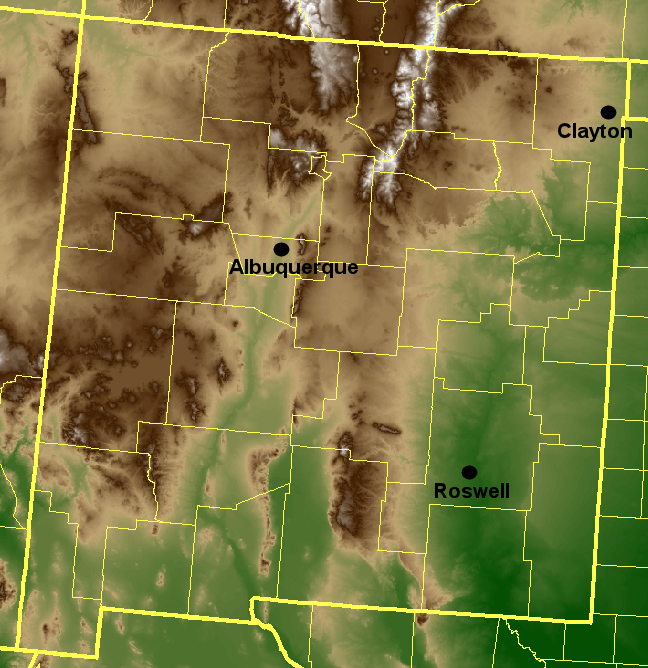
Climate Cities at a Glance: 2017: Temperature and Precipitation Data For Albuquerque, Clayton and Roswell
(Departure from normal based on a 30-year normal from 1981 to 2010; Rankings based on total Period Of Record - POR) This year's annual weather and climate review is organized into topics which are accessed by the tabs across the top of each page. The image below provides links to the 2017 statistics on temperature and precipitation for our climate sites: Albuquerque, Clayton and Roswell. Other topics include a summary of the drought status and hydrologic program; a recap of the fire weather program; a list of all the records in Albuquerque, Clayton and Roswell in 2017 as well as extremes for Albuquerque and the growing season around the Duke City; a month-to-month recap of the significant weather events across New Mexico; and a review of our 2017 severe weather. Click on a city below to view more detail about thetemperature and precipitation data for 2017
|
|||||||||||||||||||||||||||||

