National Weather Service United States Department of Commerce


August 2017 Weather Review

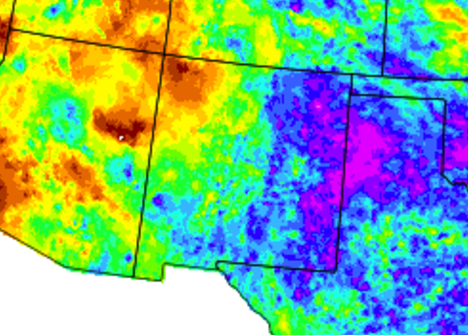
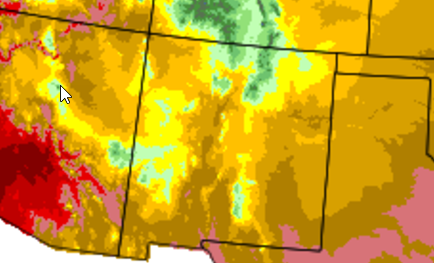
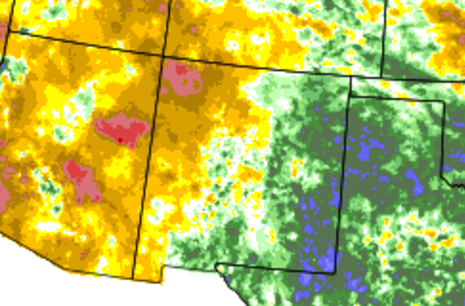
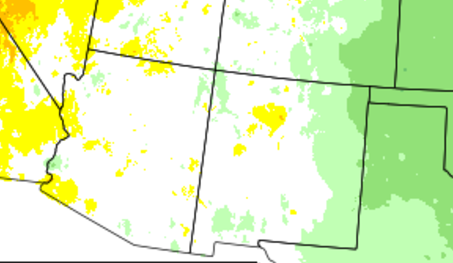
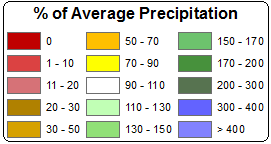
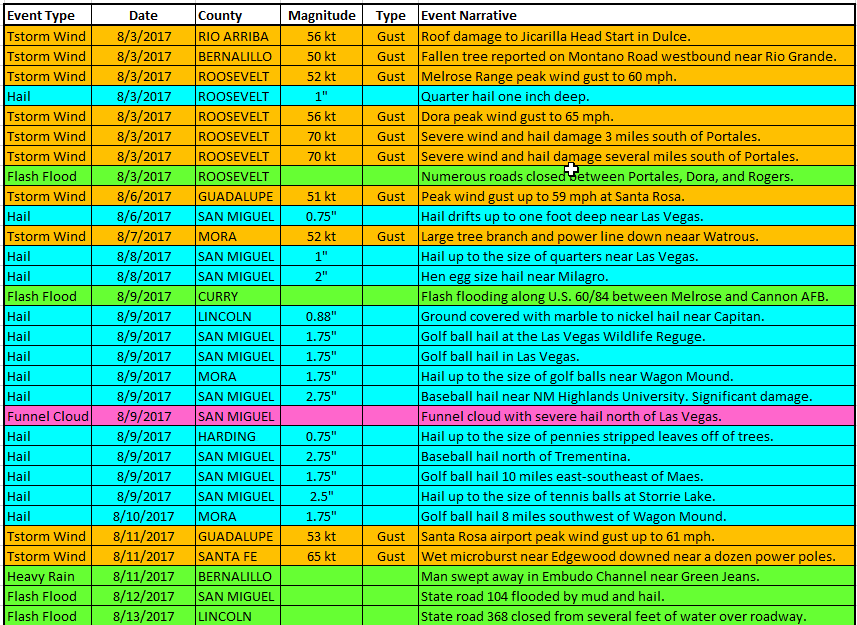
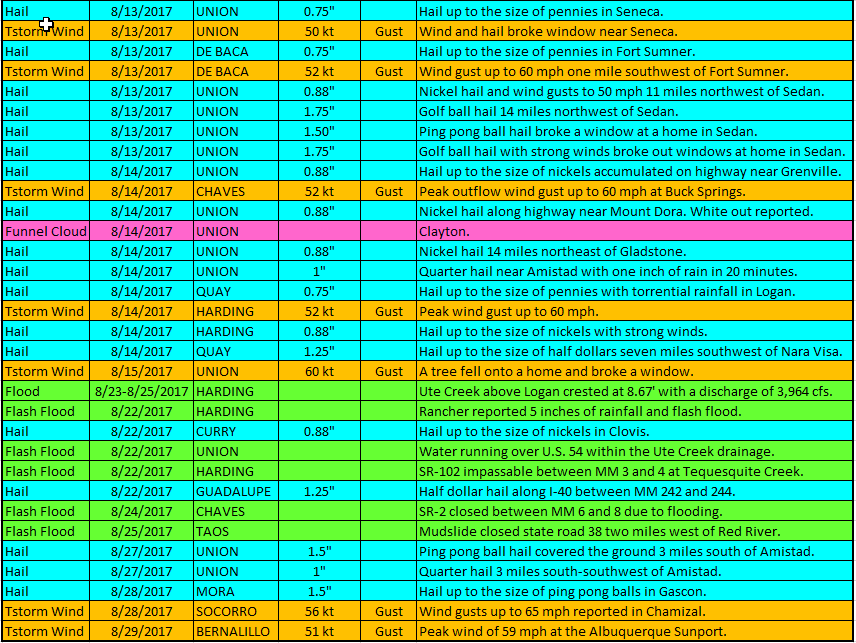
August brought below normal precipitation to northwest New Mexico, near normal rainfall in central areas, and above to well above normal in the east. Temperatures were varied, but mostly near normal west and central and below normal east. 

August 2017 delivered a typical supply of severe weather across the state, including flash flooding, large hail and damaging winds. Most of the severe weather, though, was across the eastern plains, which is more representative of April through June. Severe weather struck the east on the 9th (hail), 12th through 15th (hail and high winds) and 22nd (hail and flash flooding). The hail on the 9th was especially large, the size of golf balls in Las Vegas and east of Maes (San Miguel County). The weather was more tame across western and central New Mexico during this time. But some of these areas received plenty of rain, including around six inches near Los Alamos, Glenwood, Red Rock and Silver City. Cloudcroft picked up nearly eight inches of rain. The second half of August was relatively quiet by typical monsoon standards. The exception was on the 22nd when flash flooding occurred in Harding and Union Counties. 


Statewide Precipitation and Temperatures

Statewide Precipitation - Actual Statewide Temperatures - Actual


Statewide Precipitation - Depature From Normal Statewide Temperatures - Departure From Normal


   Climate Cities Temperatures and Precipitation

Albuquerque
 

There was 1.49 inches of precipitation measured at the Sunport in August 2017, compared to the normal of 1.58 inches, or 0.09 inches below normal.

The average temperature for Albuquerque in August 2017 was 76.2°, which was exactly normal.

The average maximum temperature for the month was 88.0°. This was 0.8 degrees above the normal average maximum temperature of 87.2°.

The average minimum temperature for the month was 64.4°. This was 0.7 degrees below the normal average minimum temperature of 65.1 degrees.

Records: none.

 
 Clayton
 

There was 2.60 inches of precipitation measured at Clayton in August 2017, compared to the normal of 2.94 inches, or 0.34 inches below the average of 2.94 inches. 

The average temperature for Clayton in August 2017 was 69.0°, which was 4.3 degrees below the normal of 73.3°.

The average maximum temperature for the month was 81.1°. This was 5.1 degrees below the normal average maximum temperature of 86.2 degrees.

The average minimum temperature for the month was 56.8°. This was 3.5 degrees below the normal average minimum temperature of 60.3°.

Records: none.

 
 Roswell
 

There was 1.54 inches of precipitation reported at Roswell during August of 2017, which is 0.43 inches below the normal of 1.97 inches. 

The average temperature in Roswell for August 2017 was 79.0°, which is 0.3 degrees above the normal of 78.7 degrees. 

The average maximum temperature for the month was 91.4°. This was 0.3 degrees below the average maximum temperature of 91.7 degrees.

The average minimum temperature for the month was 66.6°. This was 0.8 degrees above the normal average minimum temperature of 65.8°

Records: none.


Severe Weather
Storm reports are considered preliminary until a final review is certified in the NWS Storm Data publication.
Certified data is available three to four months post-event at: https://www.ncdc.noaa.gov/stormevents/