National Weather Service United States Department of Commerce

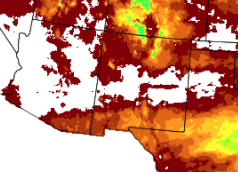
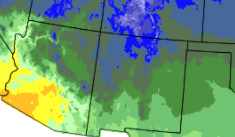
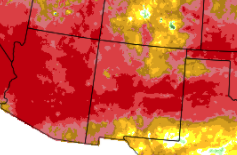
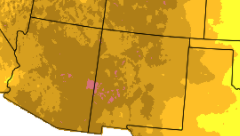
The start of November was dry and warmer than normal. In fact, near record highs were reported across the east from the 3rd through 5th.  An upper level disturbance and surface cold front arrived on the 7th, delivering some rain and high mountain snow showers, as well as colder temperatures. A warming trend ensued with temperatures recovering to around normal on the 10th, then a dry and mild period of weather embraced the Land of Enchantment from the 11th through 17th, including some record highs. A strong cold front sent temperatures below normal on the 18th and 19th. Yet again, a big warm up followed for the 20th through the Thanksgiving weekend (26th). Generally above normal temperatures and dry weather continued through the remainder of the month. November 2017 set records for the warmest November on record for Albuquerque and Roswell. 


Statewide Precipitation and Temperatures

Statewide Precipitation - Actual

Statewide Temperatures - Actual


Statewide Precipitation - Percent Of Normal Statewide Temperatures - Departure From Normal


   Climate Cities Temperatures and Precipitation

Albuquerque
 

There was no precipitation measured at the Sunport in November 2017, compared to the normal of 0.57 inches. This ties 9 other years that did not receive any precipitation in November.  

The average temperature for Albuquerque in November 2017 was 52.8°, which was 7.9 degrees above the normal of 44.9°. 

The average maximum temperature for the month was 65.4°. This was 9.6 degrees above the normal average maximum temperature of 55.8°.

The average minimum temperature for the month was 40.2°. This was 6.1 degrees above the normal average minimum temperature of 34.1 degrees.

There was no snow in November 2017, while normal is 1.0 inch. There have been 15 Novembers with no snow reported since 1932. 

Records:  17th - record daily maximum temperature 73 degrees                                                                                                       month - record monthly average temperature 52.8 degrees

 
 Clayton
 

There was 0.08 inches of precipitation measured at Clayton in November 2017, or 0.37 inches below the average of 0.45 inches.

The average temperature for Clayton in November 2017 was 49.2°, which was 5.6 degrees above the normal of 43.6°. This was the 4th warmest November on record since 1909. 

The average maximum temperature for the month was 65.0°. This was 7.8 degrees above the normal average maximum temperature of 57.2 degrees.

The average minimum temperature for the month was 33.3°. This was 3.3 degrees above the normal average minimum temperature of 30.0°.

There was 0.5 inches of snow at Clayton during November 2017, while normal is 3.0 inches.

Records: none

 
 Roswell
 

There was no precipitation reported at Roswell during November of 2017. The normal is 0.58 inches.

The average temperature in Roswell for November 2017 was 55.4°, which is 6.1 degrees above the normal of 49.3 degrees. This was the warmest November on record. 

The average maximum temperature for the month was 70.9°. This was 6.6 degrees above the average maximum temperature of 64.3 degrees.

The average minimum temperature for the month was 39.9°. This was 5.4 degrees above the normal average minimum temperature of 34.3°

Records: Nov 17 - record daily maximum temperature 89 degrees                                                                                         Nov 24 - record daily maximum temperature 84 degrees tied                                                                                   Month - record average temperature 55.4 degrees


Severe Weather
Storm reports are considered preliminary until a final review is certified in the NWS Storm Data publication.
Certified data is available three to four months post-event at: https://www.ncdc.noaa.gov/stormevents/