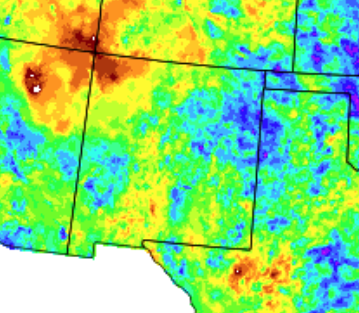
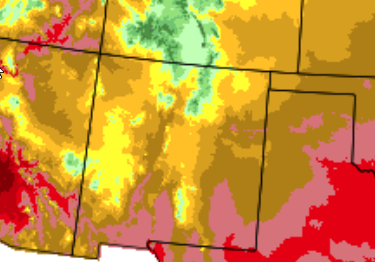
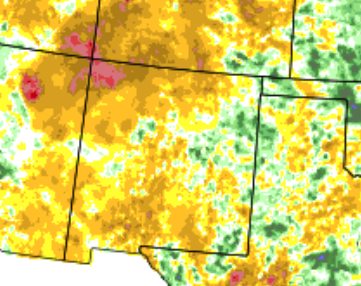
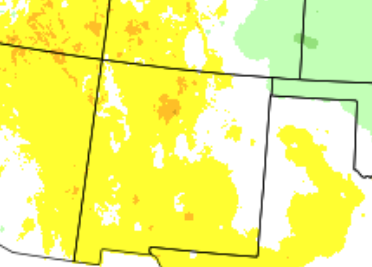
August 2018 was mostly warmer than normal, with near to below normal precipitation, except for parts of the eastern plains that were above normal.
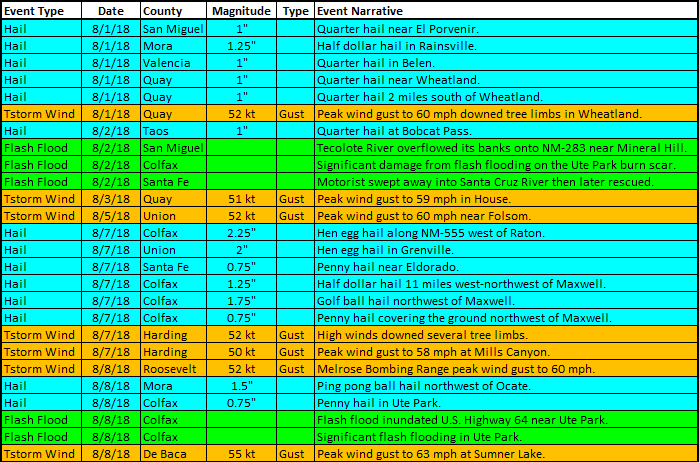
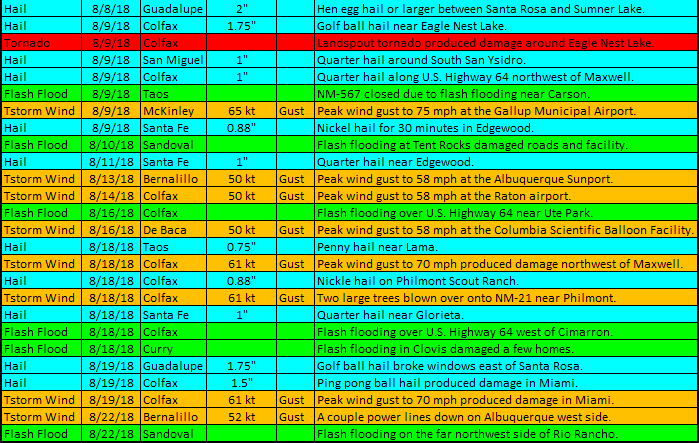
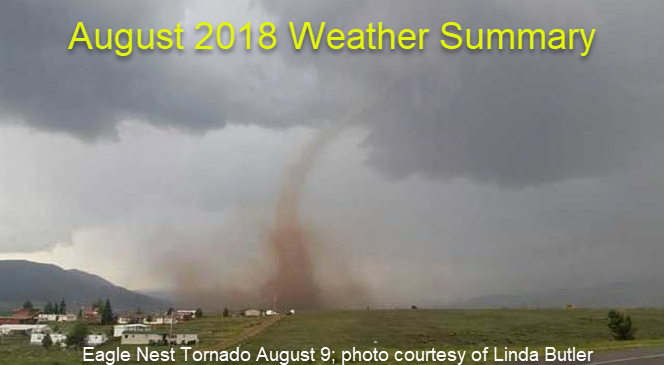
The month began with a bang as large hail pummeled portions of northeast New Mexico. Other active periods included the 7th-9th and 18th to 19th. A severe thunderstorm in the Rio Rancho/Albuquerque area on the 23rd produced flash flooding and wind damage. The remainder of the month was more tranquil.
Statewide Precipitation and Temperatures
| Statewide Precipitation - Actual |
Statewide Temperatures - Actual |
 |
 |
 |
 |
| Statewide Precipitation - Depature From Normal |
Statewide Temperatures - Departure From Normal |
 |
 |
 |
 |
Climate Cities Temperatures and Precipitation
| Albuquerque |
| |
|
There was 0.95 inches of precipitation measured at the Sunport in August 2018, compared to the normal of 1.58 inches, or 0.63 inches below normal.
The average temperature for Albuquerque in August 2018 was 77.7°, which was 1.5 degrees above normal.
The average maximum temperature for the month was 90.3°. This was 3.1 degrees above the normal average maximum temperature of 87.2°.
The average minimum temperature for the month was 65.1°. This equaled the normal average minimum temperature of 65.1 degrees.
Records: none.
|
| |
| Clayton |
| |
|
There was 3.90 inches of precipitation measured at Clayton in August 2018, compared to the normal of 2.94 inches, or 0.96 inches above normal. This was the 18th wettest August on record.
The average temperature for Clayton in August 2018 was 72.6°, which was 0.7 degrees below the normal of 73.3°.
The average maximum temperature for the month was 86.4°. This was 0.2 degrees above the normal average maximum temperature of 86.2 degrees.
The average minimum temperature for the month was 58.8°. This was 1.5 degrees below the normal average minimum temperature of 60.3°.
Records: none.
|
| |
| Roswell |
| |
|
There was 0.96 inches of precipitation reported at Roswell during August of 2018, which is 1.01 inches below the normal of 1.97 inches.
The average temperature in Roswell for August 2018 was 82.0°, which is 3.3 degrees above the normal of 78.7 degrees. This was the 8th warmest August on record.
The average maximum temperature for the month was 96.1°. This was 4.4 degrees above the average maximum temperature of 91.7 degrees.
The average minimum temperature for the month was 67.8°. This was 2.0 degrees above the normal average minimum temperature of 65.8°
Records: Aug 27 - record high daily maximum temperature of 103.
|