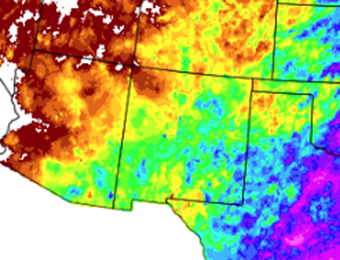
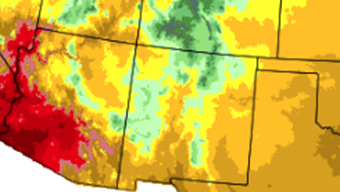
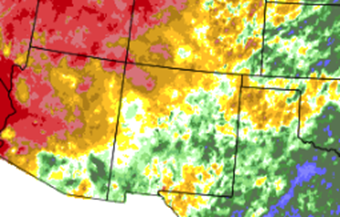
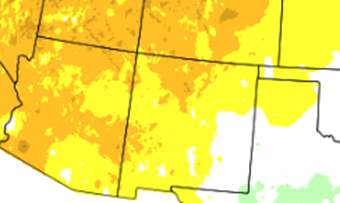
September 2018 was warmer than normal everywhere except near normal across southeast New Mexico. Precipitation was near to below normal in the northwest half of the state and near to above normal in the southeast half southeast.
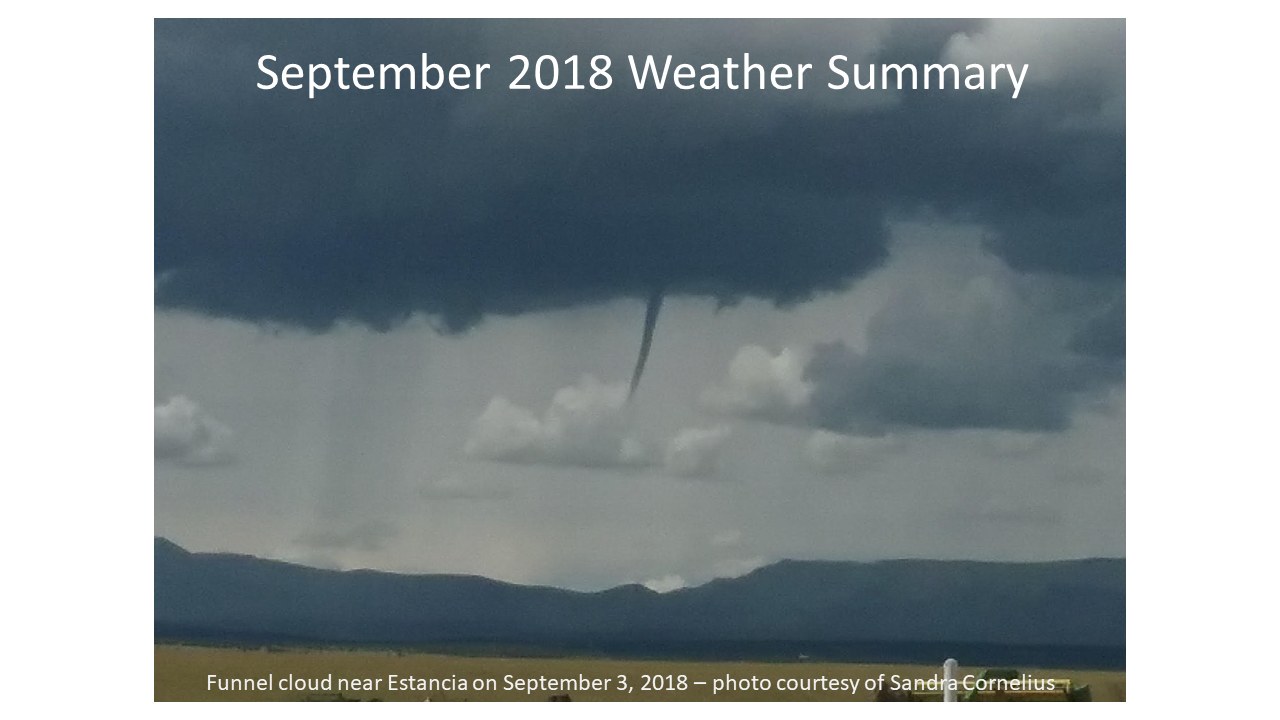
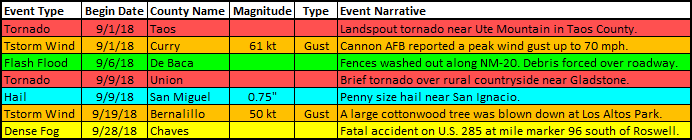
It was a mostly quiet first two weeks across New Mexico. There were two tornadoes though, one on the second, a landspout near Ute Mountain in Taos County, and the second in Union County 25 miles south of Capulin. There was a wonderful rain event on the 19th into the 20th across the entire state. There were at least three dozen locations reporting over an inch of rain, with the Ruidoso area picking up over two inches. It was relatively quiet over the last 10 days of the month.
Statewide Precipitation and Temperatures
| Statewide Precipitation - Actual |
Statewide Temperatures - Actual |
|
|
|
|
|
 |
| Statewide Precipitation - Percent Of Normal |
Statewide Temperatures - Departure From Normal |
 |
|
 |
 |
Climate Cities Temperatures and Precipitation
| Albuquerque |
| |
|
There was 0.84 inches of precipitation measured at the Sunport in September 2018, compared to the normal of 1.08 inches, or 0.24 inches below normal.
The average temperature for Albuquerque in September 2018 was 72.1°, which was 2.8 degrees above the normal of 69.3°.
The average maximum temperature for the month was 84.8°. This was 4.1 degrees above the normal average maximum temperature of 80.7°.
The average minimum temperature for the month was 59.5°. This was 1.6 degrees above the normal average minimum temperature of 57.9 degrees.
Records: 7th - record daily high temperature 92 8th - record daily high temperature 92
|
| |
| Clayton |
| |
|
There was 0.48 inches of precipitation measured at Clayton in September 2018, or 1.19 inches below the average of 1.67 inches.
The average temperature for Clayton in September 2018 was 66.7°, which was 0.9 degrees above the normal of 65.8°.
The average maximum temperature for the month was 80.9°. This was 1.6 degrees below the normal average maximum temperature of 79.3 degrees.
The average minimum temperature for the month was 52.5°. This was 0.2 degrees above the normal average minimum temperature of 52.3°.
Records: none
|
| |
| Roswell |
| |
|
There was 1.34 inches of precipitation reported at Roswell during September of 2018, which is 0.19 inches below the normal of 1.53 inches.
The average temperature in Roswell for September 2018 was 73.5, which is 1.5 degrees above the normal of 72.0 degrees.
The average maximum temperature for the month was 86.8°. This was 1.2 degrees above the average maximum temperature of 85.6 degrees.
The average minimum temperature for the month was 60.3°. This was 1.8 degrees above the normal average minimum temperature of 58.5°
Records: none
|