National Weather Service United States Department of Commerce

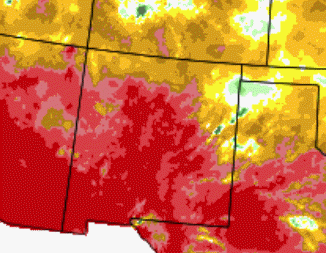
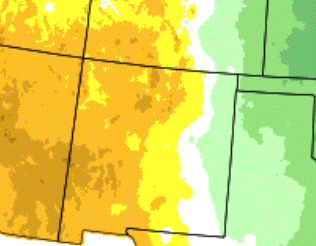
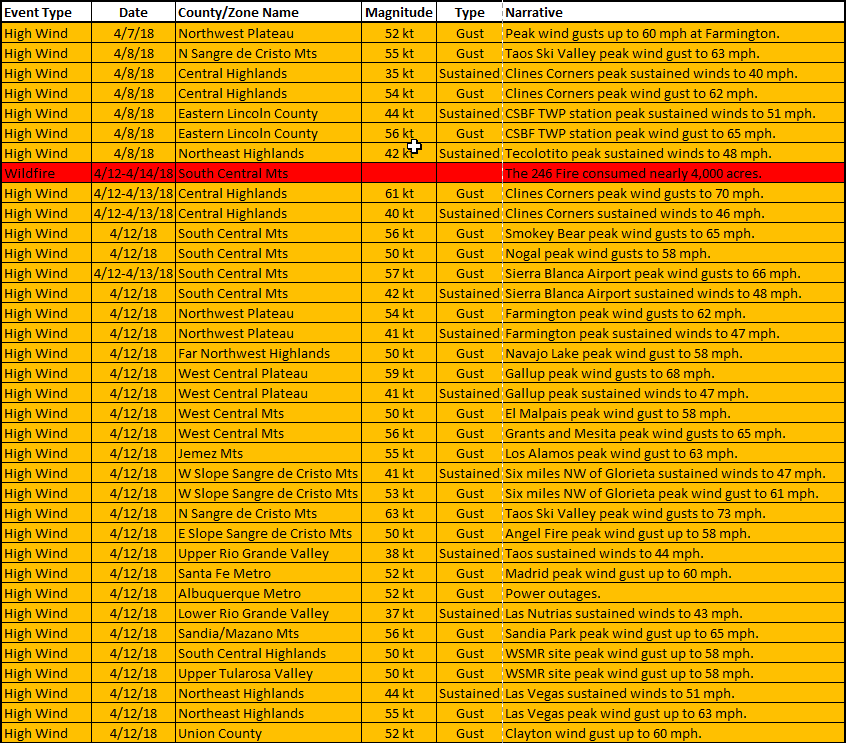
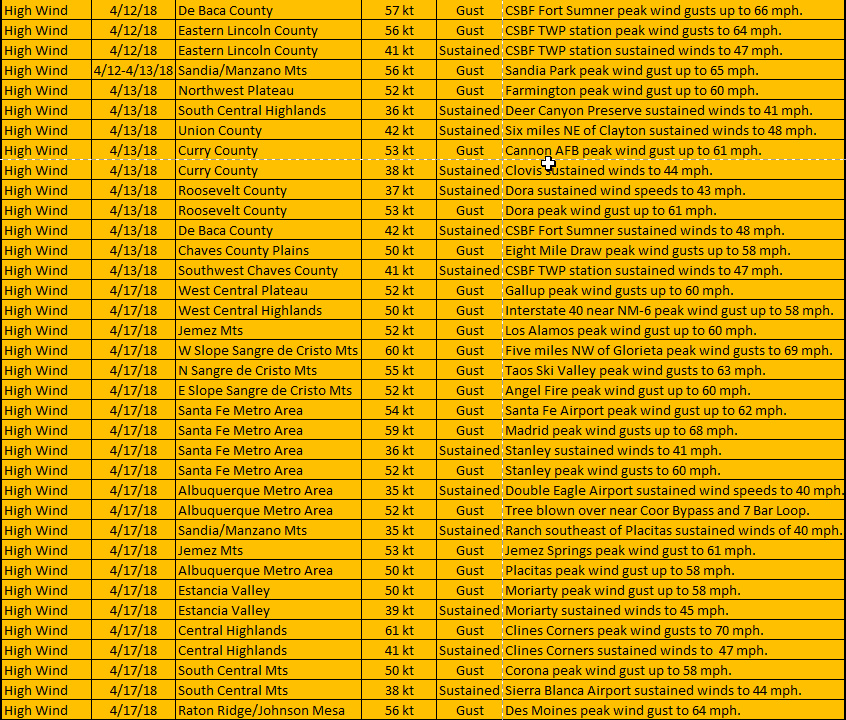
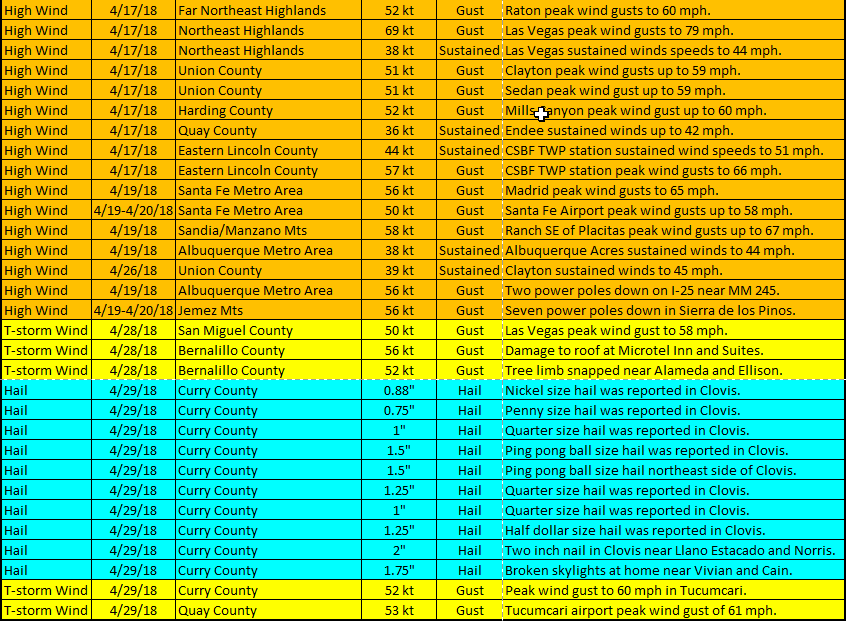
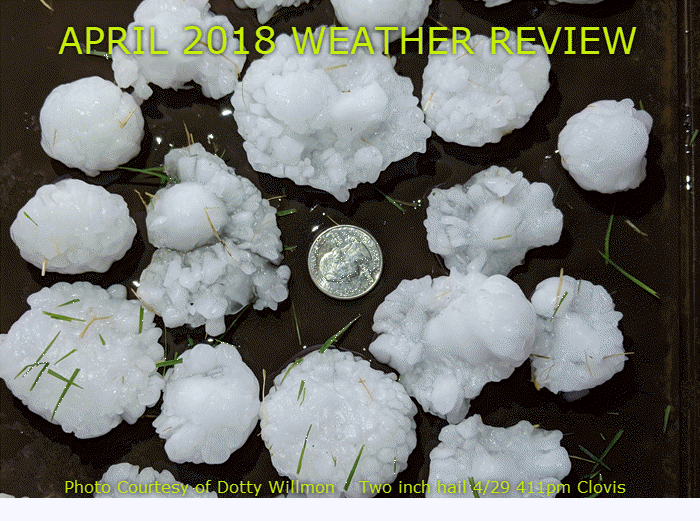
April 2018 was largely warmer and drier than normal. The exception was the eastern plains, which experienced below normal temperatures. 

The first week of April brought virtually no precipitation. Western and southern area temperatures were above normal, while back door cold fronts sent temperatures fluctuating wildly in the northeast, with below normal temperatures after it was all said and done. Strong to high winds struck on the 8th, with a little rain and snow across the north. The next round of wind and precipitation  was more impressive, especially the wind. High and damaging winds were reported on the 12th and 13th. Much colder air blasted into New Mexico on the 13th. Rain and higher elevation snow fell over primarily the northern half of the state. More strong to high winds whipped through the state on the 17th through 19th. Quiet weather was observed from the 20th through 23rd. A potent back door cold front moved down the eastern side of New Mexico on the 24th and spilled into the Rio Grande Valley during the evening, delivering strong winds. Showers and thunderstorms impacted western and central New Mexico on the 28th, then shifted to the east on the 29th, with a few of the storms turning severe around Clovis.  

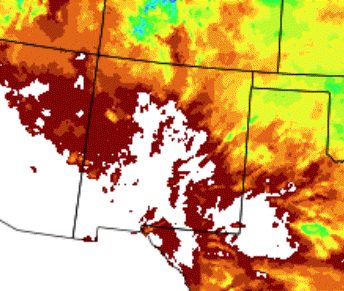
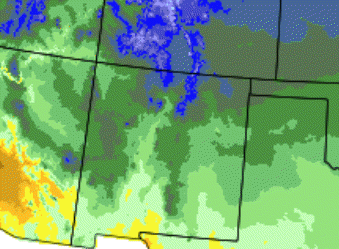
Statewide Precipitation and Temperatures

Statewide Precipitation - Actual

Statewide Temperatures - Actual


Statewide Precipitation - Percent Of Normal Statewide Temperatures - Departure From Normal


                                      Climate Cities Temperatures and Precipitation

Albuquerque
 

There was only a trace of precipitation measured at the Sunport in April 2018, compared to the normal of 0.61 inches. Fifteen other Aprils had only a trace of precipitation, while 1902 received no precipitation at all. 

There was no snow compared to the normal of 0.2 inches.

The average temperature for Albuquerque in April 2018 was 60.1°, which was 4.1 degrees above the normal of 56.0°. This was the 8th warmest April on record. 

The average maximum temperature for the month was 74.5°. This was 5.5 degrees above the normal average maximum temperature of 69.0°.

The average minimum temperature for the month was 45.7°. This was 2.7 degrees above the normal average minimum temperature of 43.0 degrees.

 
 Clayton
 

There was 1.01 inches of precipitation measured at Clayton in April 2018, or 0.07 inches above the average of 0.94 inches.

There was a trace of snow, compared to the normal of 1.5 inches.

The average temperature for Clayton in April 2018 was 50.0°, which was 2.4 degrees below the normal of 52.4°.

The average maximum temperature for the month was 65.8°. This was was 1.2 degrees below the average maximum temperature of 67.0 degrees.

The average minimum temperature for the month was 34.2°. This was 3.5 degrees below the normal average minimum temperature of 37.7°.

 
 Roswell
 

There was 0.03 inches of precipitation reported at Roswell during April 2018, which is 0.58 inches below the normal of 0.61 inches. This was tied for the 27th driest April on record. 

There was no snow in Roswell, compared to the normal of 0.3 inches.

The average temperature in Roswell for April 2018 was 63.0°, which was 2.2 degrees above the normal of 60.8 degrees.

The average maximum temperature for the month was 81.7°. This was 4.9 degrees above the average maximum temperature of 76.8 degrees.

The average minimum temperature for the month was 44.4°. This was 0.3 degrees below the normal average minimum temperature of 44.7°.

Severe Weather 
Storm reports are considered preliminary until a final review is certified in the NWS Storm Data publication.
Certified data is available three to four months post-event at: https://www.ncdc.noaa.gov/stormevents/