National Weather Service United States Department of Commerce
 

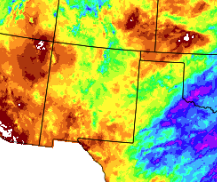
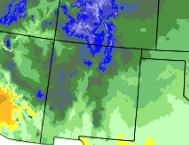
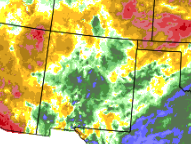
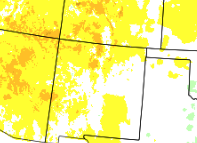
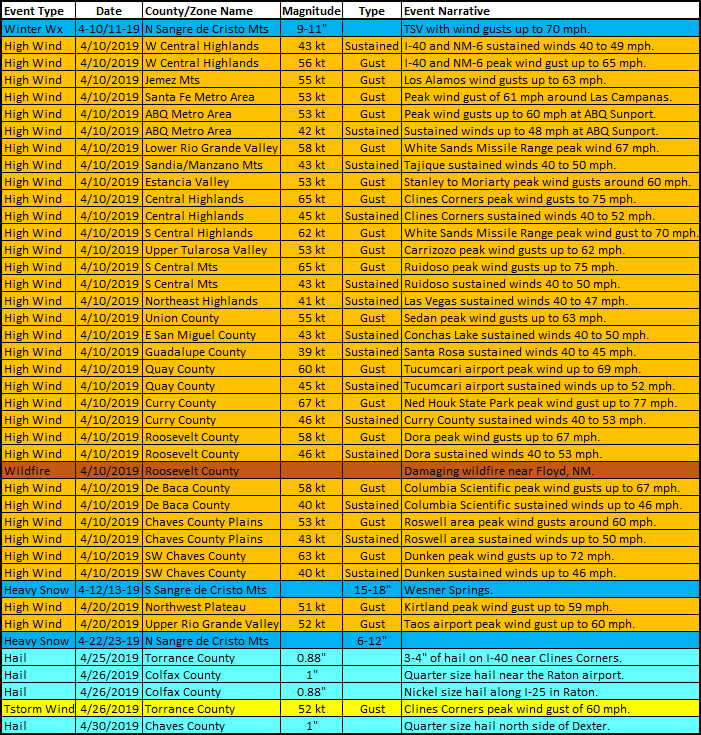
April 2019 was mostly warmer and wetter than normal. Only northwest New Mexico was drier than normal. Parts of eastern and southern New Mexico experienced near normal temperatures, with all other areas were above normal.

The first week of April was mostly quiet, as the storm at the end of March departed on the 1st. There were strong winds on the 3rd. Winds began to increase on the 8th and roared across the state on the 9th and 10th. There were many reports of high winds and wind damage. A few inches of snow fell in the northern mountains on the 9th. A relatively minor snow event occurred on the 13th and 14th over the northern and south central mountains and northeast. Rain fell at many other locations. Another storm struck on the 23rd and 24th with widespread rain and northern mountain snow. Rain and a few severe storms ended the month on the 29th into the 30th. 

Statewide Precipitation and Temperatures

Statewide Precipitation - Actual

Statewide Temperatures - Actual


Statewide Precipitation - Percent Of Normal Statewide Temperatures - Departure From Normal


                                      Climate Cities Temperatures and Precipitation

Albuquerque
 

There was 1.01 inches of precipitation measured at the Sunport in April 2019, compared to the normal of 0.61 inches, 0.40 inches above normal.

There was no snow compared to the normal of 0.2 inches.

The average temperature for Albuquerque in April 2019 was 57.4°, which was 1.4 degrees above the normal of 56.0°. 

The average maximum temperature for the month was 70.3°. This was 1.3 degrees above the normal average maximum temperature of 69.0°.

The average minimum temperature for the month was 44.4°. This was 1.4 degrees above the normal average minimum temperature of 43.0 degrees.

Records: 9th -  Daily maximum temperature tied 83.

 
 Clayton
 

There was 0.76 inches of precipitation measured at Clayton in April 2019, or 0.18 inches below the average of 0.94 inches.

There was 0.1 inches of snow, compared to the normal of 1.5 inches.

The average temperature for Clayton in April 2019 was 53.3°, which was 0.9 degrees above the normal of 52.4°.

The average maximum temperature for the month was 69.0°. This was was 2.0 degrees above the average maximum temperature of 67.0 degrees.

The average minimum temperature for the month was 37.7°. This was exactly the normal average minimum temperature of 37.7°.

 
 Roswell
 

There was 0.56 inches of precipitation reported at Roswell during April 2019, which was 0.05 inches below the normal of 0.61 inches.

There was no snow in Roswell, compared to the normal of 0.3 inches.

The average temperature in Roswell for April 2019 was 64.3°, which was 3.5 degrees above the normal of 60.8 degrees.

The average maximum temperature for the month was 80.9°. This was 4.1 degrees above the average maximum temperature of 76.8 degrees.

The average minimum temperature for the month was 47.6°. This was 2.9 degrees above the normal average minimum temperature of 44.7°.

Records: 9th Daily max temp of 97; 20th  Daily max temp tied at 94; 28th  daily max temp 96. 

Severe Weather 
Storm reports are considered preliminary until a final review is certified in the NWS Storm Data publication.
Certified data is available three to four months post-event at: https://www.ncdc.noaa.gov/stormevents/