National Weather Service United States Department of Commerce


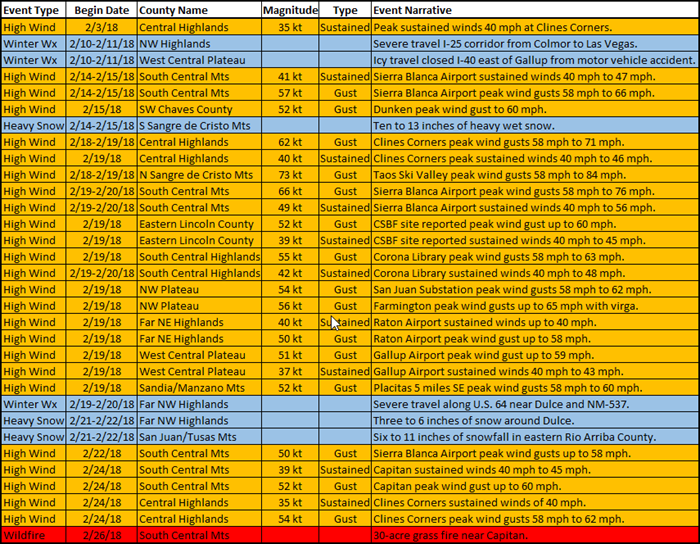
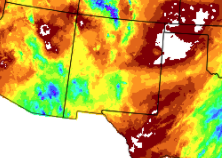
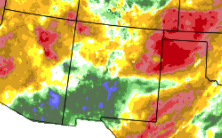
February 2018 was warmer than normal over the west and central areas and near normal in the east. Precipitation was near to below normal in the north and east, and above normal in the southwest and south central. 

A mostly quiet first 9 days of the month with little precipitation and above normal temperatures. We finally received some much needed snow on the 10th into the 11th across the northern half of the state, primarily in the mountains. A break from the 12th to 13th was followed by a nice rain and mountain snow event from late on the 14th through the 15th. Precipitation lingered across the south through the 16th. A more active weather pattern finally set in, with another storm on the 18th into the 20th bringing strong to high winds and some mountain snow. The next storm delivered snow to the northern mountains on the 21st to 22nd.  The remainder of the month was quiet aside from gusty winds and critical fire weather conditions. A weak upper level disturbance arrived on the 28th with light rain and mountain snow. 

Statewide Precipitation and Temperatures

Statewide Precipitation - Actual

Statewide Temperatures - Actual


Statewide Precipitation - Percent Of Normal Statewide Temperatures - Departure From Normal


                                      Climate Cities Temperatures and Precipitation

Albuquerque
 

There was 0.51 inches of precipitation measured at the Sunport in February 2018, compared to the normal of 0.48 inches, or 0.03 inches above normal.

There was 0.4 inches of snow compared to the normal of 2.1 inches.

The average temperature for Albuquerque in February 2018 was 44.1°, which was 2.7 degrees above the normal of 41.4°.

The average maximum temperature for the month was 56.4°. This was 3.9 degrees above the normal average maximum temperature of 52.5°.

The average minimum temperature for the month was 31.8°. This was 1.5 degrees above the normal average minimum temperature of 30.3 degrees.

Records: none

 
 Clayton
 

There was 0.03 inches of precipitation measured at Clayton in February 2018, or 0.31 inches below the average of 0.34 inches.

There was 0.3 inches of snow, compared to the normal of 3.9 inches.

The average temperature for Clayton in February 2018 was 36.7°, which was 0.8 degrees below the normal of 37.5°.

The average maximum temperature for the month was 53.7°. This was 2.4 degrees above the normal average maximum temperature of 51.3 degrees.

The average minimum temperature for the month was 19.6°. This was 4.0 degrees below the normal average minimum temperature of 23.6°.

Records: 21st - low of 3 above zero tied the record low for the day.  

 
 Roswell
 

There was 0.54 inches of precipitation reported at Roswell during February 2018, which is 0.12 inches above the normal of 0.42 inches.

There was no snow in Roswell, compared to the normal of 2.1 inches.

The average temperature in Roswell for February 2018 was 47.6°, which was 1.9 degrees above the normal of 45.7 degrees. 

The average maximum temperature for the month was 64.8°. This was 4.1 degrees above the average maximum temperature of 60.7 degrees.

The average minimum temperature for the month was 30.5°. This was 0.2 degrees below the normal average minimum temperature of 30.7°

Records: 

Severe Weather
Storm reports are considered preliminary until a final review is certified in the NWS Storm Data publication.
Certified data is available three to four months post-event at: https://www.ncdc.noaa.gov/stormevents/