National Weather Service United States Department of Commerce


JANUARY 2019 WEATHER SUMMARY

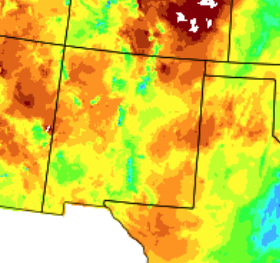
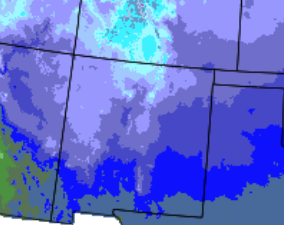
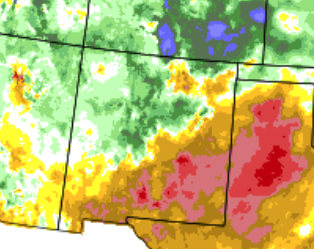
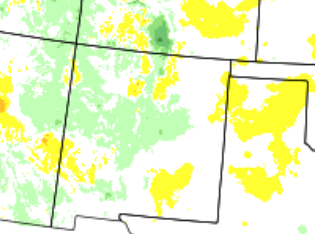
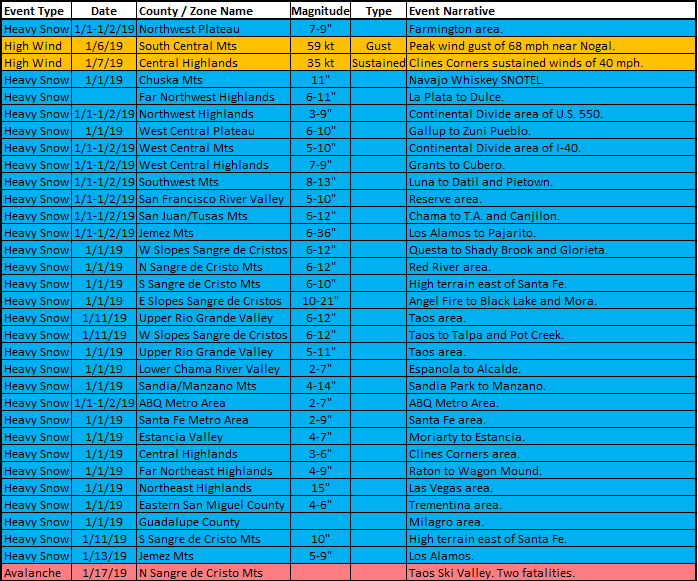
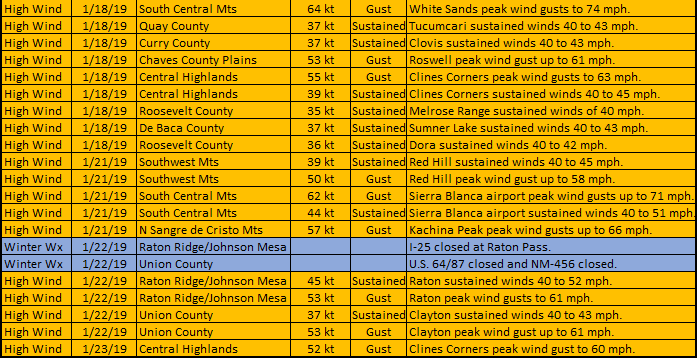
January 2019 will end up close to normal in both temperatures and precipitation. While average temperatures were fairly close to normal, precipitation was more varied. The northwest half of the state had above to well above normal precipitation, while the southeast half had below to much below normal precipitation. 

The 2019 year began with a major winter storm heading out of the state. It was bitter cold to start the new year.  A moderate rain and snow event crossed New Mexico on the 10th through the 11th. Another moderate rain and snow event impacted the state on the 18th, but this storm packed some strong winds. This was the case on the 22nd to 23rd when another storm delivered light to moderate snow and strong winds. 

Statewide Precipitation and Temperatures

Statewide Precipitation - Actual

Statewide Temperatures - Actual


Statewide Precipitation - Percent Of Normal Statewide Temperatures - Departure From Normal


                                      Climate Cities Temperatures and Precipitation

Albuquerque
 

There was 0.52 inches of precipitation measured at the Sunport in January 2019, compared to the normal of 0.38 inches, or 0.14 inches above normal. 

There was 2.0 inches of snow compared to the normal of 2.1 inches. 

The average temperature for Albuquerque in January 2019 was 35.9°, which was 0.5 degrees below the normal of 36.4°.

The average maximum temperature for the month was 46.0°. This was 0.8 degrees below the normal average maximum temperature of 46.8°.

The average minimum temperature for the month was 25.8°. This was 0.3 degrees below the normal average minimum temperature of 26.1 degrees.

 
 Clayton
 

There was 0.40 inches of precipitation measured at Clayton in January 2019, while the average is 0.28 inches, or 0.12 inches above normal. 

There was 2.5 inches of snow, compared to the normal of 5.1 inches.

The average temperature for Clayton in January 2019 was 36.9°, which was 1.5 degrees above the normal of 35.4°.

The average maximum temperature for the month was 50.8°. This was 1.9 degrees above the normal average maximum temperature of 48.9 degrees.

The average minimum temperature for the month was 23.0°. This was 1.1 degrees below the normal average minimum temperature of 21.9°.

 
 Roswell
 

There was 0.03 inches of precipitation reported at Roswell in January 2019, which is 0.35 inches below the normal of 0.38 inches. This was tied for the 20th driest January on record. 

There was 0.0 inches of snow in Roswell compared to the normal of 3.2 inches. Twelve other January's reported no snow going back to 1911.

The average temperature in Roswell for January 2019 was 42.7°, which was 2.1 degrees above the normal of 40.6 degrees. 

The average maximum temperature for the month was 57.7°. This was 2.6 degrees above the average maximum temperature of 55.1 degrees.

The average minimum temperature for the month was 27.7°. This was 1.6 degrees above the normal average minimum temperature of 26.1°

Severe Weather
Storm reports are considered preliminary until a final review is certified in the NWS Storm Data publication.
Certified data is available three to four months post-event at: https://www.ncdc.noaa.gov/stormevents/