National Weather Service United States Department of Commerce


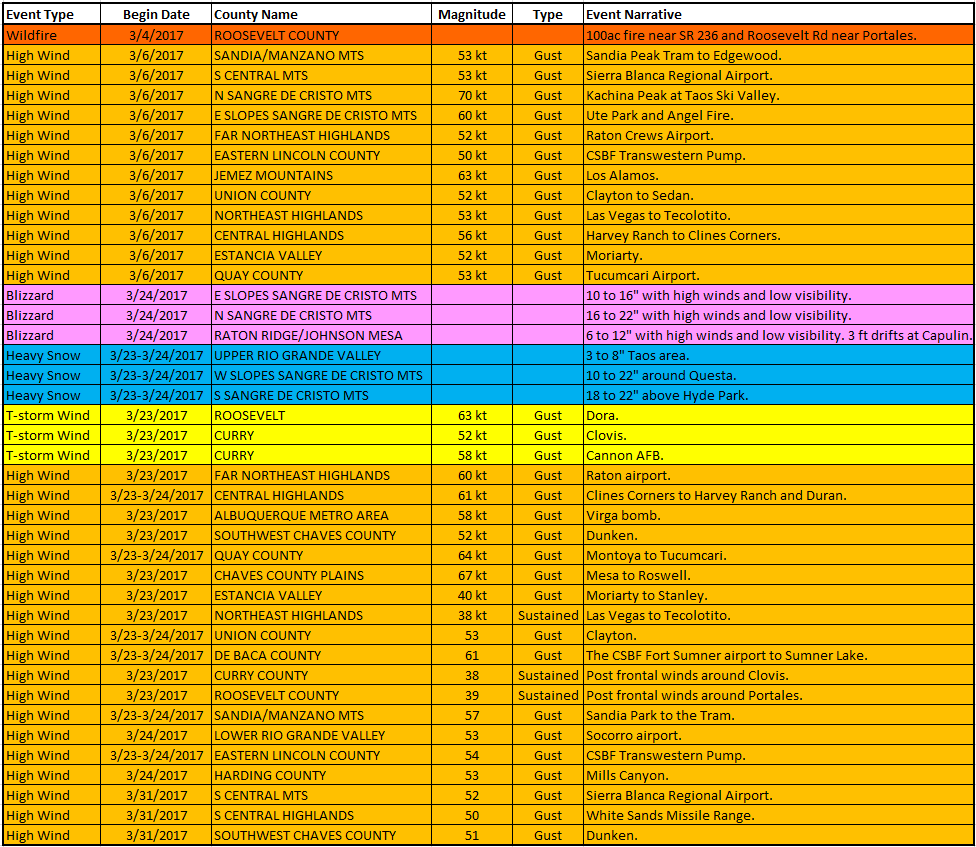
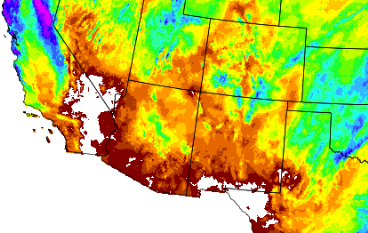
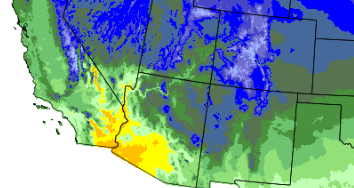
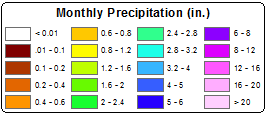
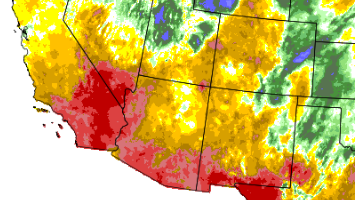
March 2017 was drier and much warmer than normal. Below normal precipitation was common across all but the northeast and east central areas. Temperatures were above to well above normal statewide, and will likely be one of the warmest March's on record. 

Exceptionally strong winds pummeled New Mexico on the 6th. At least two dozen locations had wind gusts near or over 60 mph. Dry and exceptionally warm conditions produced record or near record highs from the 14th through 22nd. A pattern change to cooler and more unsettled weather finally arrived on the 23rd and continued through the end of the month. The storm on the 23rd to 24th delivered rain and mountain snow, along with widespread high winds. Blizzard conditions impacted the east slopes of the Sangre de Cristo Mountains and northeast with up to 21 inches of snow! The next system on the 28th to 29th produced widespread rain and higher mountain snow, as well as on the 31st as another storm approached. 

Statewide Precipitation and Temperatures

Statewide Precipitation - Actual

Statewide Temperatures - Actual


Statewide Precipitation - Percent Of Normal Statewide Temperatures - Departure From Normal


                                      Climate Cities Temperatures and Precipitation

Albuquerque
 

There was 0.20 inches of precipitation measured at the Sunport in March 2017, compared to the normal of 0.57 inches, or 0.30 inches below normal.

There was only a trace of snow compared to the normal of 1.1 inches. There have been 23 March's with just a trace of snow, and 6 with no snow at all. 

The average temperature for Albuquerque in March 2017 was 54.8°, which was an incredible 6.7 degrees above the normal of 48.1°. This was the warmest March on record, breaking the previous warmest set 110 years ago, when March 1907 was 54.6 degrees above normal. 

The average maximum temperature for the month was 69.4°. This was 8.9 degrees above the normal average maximum temperature of 60.5°.

The average minimum temperature for the month was 40.3°. This was 4.6 degrees above the normal average minimum temperature of 35.7 degrees.

 
 Clayton
 

There was 0.80 inches of precipitation measured at Clayton in March 2017, or 0.15 inches below the average of 0.95 inches.

There was only 0.1 inches of snow, compared to the normal of 6.3 inches. Only 11 March's have not reported any measurable snow. 

The average temperature for Clayton in March 2017 was 51.4°, which was an amazing 7.2 degrees above the normal of 44.2°. This was the 2nd warmest March on record, with only 1910 warmer, at 52.5 degrees!

The average maximum temperature for the month was 67.4°. This was 8.9 degrees above the normal average maximum temperature of 58.5 degrees.

The average minimum temperature for the month was 35.3°. This was 5.3 degrees above the normal average minimum temperature of 30.0°.

 
 Roswell
 

There was 0.32 inches of precipitation reported at Roswell during March 2017, which is 0.19 inches below the normal of 0.51 inches.

There was no snow in Roswell, compared to the normal of 1.2 inches.

The average temperature in Roswell for March 2017 was 60.2°, which was an astounding 7.6 degrees above the normal of 52.6 degrees. This was the warmest March on record, smashing the old record of 58.3 degrees way back in 1907!

The average maximum temperature for the month was 78.9°. This was 10.6 degrees above the average maximum temperature of 68.3 degrees. This average high would have been 2.1 degrees above April's average high temperature!

The average minimum temperature for the month was 41.5°. This was 4.6 degrees above the normal average minimum temperature of 36.9°.

Severe Weather
Storm reports are considered preliminary until a final review is certified in the NWS Storm Data publication.
Certified data is available three to four months post-event at: https://www.ncdc.noaa.gov/stormevents/