|
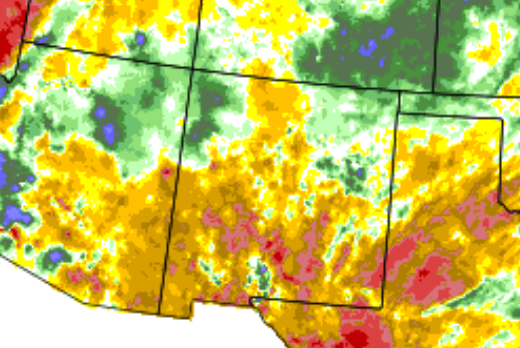
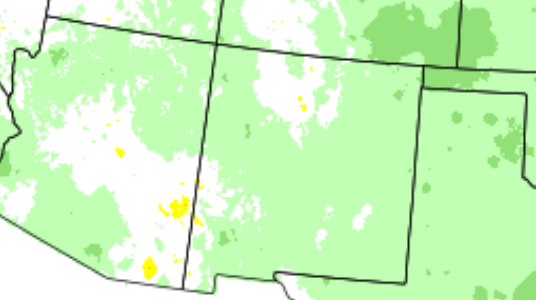
May 2017 produced near to below normal temperatures, and near to below normal precipitation. However, there were a few pockets of above normal precipitation over northwest and far northeast New Mexico.
The first week of May was quiet with dry weather and mostly above normal temperatures. That all changed on the 8th and 9th when severe weather struck eastern New Mexico on the afternoon and evening of the 8th, and much of northern and central New Mexico on the 9th. The amazing fact about the severe weather outbreak on the 9th was how widespread it was, and the duration of severe weather reports. The first report of severe weather, one inch hail, was reported near Fruitland in northwest New Mexico at 630am, while the last report of severe weather, again one inch hail, occurred near Portales at 1145pm MDT. In between, up to 2 inch diameter hail, a few tornadoes, and straight-line wind damage were documented. In all, this was one of the largest and longest duration outbreaks of severe weather ever recorded in New Mexico. Strong to high winds, and rain, including thunderstorms, were fairly widespread on the 16th. Large hail pelted the east central plains on the 22nd. Showers and thunderstorms returned late in the Memorial Day weekend through the end of the month. In between, from the 10th through 27th, mostly dry and warm weather was the norm.
|
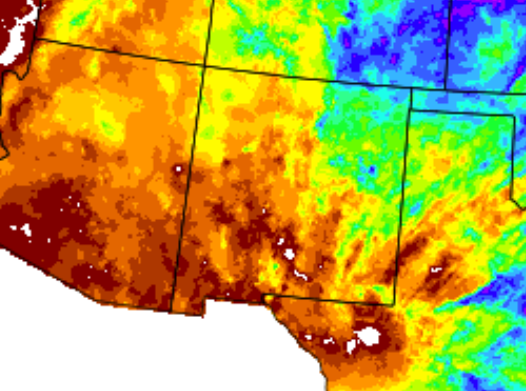
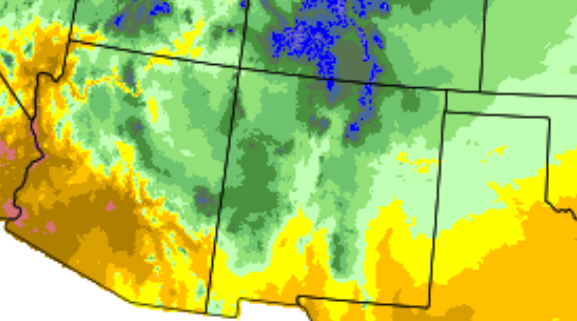
Statewide Precipitation and Temperatures
Climate Cities Temperatures and Precipitation
| Albuquerque |
| |
|
There was 0.24 inches of precipitation measured at the Sunport in May 2017, compared to the normal of 0.50 inches, or 0.26 inches below normal.
The average temperature for Albuquerque in May 2017 was 64.8°, which was 0.8 degrees below the normal of 65.6°.
The average maximum temperature for the month was 78.4°. This was 0.4 degrees below the normal average maximum temperature of 78.8°.
The average minimum temperature for the month was 51.2°. This was 1.3 degrees below the normal average minimum temperature of 52.5 degrees.
|
| |
| Clayton |
| |
|
There was 2.24 inches of precipitation measured at Clayton in May 2017, or 0.28 inches above the average of 1.96 inches.
The average temperature for Clayton in May 2017 was 58.3°, which was 3.2 degrees below the normal of 61.5°.
The average maximum temperature for the month was 73.4°. This was 2.2 degrees below the normal average maximum temperature of 75.6 degrees.
The average minimum temperature for the month was 43.2°. This was 4.1 degrees below the normal average minimum temperature of 47.3°.
|
| |
| Roswell |
| |
|
There was 0.54 inches of precipitation reported at Roswell during May 2017, which is 0.71 inches below the normal of 1.25 inches.
The average temperature in Roswell for May 2017 was 70.1°, which was equal to the normal of 70.1 degrees.
The average maximum temperature for the month was 86.9°. This was 1.5 degrees above the average maximum temperature of 85.4 degrees.
The average minimum temperature for the month was 53.2°. This was 1.5 degrees below the normal average minimum temperature of 54.7°.
|
|
Severe Weather
Storm reports are considered preliminary until a final review is certified in the NWS Storm Data publication.
Certified data is available three to four months post-event at: https://www.ncdc.noaa.gov/stormevents/
|
|
.19.2013.png)