National Weather Service United States Department of Commerce


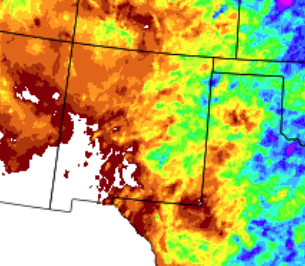
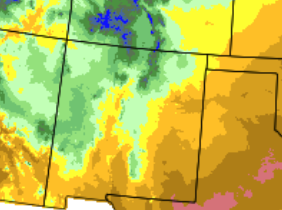
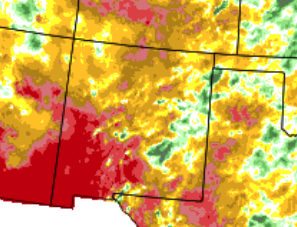
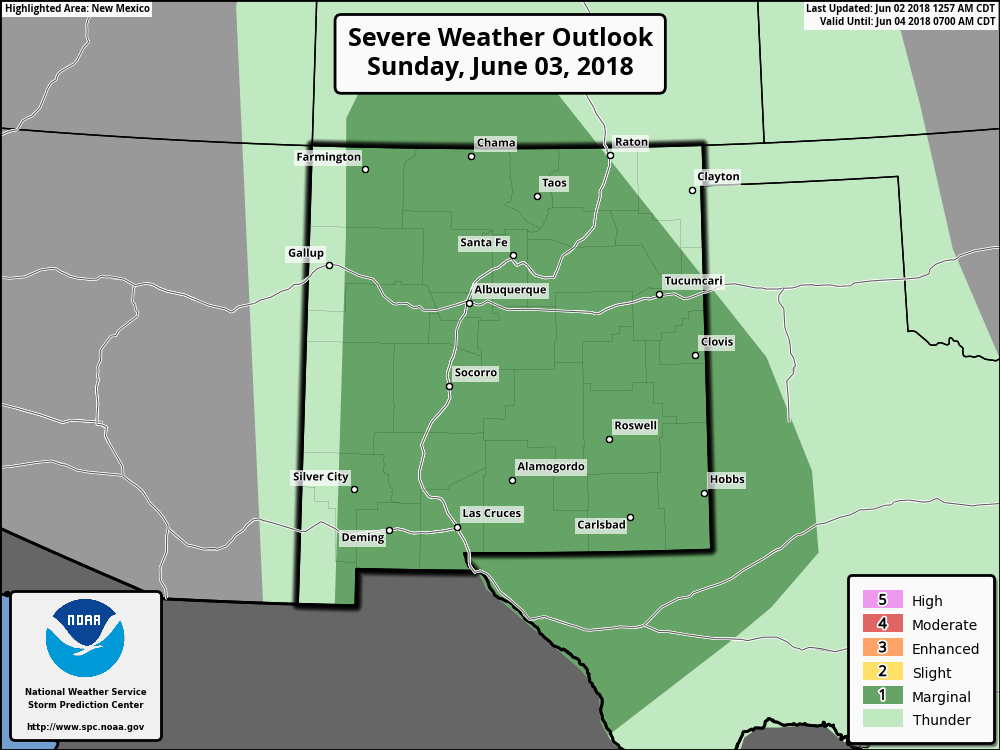
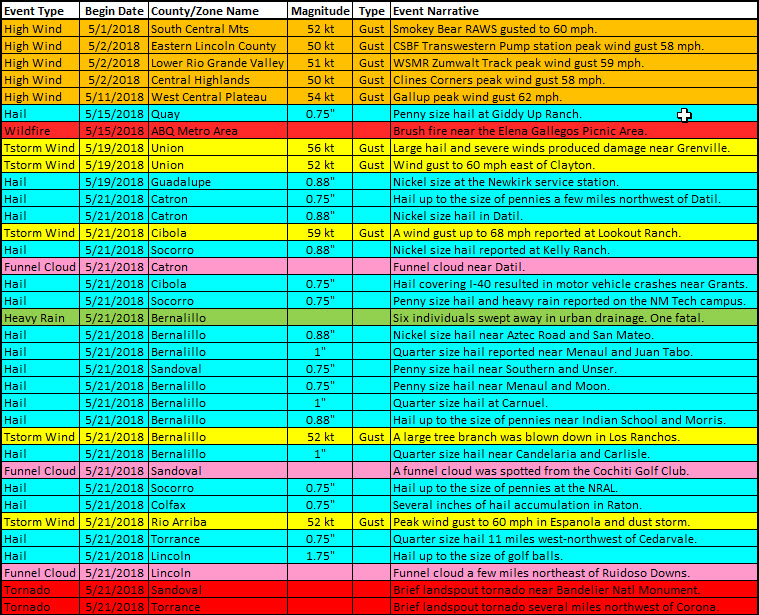
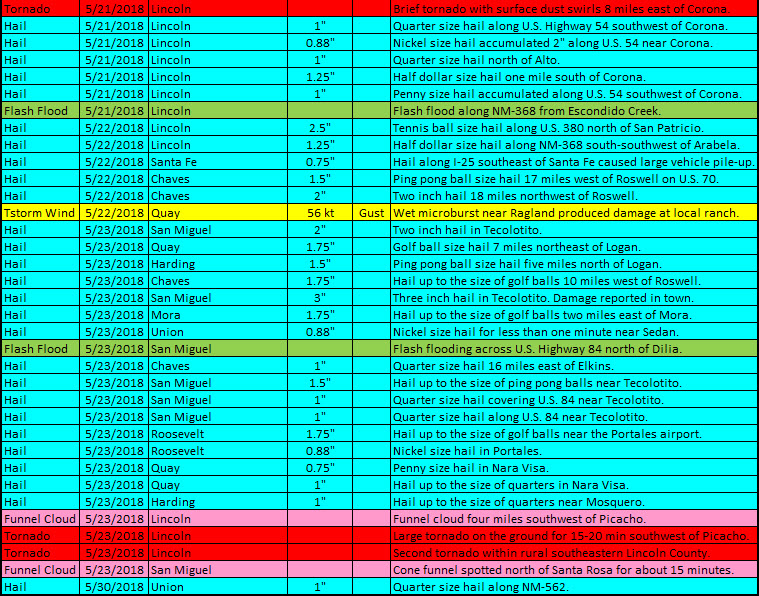
May 2018 was warmer and drier than normal. 

The first half of May was rather quiet. There were strong winds and a little bit of rain over the first 3 days of the month, then more strong winds on the 11th and 12th. A little rain and hail fell in northeast New Mexico on the 15th. The second half of the month was a little more active. Strong winds were noted on the 18th, then minor rain and hail fell in the east on the 19th. A more widespread rain and hail event was observed on the 21st to 22nd, then a major outbreak of severe weather pounded the east on the 23rd. Quiet, dry, and very warm weather ensued for the last week of the month.

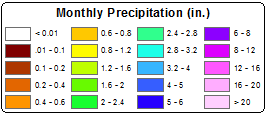
Statewide Precipitation and Temperatures

Statewide Precipitation - Actual

Statewide Temperatures - Actual


Statewide Precipitation - Percent Of Normal Statewide Temperatures - Departure From Normal


                                      Climate Cities Temperatures and Precipitation

Albuquerque
 

There was 0.12 inches of precipitation measured at the Sunport in May 2018, compared to the normal of 0.50 inches, or 0.38 inches below normal.

The average temperature for Albuquerque in May 2018 was 69.8°, which was 4.2 degrees above the normal of 65.6°. This was the 5th warmest May on record. 

The average maximum temperature for the month was 84.5°. This was 5.7 degrees above the normal average maximum temperature of 78.8°.

The average minimum temperature for the month was 55.2°. This was 2.7 degrees above the normal average minimum temperature of 52.5 degrees.

 
 Clayton
 

There was 1.65 inches of precipitation measured at Clayton in May 2018, or 0.31 inches below the average of 1.96 inches.

The average temperature for Clayton in May 2018 was 67.0°, which was 5.5 degrees above the normal of 61.5°. This was the warmest May on record!  

The average maximum temperature for the month was 83.0°. This was 7.4 degrees above the normal average maximum temperature of 75.6 degrees.

The average minimum temperature for the month was 51.0°. This was 3.7 degrees above the normal average minimum temperature of 47.3°.

 
 Roswell
 

There was 0.52 inches of precipitation reported at Roswell during May 2018, which is 0.73 inches below the normal of 1.25 inches.

The average temperature in Roswell for May 2018 was 76.6°, which was 6.5 degrees above the normal of 70.1 degrees. This was the 2nd warmest May on record! 

The average maximum temperature for the month was 94.8°. This was 9.4 degrees above the average maximum temperature of 85.4 degrees.

The average minimum temperature for the month was 58.4°. This was 3.7 degrees below the normal average minimum temperature of 54.7°.

Severe Weather
Storm reports are considered preliminary until a final review is certified in the NWS Storm Data publication.
Certified data is available three to four months post-event at: https://www.ncdc.noaa.gov/stormevents/