|
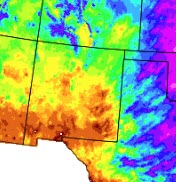
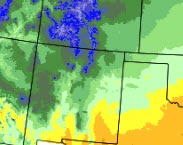
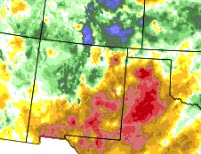
May 2019 was cooler than normal across all of New Mexico, more so in the central and western areas. Precipitation was quite varied with above normal rainfall in the northwest, below norms in the southeast, and near normal elsewhere
It was pretty quiet through the first week of the month, with isolated large hail reports in the east on the 4th, 5th and 7th. A late season snowstorm hit on the 9th and 10th with impressive snowfall on the northern mountains. Strong winds buffeted the state on the 21st and 23rd, while 6 inches of snow fell on Capulin on the 21st. Strong winds struck again on the 26th. Damaging winds, hail and a couple of tornadoes plagued the state on the 30th.
|
Statewide Precipitation and Temperatures
| Statewide Precipitation - Actual |
Statewide Temperatures - Actual
|
|
|
|
|
|
 |
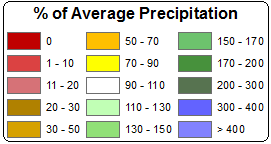
| Statewide Precipitation - Percent Of Normal |
Statewide Temperatures - Departure From Normal |
|
|

|
 |
 |
Climate Cities Temperatures and Precipitation
| Albuquerque |
| |
|
There was 0.24 inches of precipitation measured at the Sunport in May 2019, compared to the normal of 0.50 inches, or 0.26 inches below normal.
The average temperature for Albuquerque in May 2019 was 61.6°, which was 4 degrees below the normal of 65.6°.
The average maximum temperature for the month was 75.0°. This was 3.8 degrees below the normal average maximum temperature of 78.8°.
The average minimum temperature for the month was 48.2°. This was 4.3 degrees below the normal average minimum temperature of 52.5 degrees.
|
| |
| Clayton |
| |
|
There was 1.85 inches of precipitation measured at Clayton in May 2019, or -0.11 inches below the average of 1.96 inches.
The average temperature for Clayton in May 2018 was 56.9°, which was 4.6 degrees below the normal of 61.5°.
The average maximum temperature for the month was 71.1°. This was 4.5 degrees below the normal average maximum temperature of 75.6 degrees.
The average minimum temperature for the month was 42.7°. This was 4.6 degrees below the normal average minimum temperature of 47.3°.
|
| |
| Roswell |
| |
|
There was 0.11 inches of precipitation reported at Roswell during May 2019, which is 1.4 inches below the normal of 1.25 inches.
The average temperature in Roswell for May 2019 was 70.7°, which was 0.6 degrees above the normal of 70.1 degrees.
The average maximum temperature for the month was 86.5°. This was 1.1 degrees above the average maximum temperature of 85.4 degrees.
The average minimum temperature for the month was 54.9°. This was 0.2 degrees above the normal average minimum temperature of 54.7°.
|
|
Severe Weather
Storm reports are considered preliminary until a final review is certified in the NWS Storm Data publication.
Certified data is available three to four months post-event at: https://www.ncdc.noaa.gov/stormevents/


|
|

.19.2013.png)

