
A couple of frontal boundaries will move east and south from the Plains to the Gulf and Atlantic coastlines. These boundaries will focus showers and thunderstorms through the weekend, with scattered severe thunderstorms from the Southern Plains and across the Gulf Coast states. Locally heavy rainfall may also occur, which may be welcome news across drought areas. Meanwhile, heat spreads westward. Read More >
|
What are the Point Forecast Matrices?
|
|
|
The National Weather Service Forecast Office in Albuquerque, NM produces detailed, point-specific forecasts in a matrix format known as "Point Forecast Matrices". The Point Forecast Matrices are issued around 4:00 a.m. and 4:00 p.m. local time, with updates issued as needed. This guide will explain how to read and interpret this product. A Point Forecast Matrix, or PFM, displays forecast weather parameters in 3-hour, 6-hour and 12-hour intervals for a specific location. The weather parameters, including temperatures, winds and precipitation, are forecast at varying time intervals and displayed in a matrix, or tabular, format. PFM forecasts are generated for eight locations in our service area or "County Warning Area" (CWA). Each PFM consists of 3-hourly and 12-hourly forecasts for up to 60 hours as well as 6-hourly and 12-hourly forecasts for 66 hours through day 7. The product is available via all NWS routine distribution channels, and on our website using our Product Selector. |
|
|
How to Read and Interpret Point Forecast Matrices
|
|
|
An example of a Point Forecast Matrix for Santa Fe from 6 December 2006 is displayed below. Several forecast parameters are included in the PFM, and are numbered in the example 1 through 14. Some parameters that can be included in the PFM, were not generated for the Santa Fe example. These are listed in red. Descriptions of the specific forecast parameters are located below the PFM example. The first lines of the PFM contain the site and county (SANTA FE-SANTA FE NM), the location in degrees of latitude and longitude (35.62N 106.08W), and the date of issuance (356 AM MST WED DEC 6 2006). The remainder of the product is produced in a matrix format and contains two blocks of data. The upper portion or first block of the matrix includes forecast parameters for the first 60 hours of the forecast for 3- and 12-hour periods. The second block includes forecast data for days 3 through 7 in 6- and 12-hour periods. Each block can be identified by three timeline headers containing the forecast days using the date and day of the week, the time in Universal Time Coordinate (UTC), and the time in local time. In the example below, the forecast covers the period from 3:00 a.m. MST on Wednesday, December 6, 2006 through 6:00 p.m. on Tuesday, December 12, 2006. |
|
SANTA FE-SANTA FE NM
    35.62N 106.08W
    356 AM MST WED DEC 6 2006
DATE              WED 12/06/06            THU 12/07/06            FRI 12/08/06
    UTC 3HRLY      10 13 16 19 22 01 04 07 10 13 16 19 22 01 04 07 10 13 16 19 22 01
    MST 3HRLY      03 06 09 12 15 18 21 00 03 06 09 12 15 18 21 00 03 06 09 12 15 18
1. MAX/MIN                       49          22          44          16          49
 2. TEMP              22 28 44 49 36 29 28 24 23 28 40 44 31 23 22 18 17 25 43 49 35
 3. DEWPT              9 11 13 13 13 13 13 13 14 16 18 17 16 16 15 15 14 15 15 15 15
 4. RH                57 48 28 23 38 51 53 62 68 60 41 33 53 74 74 88 88 65 32 25 43
 5. WIND DIR           N NE SW NW  W SE NE NE NE  E SE  S  S  S  S SE SE  W NW  W  W
 6. WIND SPD          25 25 11  8  5  5 18 23 27 27 26  9  5  4  5 11 16 17 17 14 11
 6a.WIND GUST         35 35                   39 39 36
 7. CLOUDS            SC SC SC SC SC SC SC SC SC SC SC SC SC SC SC SC SC SC SC SC SC
 8. POP 12HR                       0           0           0            0          5
 9. QPF 12HR                       0           0           0            0          0
10. SNOW 12HR                  00-00       00-00       00-00
11. precipitation type: see an example in the second block
12. OBVIS  Not generated in this example, see notes below for inclusion
13. WIND CHILL         5 13          23 15  9  6 13 29    25 17  14  5  2 11      27
14. MIN CHILL          5     3          14     6     5    25     14     2    1    27
DATE                 SAT 12/09/06  SUN 12/10/06   MON 12/11/06   TUE 12/12/06
    UTC 6HRLY      07    13 19 01 07   13 19 01 07    13 19 01 07    13 19 01
    MST 6HRLY      00    06 12 18 00   06 12 18 00    06 12 18 00    06 12 18
MIN/MAX              21    46      22    47       23    43       22    42
    TEMP           26    22 42 35 27   23 43 36 28    24 39 33 26    23 38 33
    DEWPT          14    15 13 13 18   16 18 14 16    16 18 18 15    14 15 17
5.  PWIND DIR            NW    NW       N     W       NW    NW        N    NW
6.  WIND CHAR            GN    GN      LT    GN       LT    LT       LT    GN
7.  AVG CLOUDS     SC    SC SC SC SC   SC SC SC SC    SC B1 B1 SC    SC B1 B1
    POP 12HR              5     5       5    10       10    10       10    5
11. RAIN SHWRS                                            S  S
11. SNOWSHWRS                                    S     S        S     S
|
|
|
Forecast Parameters Defined and Described
|
|
|
1. MAX/MIN (Alternatively labeled as MIN/MAX for afternoon issuance) |
|
|
2. TEMP TEMP is a snapshot of the expected temperature in degrees F valid at the indicated hour. The temperature is right justified in the column below the hour to which it refers. TEMP is forecast at 3-hour intervals through 60 hours (first block), then 6-hour intervals through Day 7 (second block). |
|
|
3. DEWPT DEWPT is a snapshot of the expected dew point temperature in degrees F for the same time periods as its corresponding temperature forecast. DEWPT is located directly below the temperature line. |
|
|
4. RH The relative humidity (RH) is a snapshot of the expected RH for the same time periods as its corresponding temperature and dew point forecast. The RH row is located directly below the “DEWPT” row. RH is available at 3-hour increments through 60 hours (first block only). |
|
|
5. WIND DIR WIND DIR is a snapshot of the expected wind direction forecast to occur at the indicated hour, using the 8 points of a compass (i.e., N, NE, E, SE, S, SW, W, NW). If a calm wind is forecast, double zeros (00) will be listed in place of a wind direction. WIND DIR is located below the hour to which it refers and is available in 3-hour increments out to 60 hours (first block only). In the 6HRLY (second) block, PWIND DIR is the “predominant” wind direction at the point during the 12-hour period between 6:00 a.m. and 6:00 p.m., or 6:00 p.m. and 6:00 a.m. local time. PWIND DIR is valid beyond 60 hours through Day 7 (second block only). |
|
|
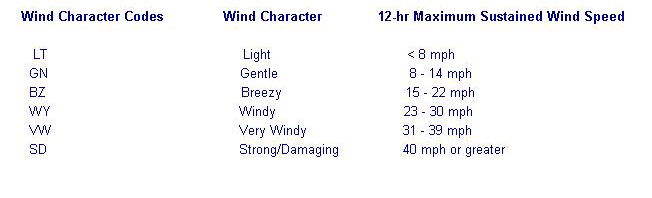
6. WIND SPD WIND SPD is a snapshot of the sustained wind speed in miles per hour (MPH) forecast to occur at the indicated hour. If a calm wind is forecast, double zeros (00) will be listed in place of a wind speed. WIND SPD is valid in 3-hour increments out to 60 hours (first block). WIND CHAR codes are used beyond 60 hours through Day 7 of the forecast (second block) and denote the character of the wind for the 12-hour period between 6:00 a.m. and 6:00 p.m., or 6:00 p.m. and 6:00 a.m. WIND CHAR is comprised of range categories used in conjunction with deterministic wind speeds. Each range category is equated to a descriptive wind term, i.e., a “wind character” to best describe the MAXIMUM SUSTAINED wind speed during the period. |
|
 |
|
|
6a. WIND GST A wind gust row will appear in the 3HRLY block whenever forecasted wind gusts exceed the sustained wind speed (WIND SPD) by at least 10 MPH. WIND GUST is a snapshot valid on the hour indicated at the top of the corresponding column. WIND GUST is a snapshot of gusts of wind occurring at the indicated hour and is valid in 3-hour increments through 60 hours (first block only). |
|
|
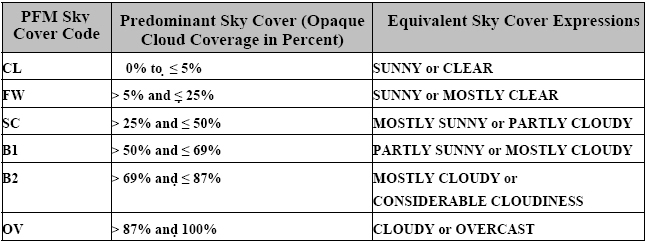
7. CLOUDS The CLOUDS category provides a snapshot of sky coverage during the indicated hour. CLOUDS is divided into five category codes ranging from clear to overcast . Each code represents an equivalent percentage of sky cover in percent. CLOUDS parameter is included in 3-hour time intervals out to 60 hours. In the 6HRLY section (lower block), AVG CLOUDS is valid for 6-hour increments beyond 60 hours through Day 7 and indicates the average amount of all clouds during the 6-hour period ending on the hour indicated at the top of the column. |
|
 |
|
| 8. POP 12HR
Probability of Precipitation (POP), is defined as the likelihood, expressed as a percent, of a measurable precipitation event (1/100th of an inch) at the specified point of the PFM. The “12HR” refers to the 12-hour valid time ending at 6:00 a.m. or 6:00 p.m. local time (0600 or 1800). POP 12HR values that may appear in the PFM are 0, 5, 10, 20, 30, 40, 50, 60, 70, 80, 90, and 100. The POP 12HR value is right justified in the column beneath the hour defining the ending time of the valid period. |
|
 |
|
|
9. QPF 12HR This parameter, quantitative precipitation forecast (QPF) represents the total amount of liquid precipitation, in inches, expected during a 12-hour period ending at 6:00 a.m., or 6:00 p.m. local time at the given point. The QPF is presented in single values. The QPF 12HR value is right justified in the column beneath the hour defining the ending time of the expected precipitation. QPF 12HR is forecast out to 60 hours (first block only). |
|
|
10. SNOW 12HR SNOW 12HR is the expected value of total snowfall accumulation (in whole inches) forecast to occur at the specific point during a 12-hour period ending at 6:00 a.m. or 6:00 p.m. local time. SNOW 12HR will only appear during the locally defined winter period. The snow parameter contains 1 to 5 alphanumeric characters which are right justified in the column below the hour defining the ending time of the precipitation period. SNOW 12HR will appear as a one or two digit number (1, 4, 12) or as a specified range (2-4, 6-8). When no snowfall is forecast during the locally specified winter period, double zeros (00-00) will appear in the row. Snowfall that is not measurable (less than 0.1 inch of frozen precipitation) is referred to as a trace. A trace of snow is depicted by a “T.” SNOW 12HR is forecast out to 36 hours. |
|
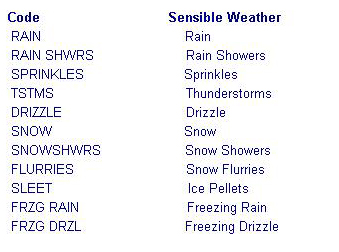
| 11. PRECIPITATION TYPE AND CATEGORY
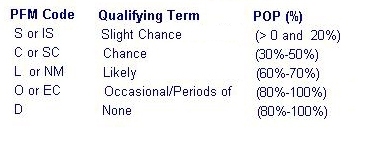
The PFM may list several types of precipitation, on consecutive lines. Precipitation types only appear in the PFM if they are forecast to occur at the specified point during the seven day forecast. Precipitation type codes are listed in the far left column of the PFM. For each type of precipitation that is forecast, an associated POP category is specified within the body of the product. The POP expression for the indicated precipitation type is valid at the hour specified by the column header. Precipitation type expressions are forecast at three hour time intervals out to 60 hours (first block), then 12-hour time intervals beyond 60 hours through Day 7 (second block). |
|
 |
|
| Probability of precipitation codes and their equivalent POP definitions are listed below: | |
|
|
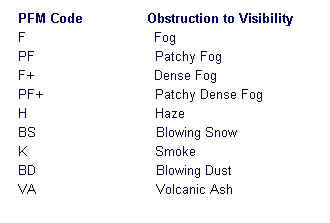
| 12. OBVIS
If an obstruction to visibility (OBVIS) is forecast for the zone, a row labeled OBVIS will be listed underneath any forecast of precipitation. If no precipitation is forecast, then OBVIS will be listed under the row labeled AVG CLOUDS. OBVIS is forecast at 3-hour intervals through 60 hours (first block). |
|
 |
|
| 13. WIND CHILL and HEAT INDEX
Wind Chill and Heat Index are included seasonally based upon locally defined criteria. The decision on whether to include or exclude these parameters is determined by the local WFO criteria. The Wind Chill and Heat Index are forecast out to 60 hours (first block). |
|
| 14. MIN CHILL and MAX HEAT
When WIND CHILL or HEAT INDEX values appear in the PFM, a 6-hour minimum wind chill or maximum heat index will appear in the following row. These values indicate the minimum wind chill/maximum heat index forecast to occur during the 6-hour period. MIN CHILL and MAX HEAT are included at 6-hr intervals out to 60 hours (top block). |

