El Niño and La Niña Information
Current Conditions
| Tropical Pacific Sea Surface Temperatures | Tropical Pacific Sea Surface Temperature Anomalies |
 |
 |
| Tropical Pacific sea surface temperatures (left image) and associated anomalies (right image). Click images to enlarge. Images courtesy of the Climate Prediction Center. | |
What is El Niño-Southern Oscillation (ENSO)?
Note: Most of the information in this article is courtesy of climate.gov.
The El Niño-Southern Oscillation (ENSO) is a recurring climate pattern involving changes in the temperature of waters in the central and eastern tropical Pacific Ocean. On periods ranging from about three to seven years, the surface waters across a large swath of the tropical Pacific Ocean warm or cool by anywhere from 1°C to 3°C, compared to normal.
This oscillating warming and cooling pattern, referred to as the ENSO cycle, directly affects rainfall distribution in the tropics and can have a strong influence on weather across the United States and other parts of the world. El Niño and La Niña are the extreme phases of the ENSO cycle; between these two phases is a third phase called ENSO-neutral.
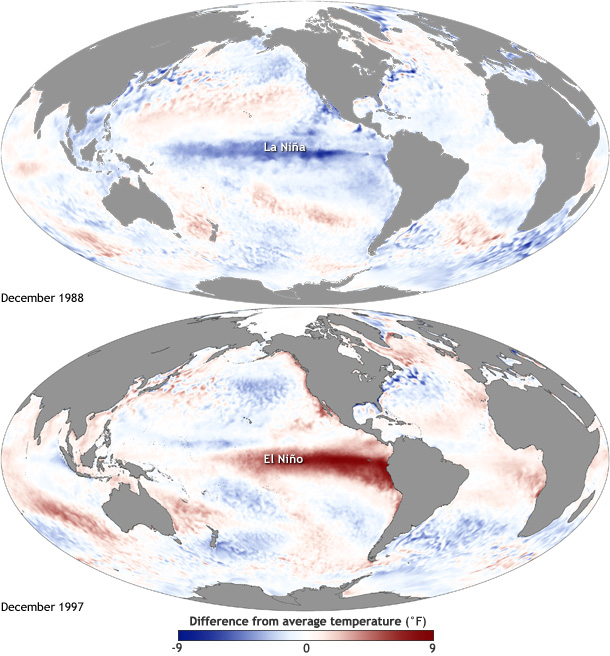 |
|
Maps of sea surface temperature anomaly in the Pacific Ocean during a strong La Niña (top, December 1988) and a strong El Niño (bottom, December 1997). Maps by NOAA Climate.gov. |
ENSO is one of the most important climate phenomena on Earth due to its ability to change the global atmospheric circulation, which in turn, influences temperature and precipitation across the globe. We also focus on ENSO because we can often predict its arrival many seasons in advance of its strongest impacts on weather and climate.
So, by now, you might have noticed that while “ENSO” is a nice catchall acronym for all three states, that acronym doesn’t actually have the word La Niña in it. Why is that? Well, that is a fluke of history. Before La Niña was even recognized, South American fisherman noticed the warm up of coastal waters occurred every so often around Christmas. They referred to the warming as “El Niño,” (niño being Spanish for a boy child) in connection with the Christmas holiday.
Sir Gilbert Walker discovered the “Southern Oscillation,” or large-scale changes in sea level pressure across Indonesia and the tropical Pacific. However, he did not recognize that it was linked to changes in the Pacific Ocean or El Niño. It wasn’t until the late 1960s that Jacob Bjerknes and others realized that the changes in the ocean and the atmosphere were connected and the hybrid term “ENSO” was born. It wasn’t until the 1980s or later that the terms La Niña and Neutral gained prominence.
.png) |
| Typical winter impacts associated with ENSO neutral events. Colder probabilities are favored across north-central and northeast portions of the US, due to a polar jet stream shifted further south. Meanwhile, warmer probabilities are favored across ths southern US, with above normal precipitation favored across portions of the southeast US. Image courtesy of Ray Wolf, National Weather Serivce. |
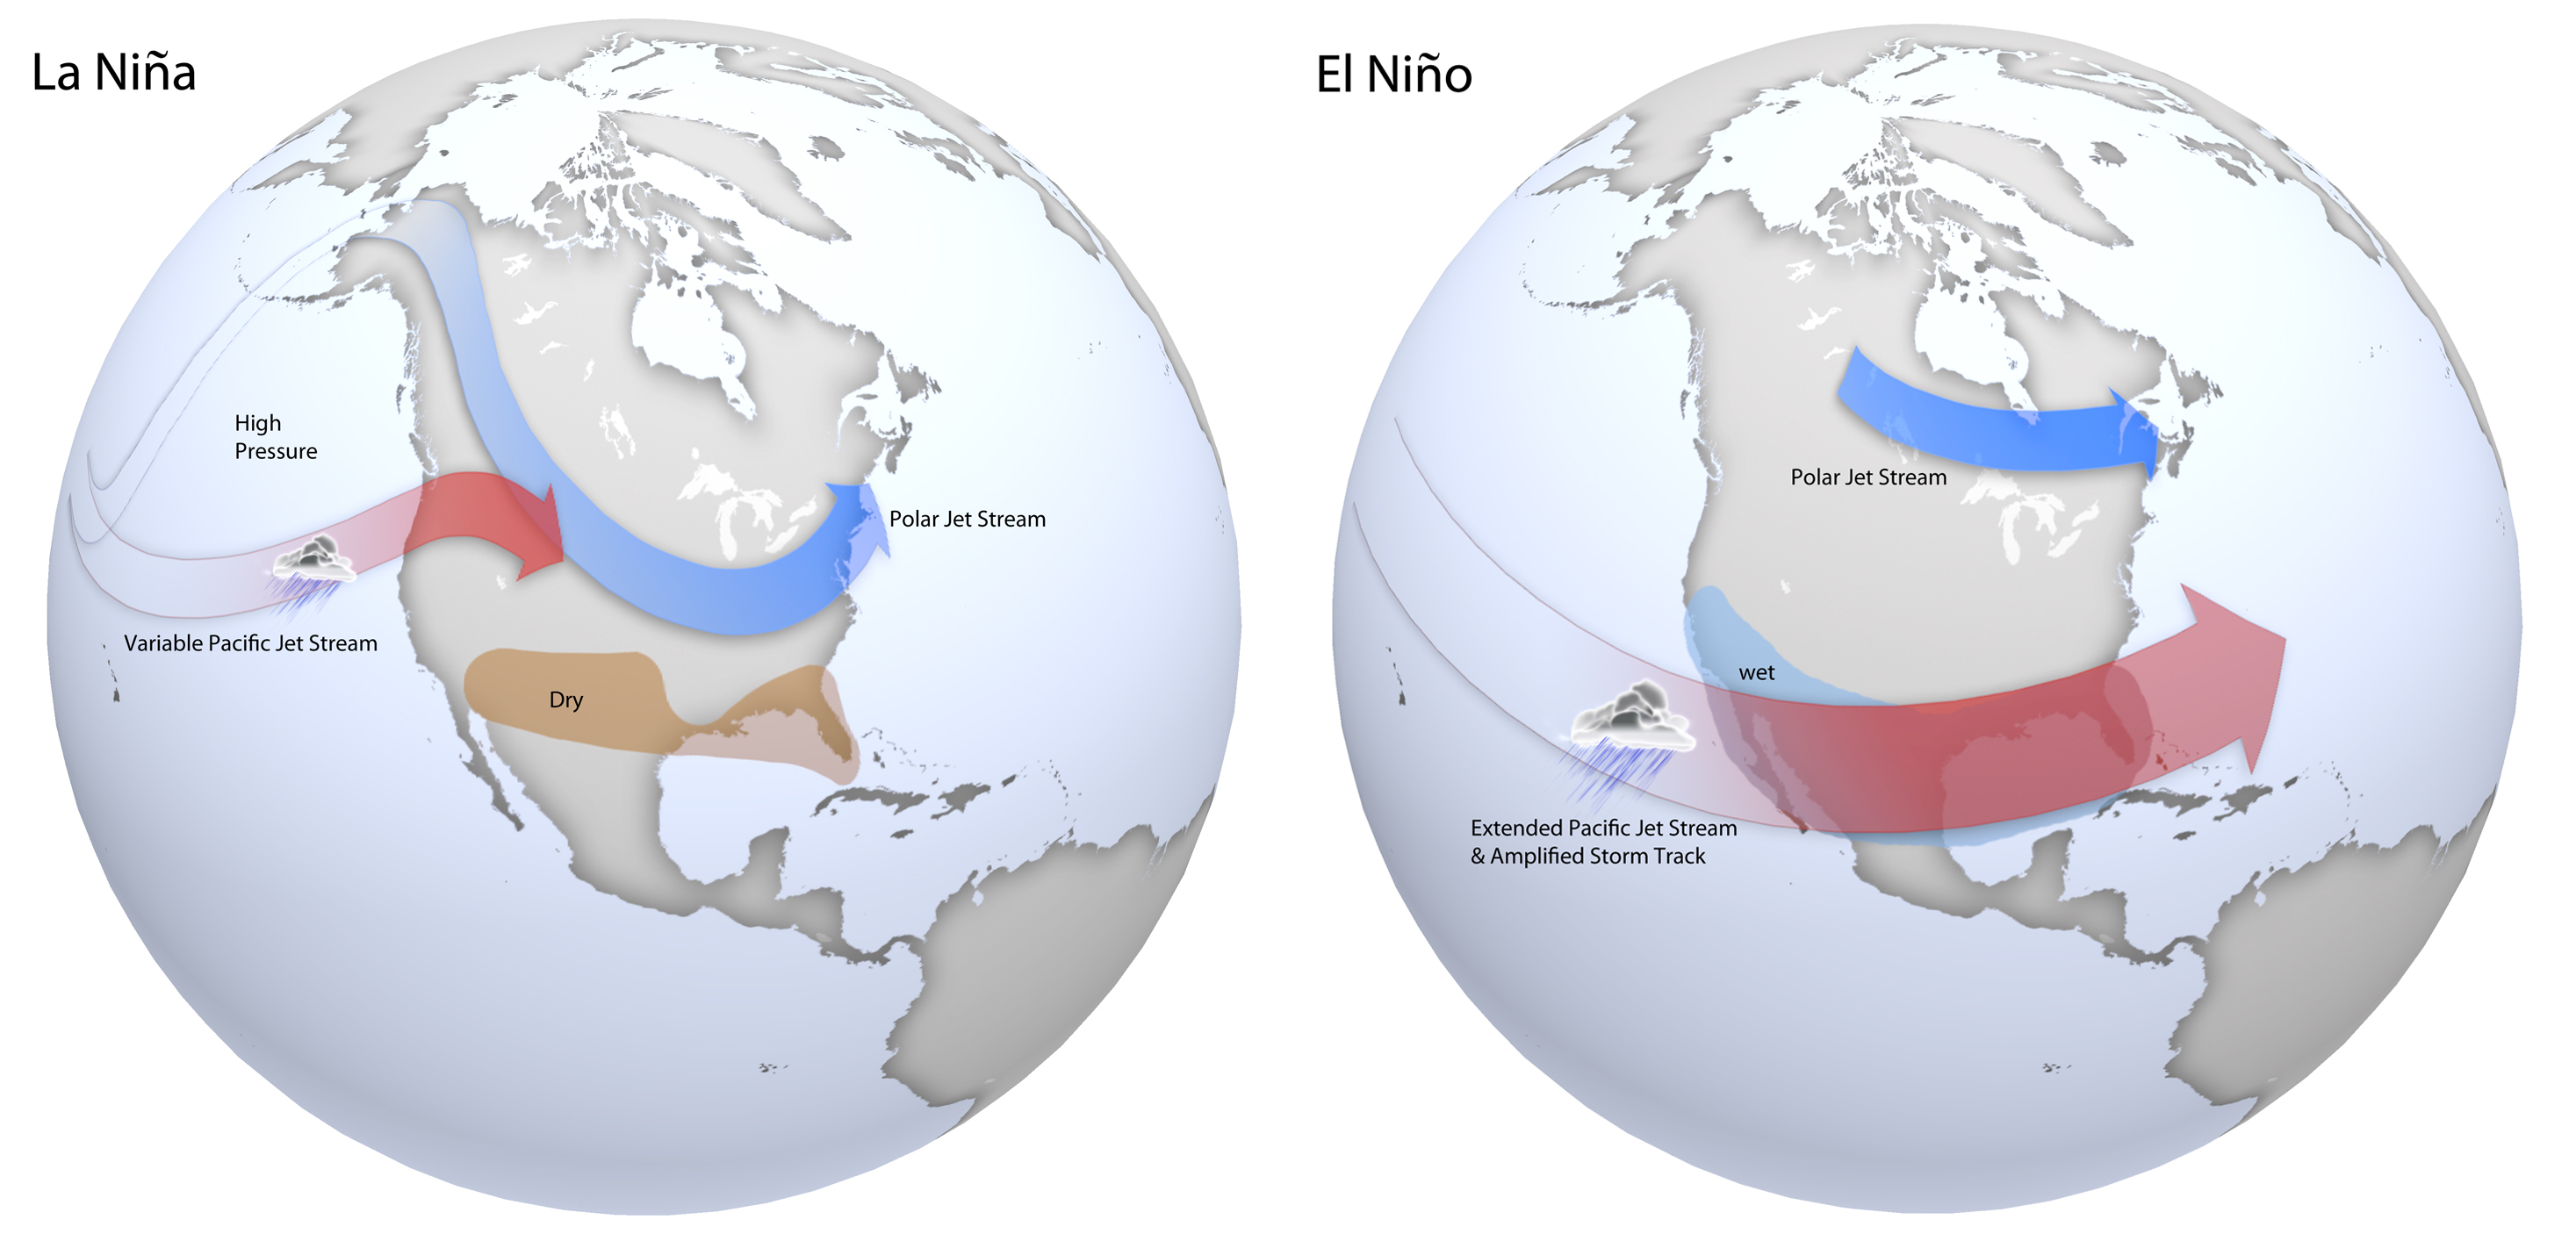 |
| Typical late fall through early spring upper level jet stream positions associated with moderate to strong La Niña (left) and El Niño (right) events. During La Niña, a variable Pacific jet stream in association with a polar jet stream shifted further south favors below normal precipitation across the southern US, with below normal temperatures across the northern US. During El Niño, a strong and amplified Pacific jet stream extending across the southern US in association with a polar jet stream shifted further north into Canada favors above normal precipitation across the southern US, and above normal temperatures over the northern US. Based on original graphics from NOAA’s Climate Prediction Center. |
Official Long-Range Forecasts
The below long-range outlooks are courtesy of the Climate Prediction Center (CPC). They indicate probabilities of above, near or below normal temperature/precipitation for the given time period. They do NOT represent the expected magnitude of warm/cool and/or wet/dry weather. Professionals at CPC take into account many different factors when assembling these forecasts, including the ENSO composites posted throughout this report. Click images to enlarge.
One-Month Forecast
 |
 |
| Above/Below Normal Temperature Probabilities | Above/Below Normal Precipitation Probabilities |
| Issued on the third Thursday of the month and then updated on the last day of the month | |
Three-Month Forecast
 |
 |
| Above/Below Normal Temperature Probabilities | Above/Below Normal Precipitation Probabilities |
| Issued on the third Thursday of the month | |
Risk of Extremes with El Niño & La Niña episodes
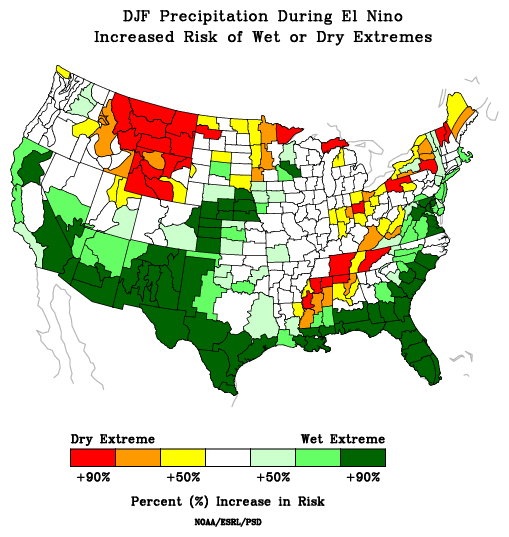
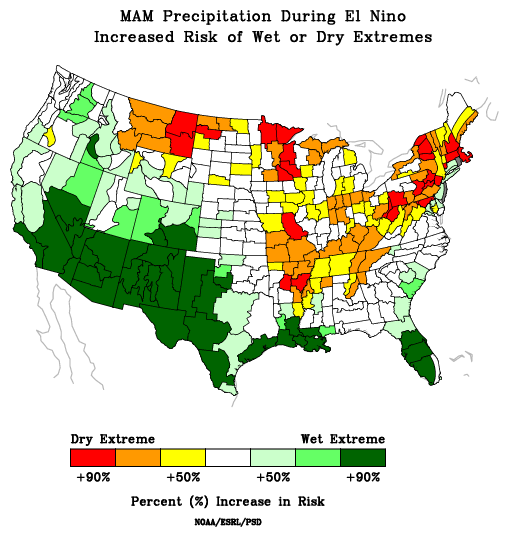
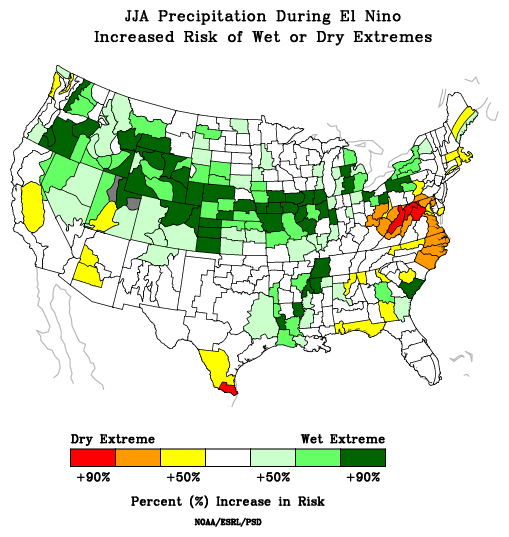
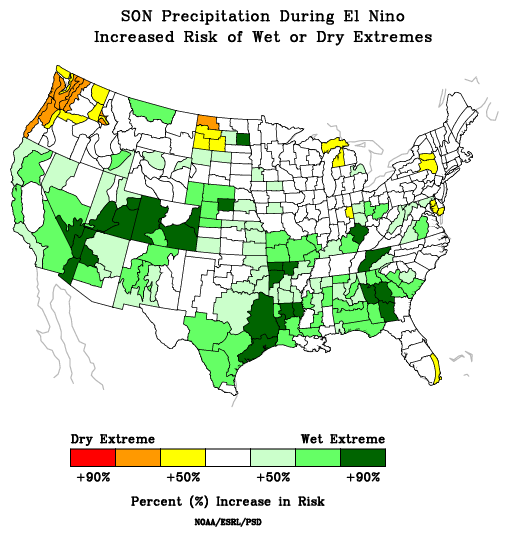
The images below depict the odds of extreme wet/dry and warm/cold seasonal three-month periods associated with historical El Niño and La Niña episodes since 1950. Extreme weather is defined as being in the highest or lowest 20% of the 100 year record. The climatological average risk of extreme weather any given season is 20%. These composites are not intended to be a forecast of expected conditions. Rather, they use historical data to highlight locations where ENSO can potentially impact temperature and precipitation.
El Niño: Risk of Precipitation Extremes
| Winter | Spring | Summer | Fall |
| December - February | March - May | June- August | September - November |
 |
 |
 |
 |
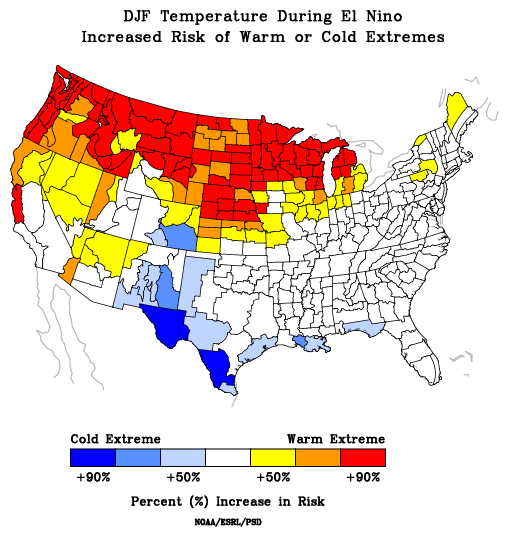
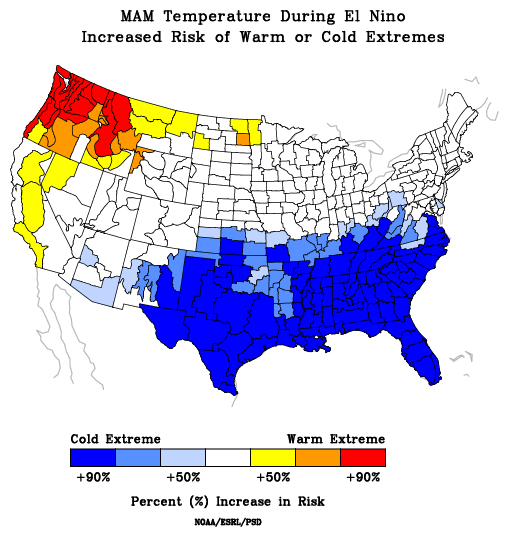
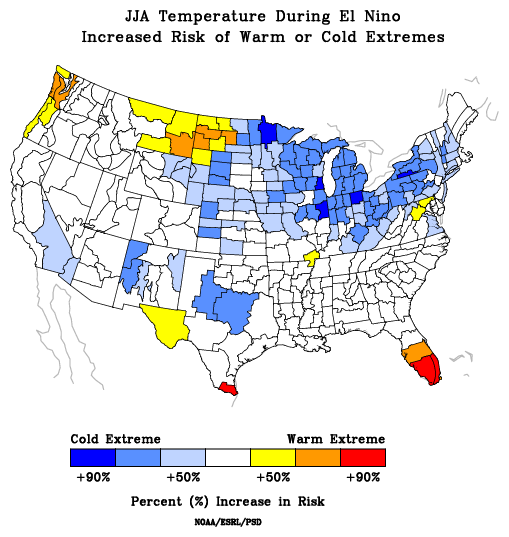
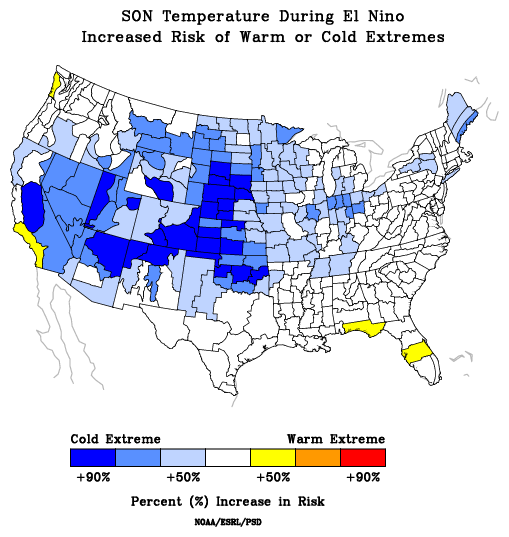
El Niño: Risk of Temperature Extremes
| Winter | Spring | Summer | Fall |
| December - February | March - May | June- August | September - November |
 |
 |
 |
 |
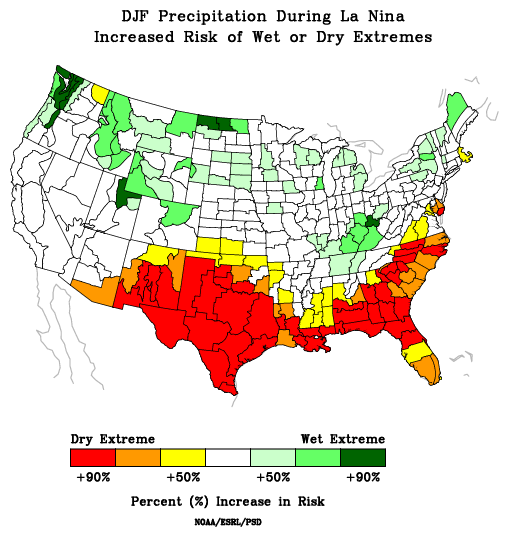
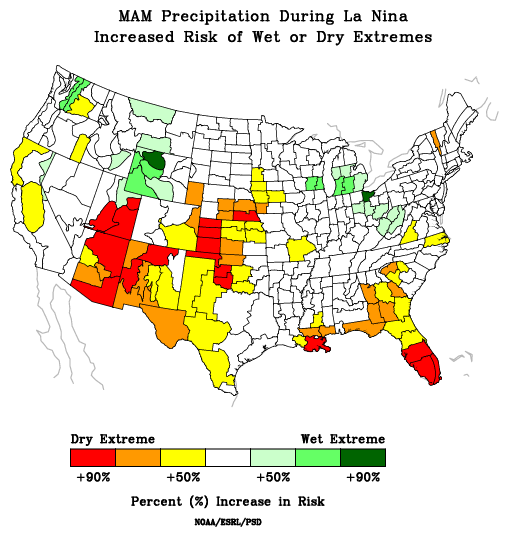
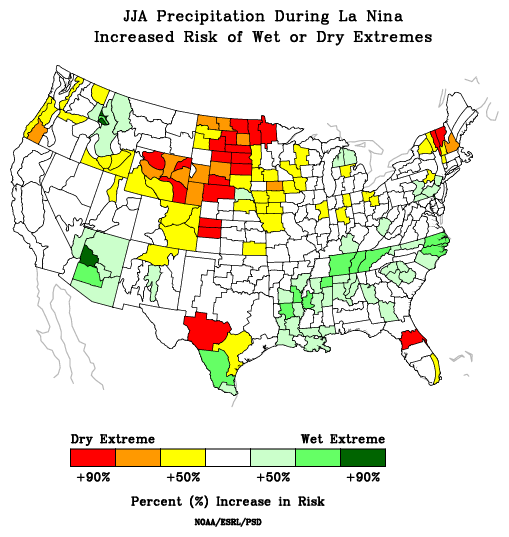
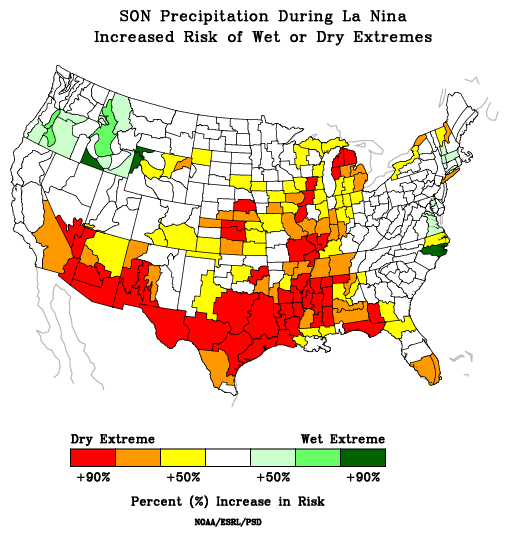
La Niña: Risk of Precipitation Extremes
| Winter | Spring | Summer | Fall |
| December - February | March - May | June- August | September - November |
 |
 |
 |
 |
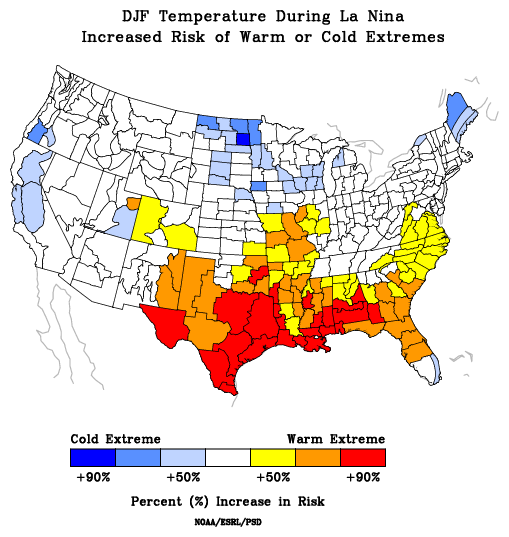
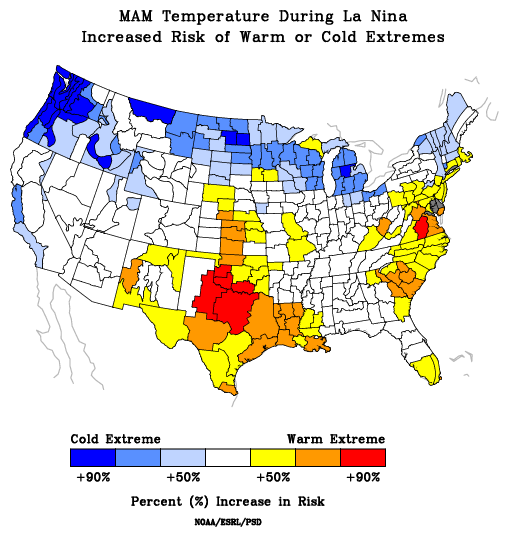
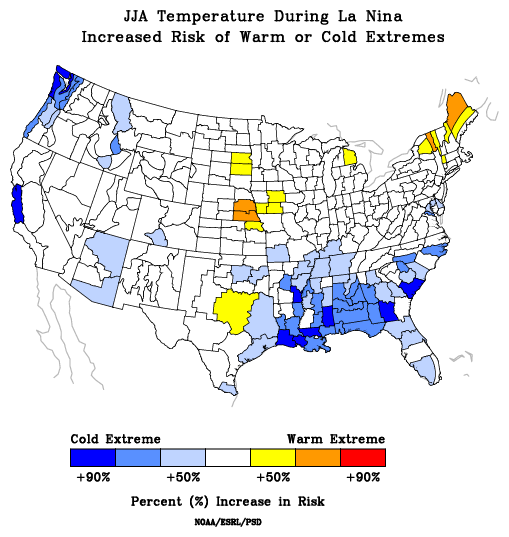
La Niña: Risk of Temperature Extremes
| Winter | Spring | Summer | Fall |
| December - February | March - May | June- August | September - November |
 |
 |
 |
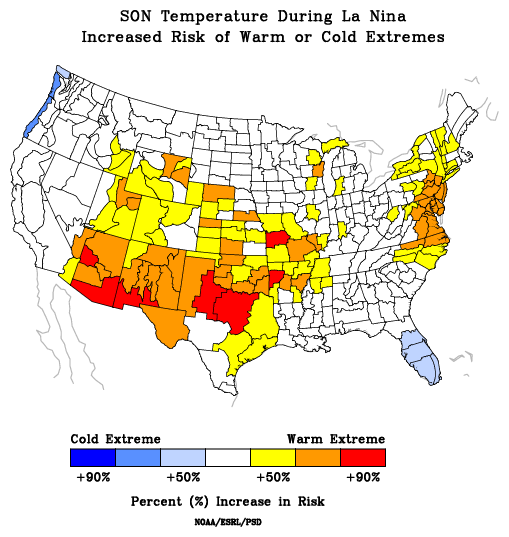 |
The above images depict chances of extreme wet or dry and extreme warm and cold seasonal three-month periods associated with past El Niño's and La Niña's since 1950. Warm colors indicate an increased risk of dry precipitation and warm temperature extremes, while green and blue colors indicate an increased risk of wet precipitation and cold temperature extremes. Click each image to enlarge. Images courtesy of NOAA's Earth System Research Laboratory.
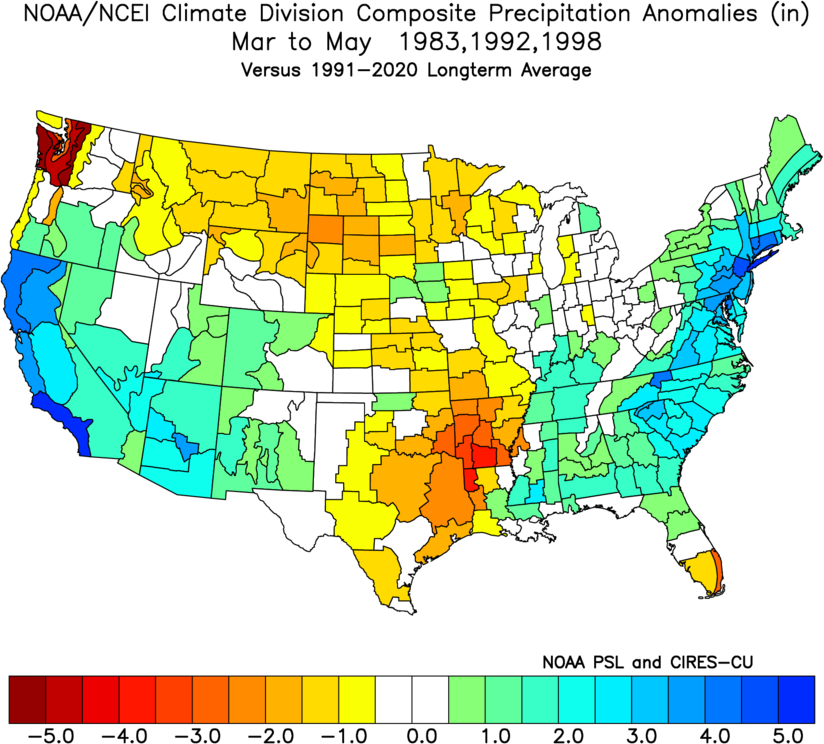
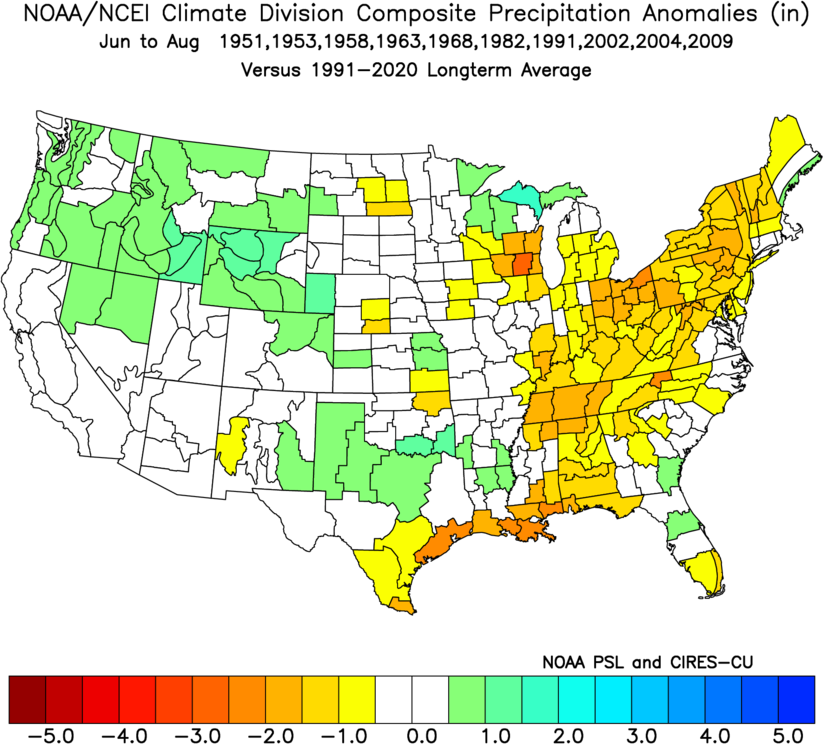
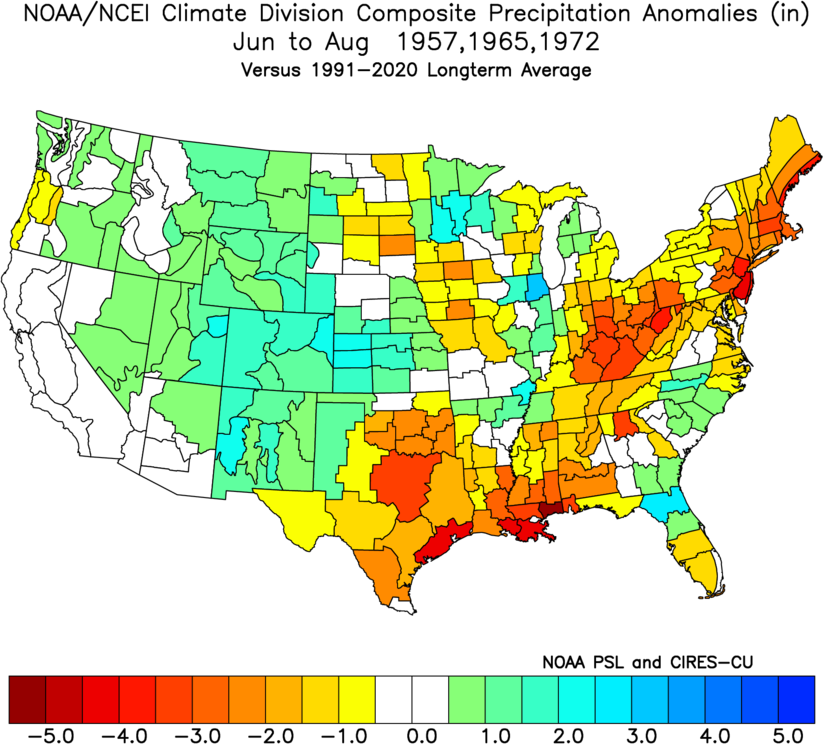
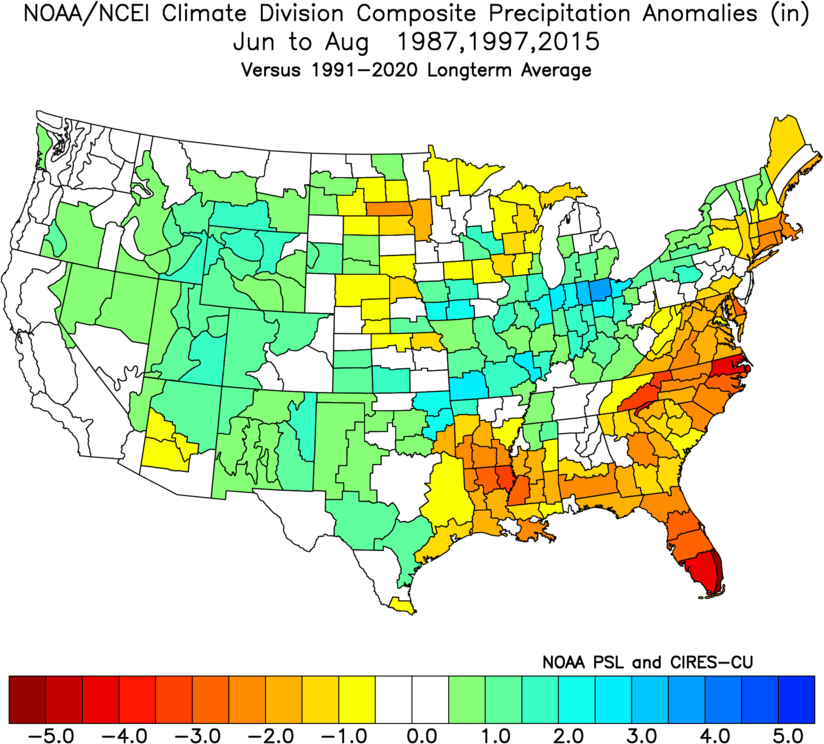
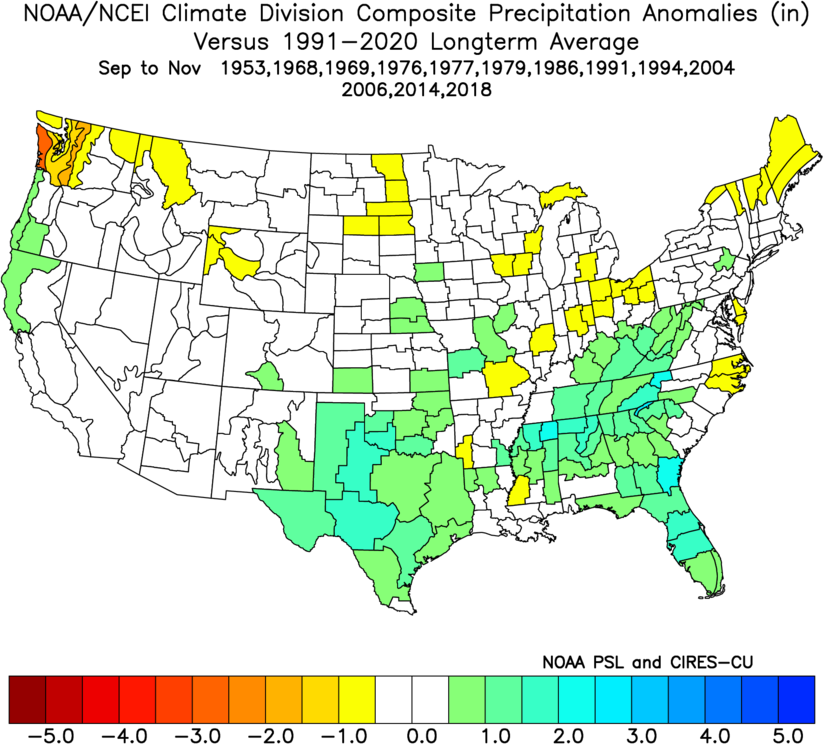
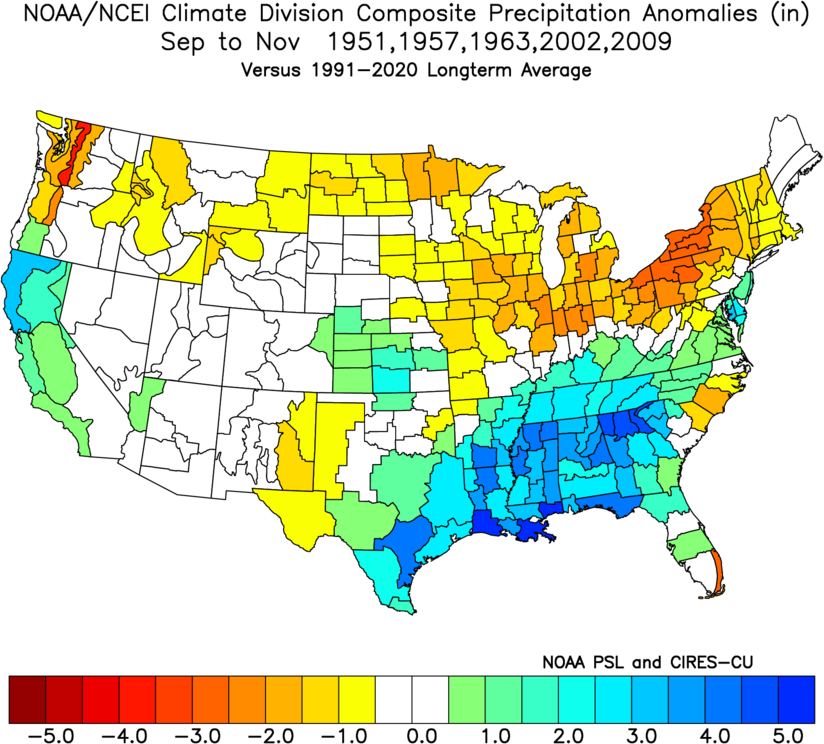
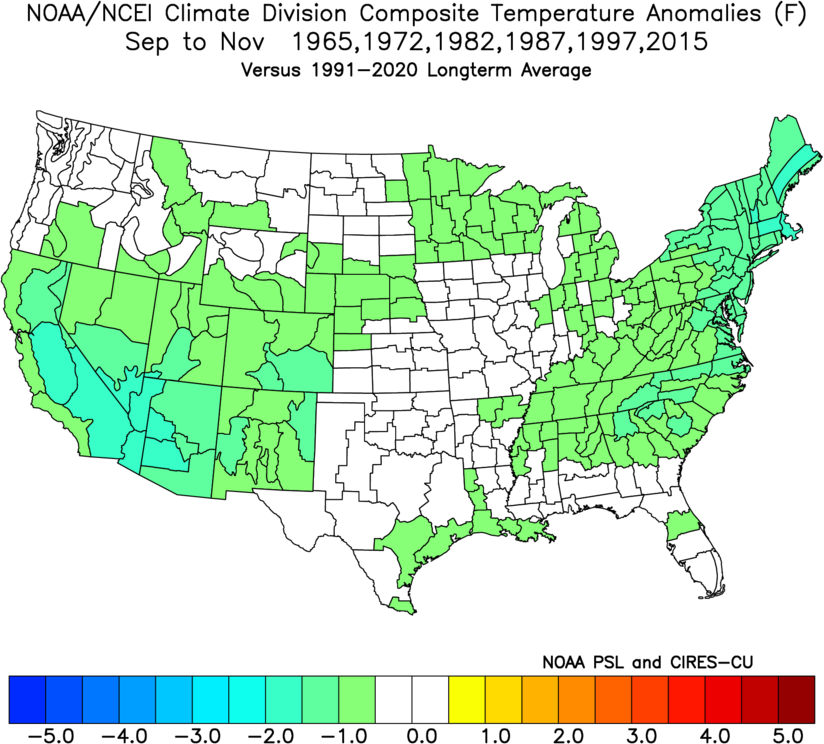
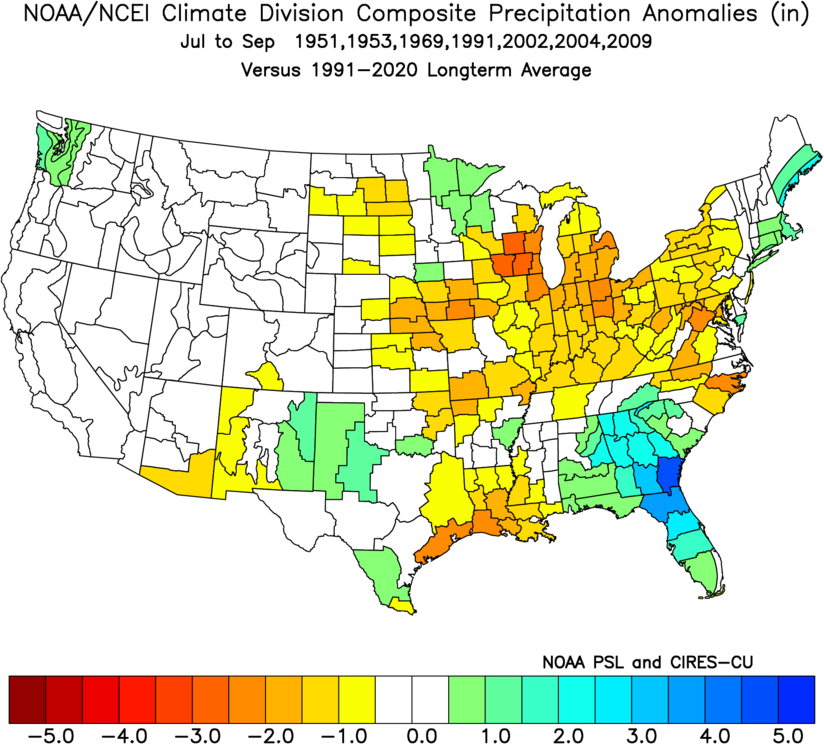
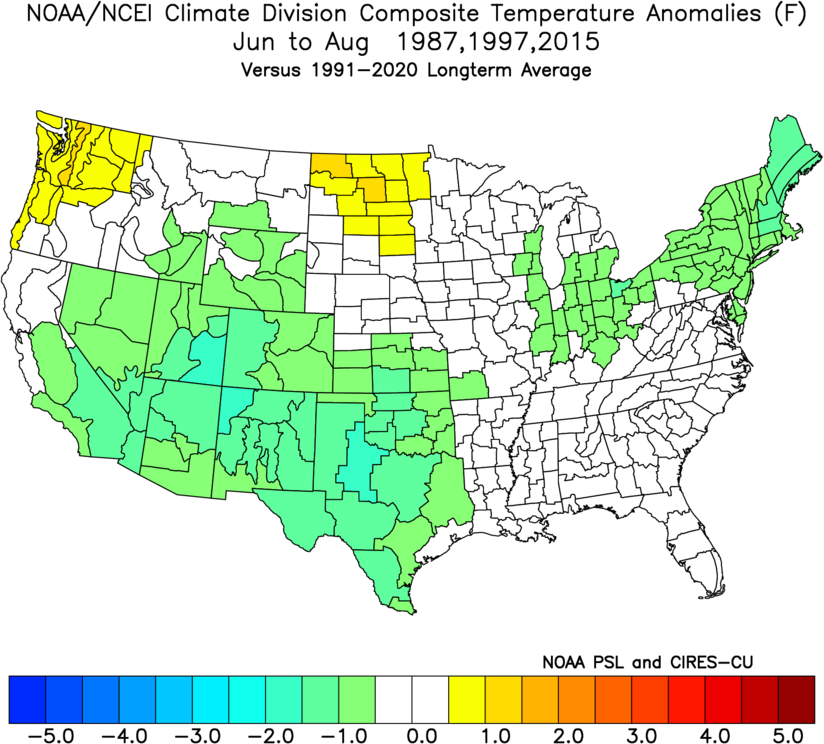
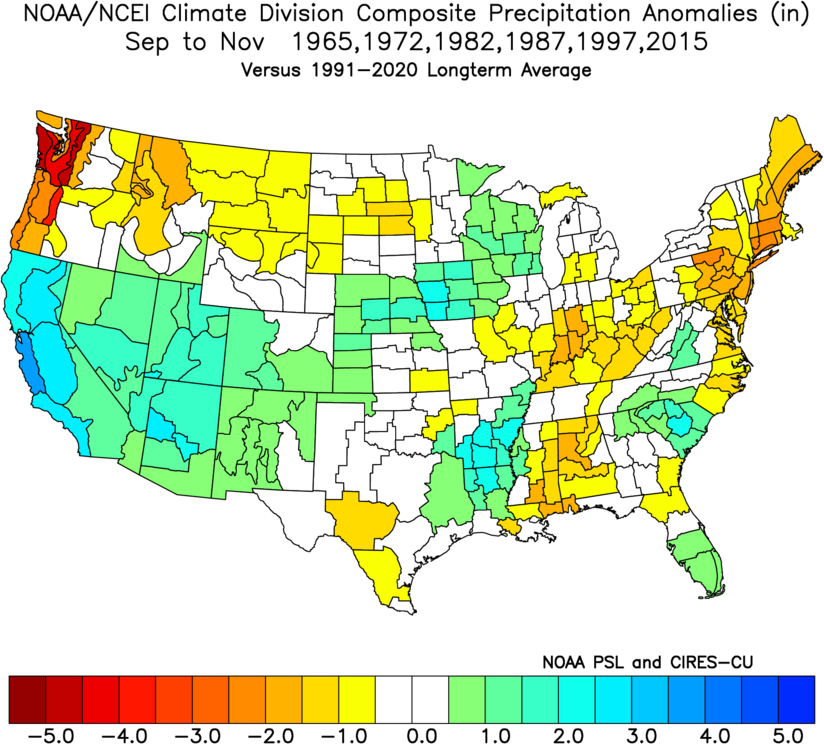
El Niño Precipitation & Temperature Anomalies
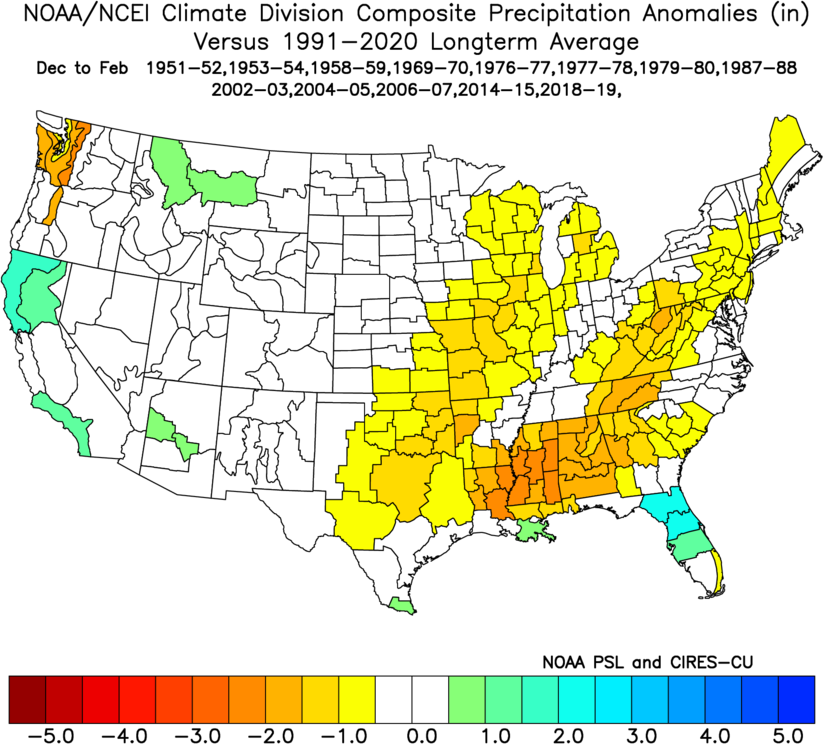
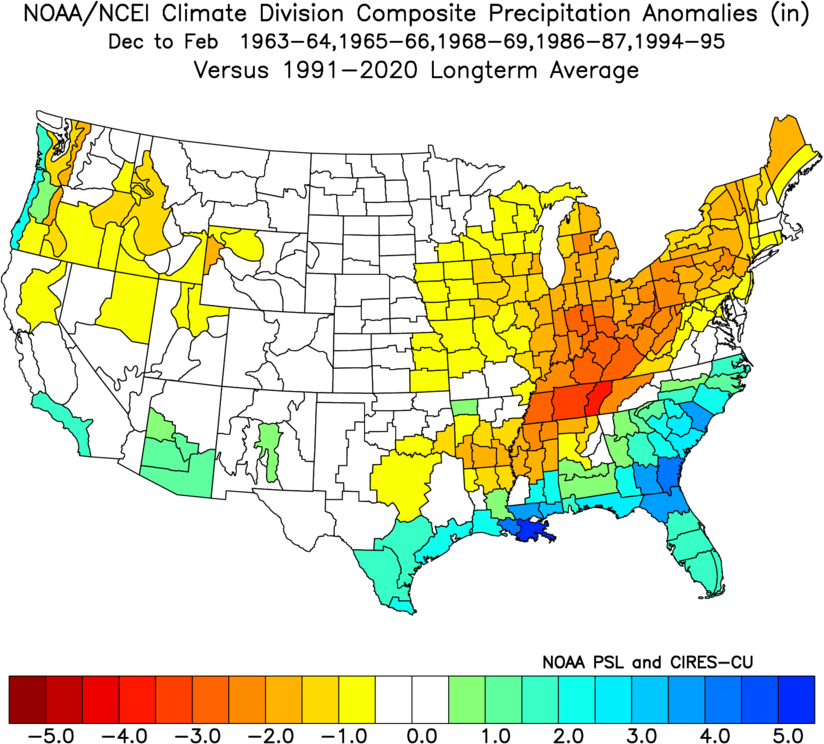
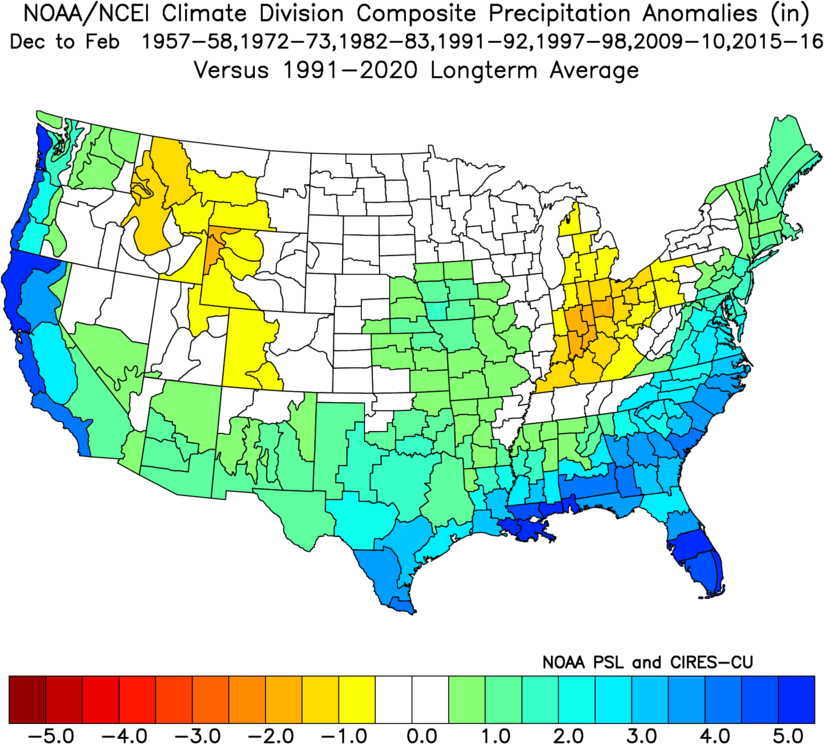
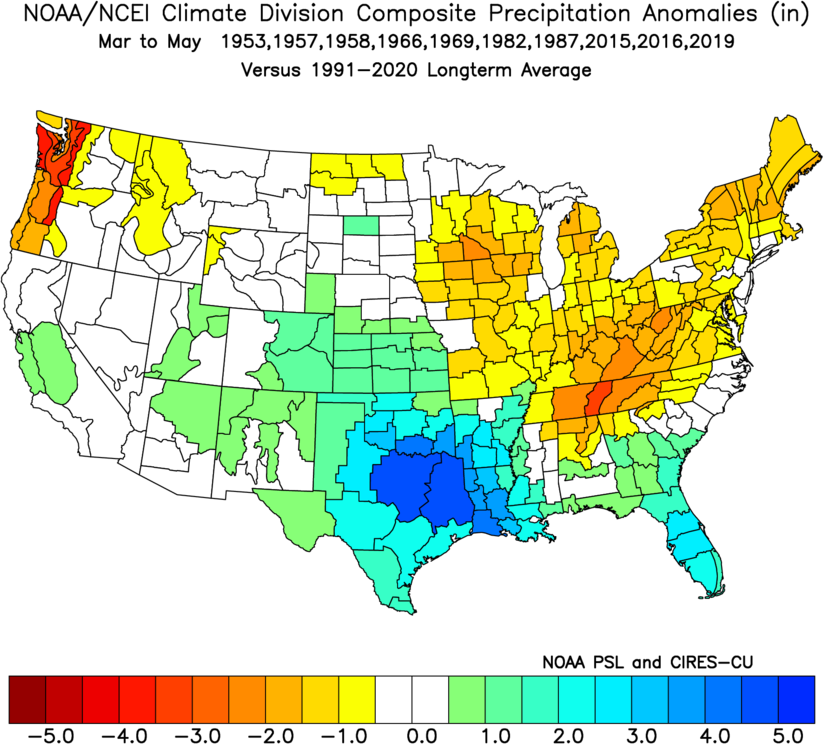
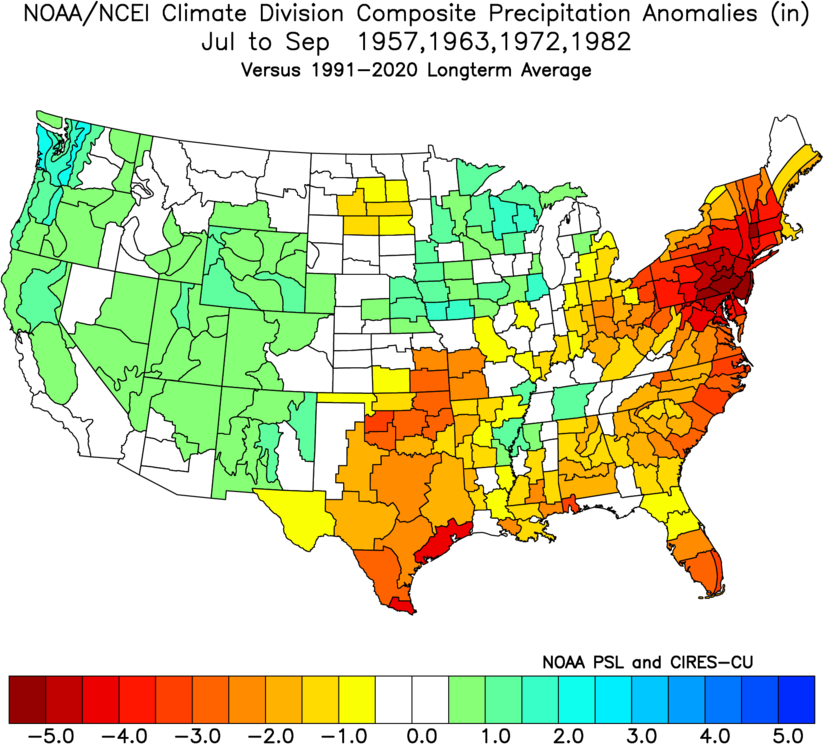
Below are the 3-month seasonal precipitation and temperature anomalies for weak, moderate and strong El Niño episodes since 1950. The anomalies are based on the official 1991-2020 normal. These composites are not intended to be a forecast of expected conditions. Rather, they use historical data to highlight locations where ENSO can potentially impact precipitation and temperature. Other climate and weather processes along with atmospheric variability may make the impacts of one ENSO event different than another. Some events may be associated with very extreme climate conditions which may dominate the composites. Click each image to enlarge.
El Niño Precipitation Anomalies
|
Seasons |
Weak Episodes |
Moderate Episodes |
Strong Episodes |
|
Winter December through February |
 |
 |
 |
|
Spring March through May |
 |
 |
|
|
Summer June through August |
 |
 |
 |
|
Fall September through November |
 |
 |
 |
|
Monsoon July through September |
 |
 |
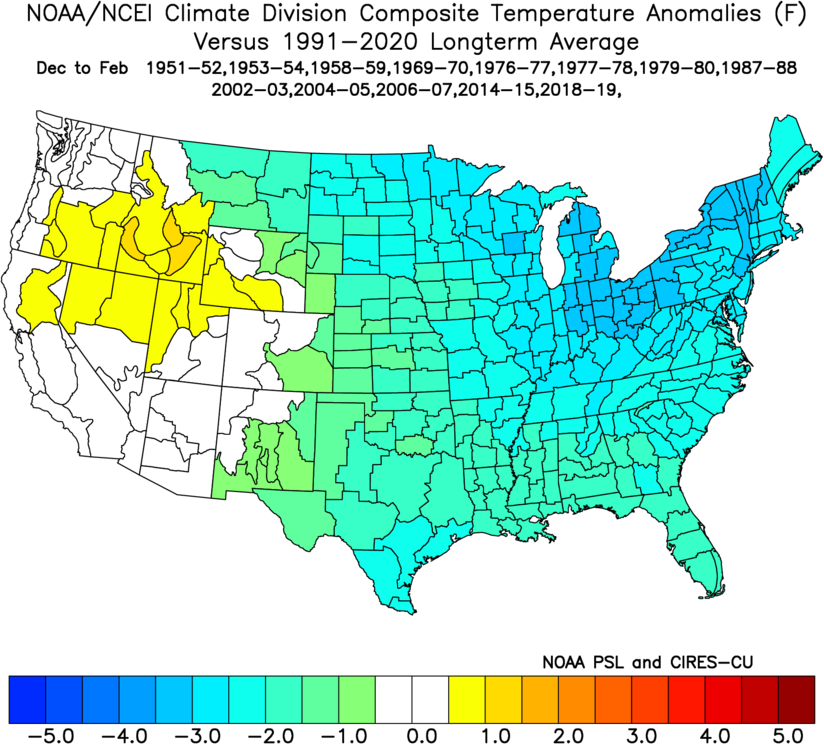
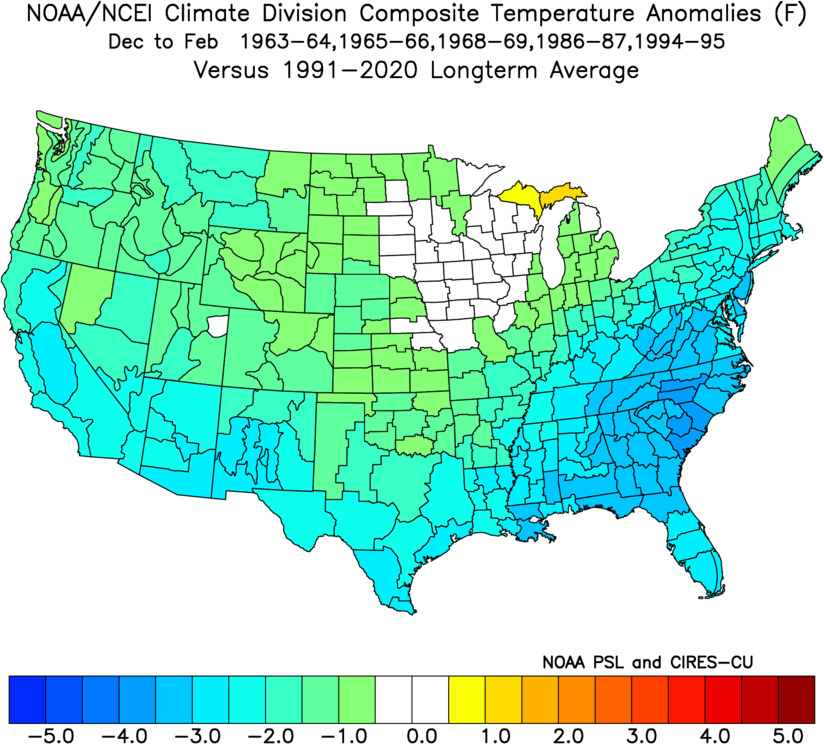
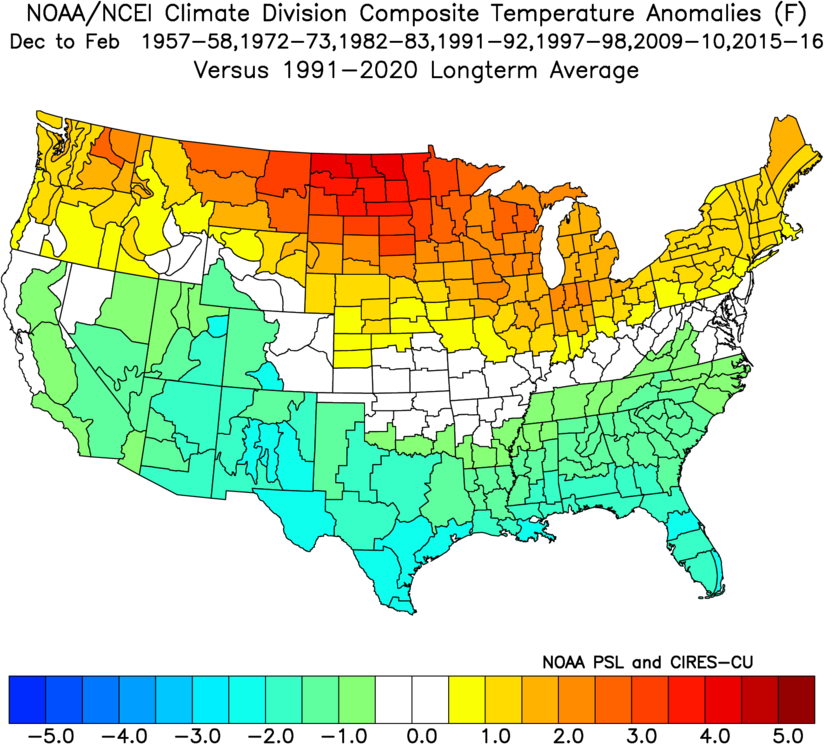
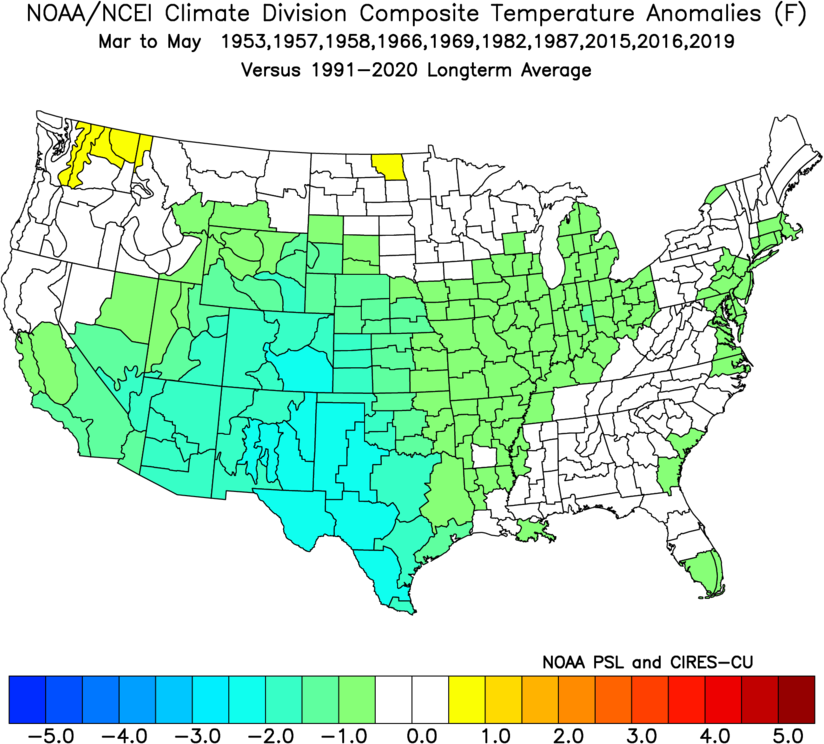
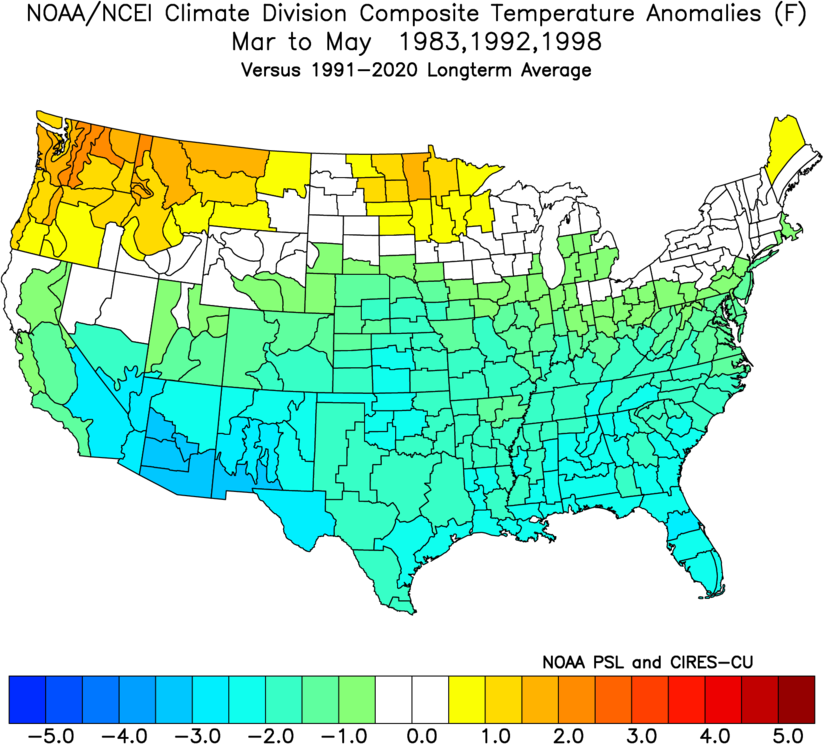
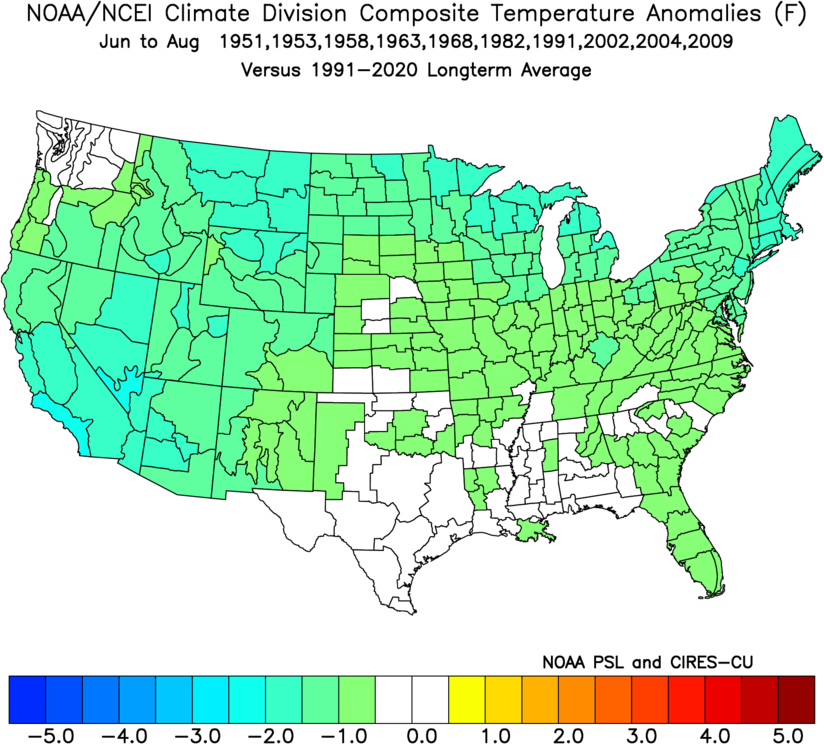
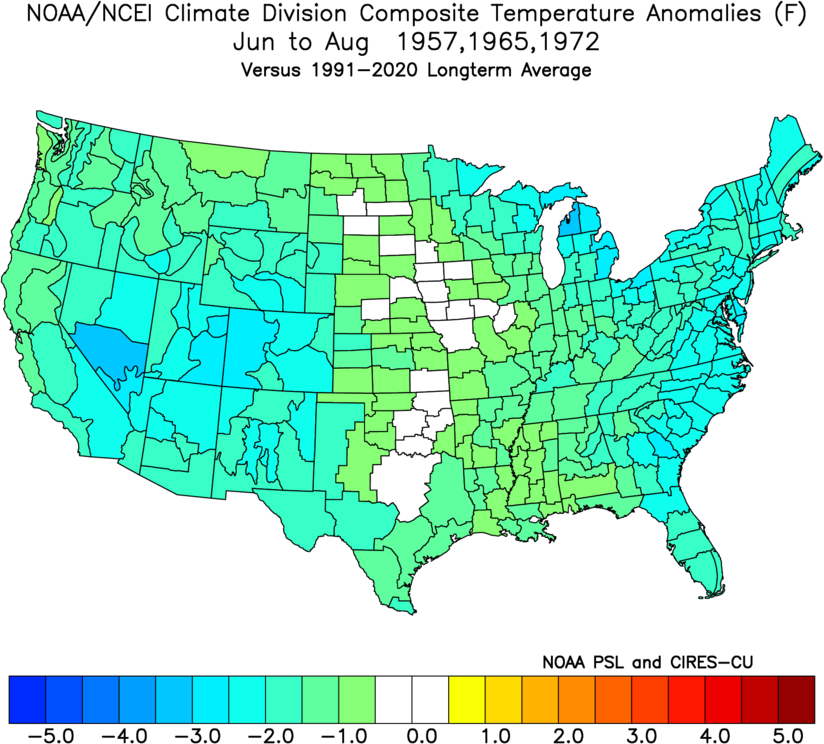
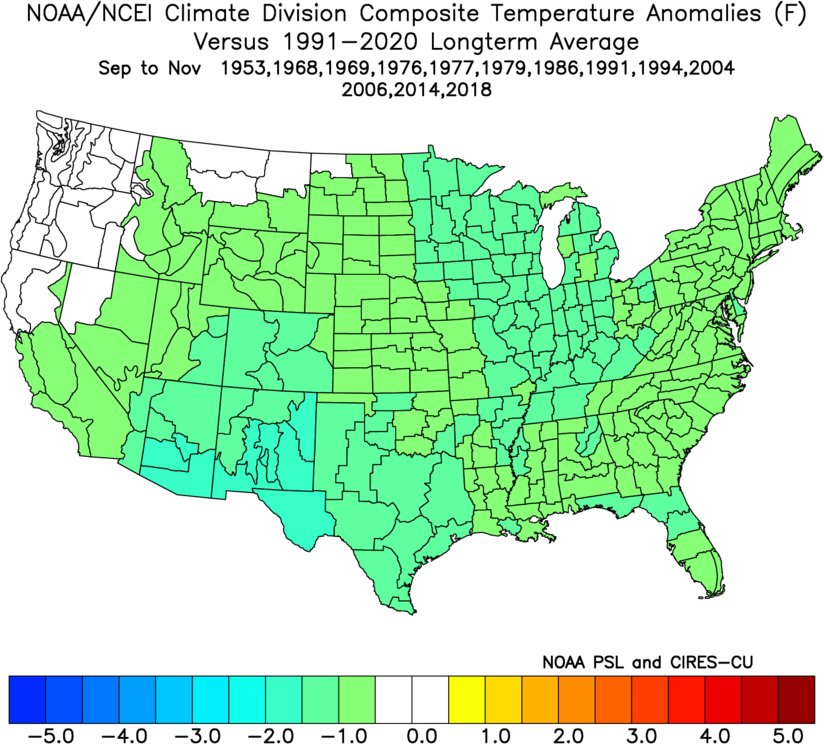
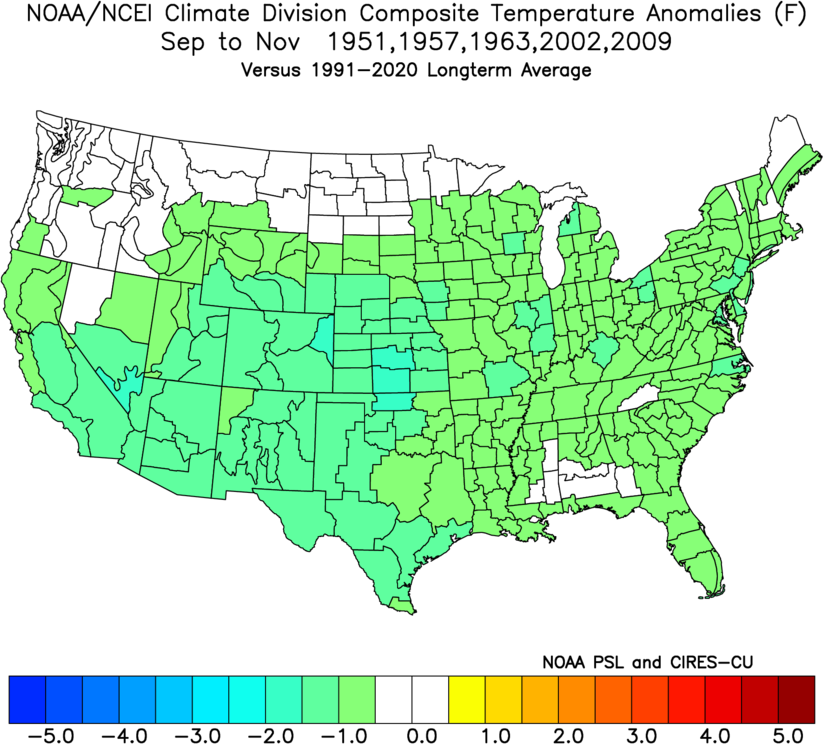
El Niño Temperature Anomalies
|
Seasons |
Weak Episodes |
Moderate Episodes |
Strong Episodes |
|
Winter December through February |
 |
 |
 |
|
Spring March through May |
 |
 |
|
|
Summer June through August |
 |
 |
 |
|
Fall September through November |
 |
 |
 |
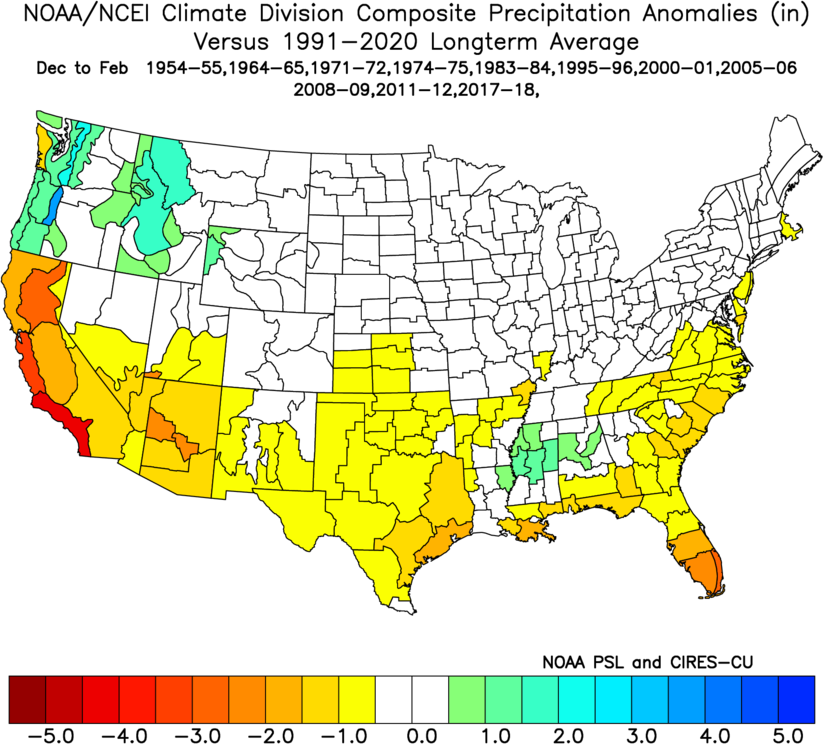
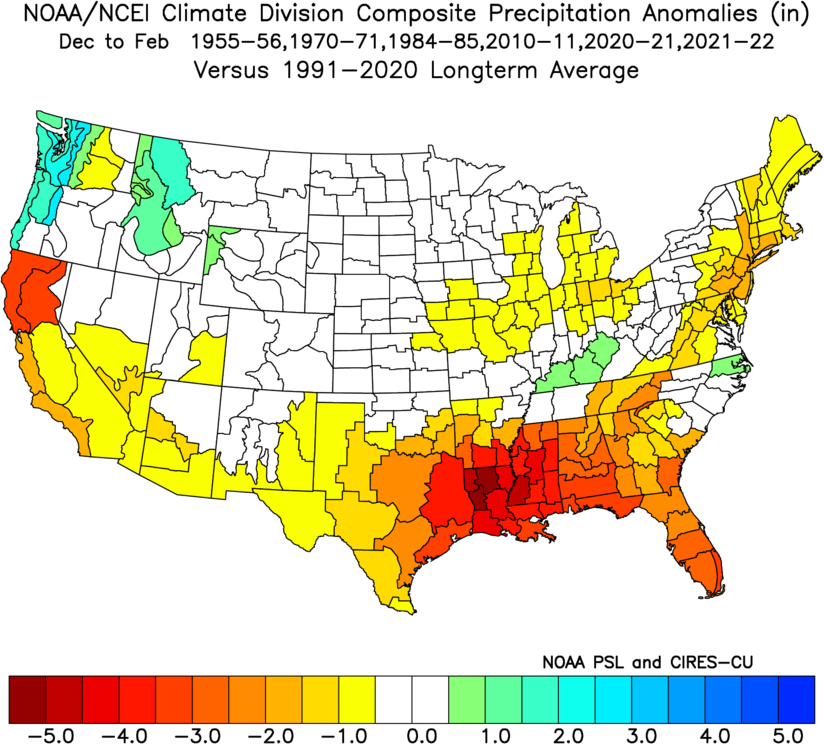
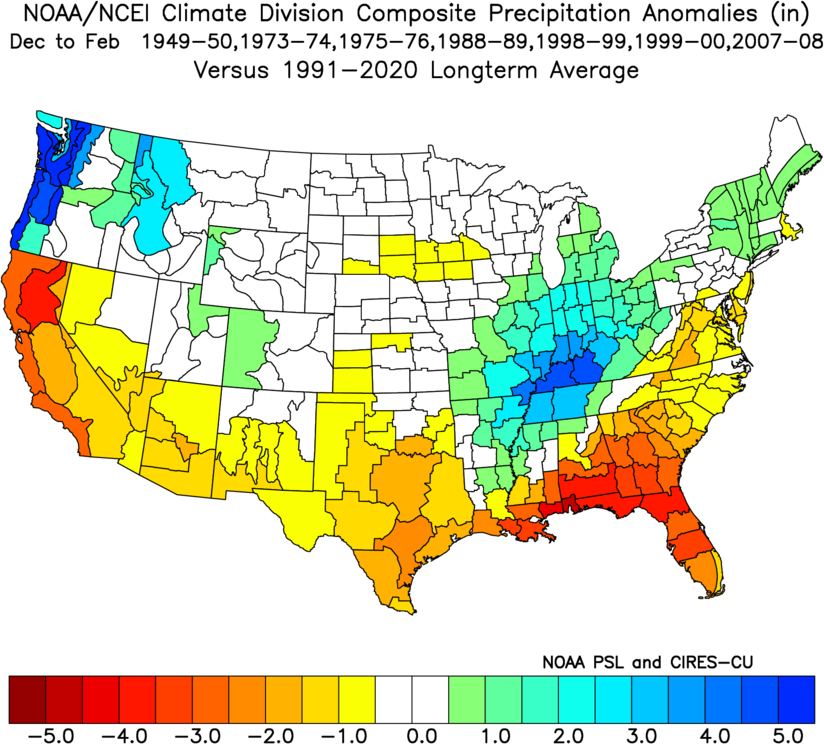
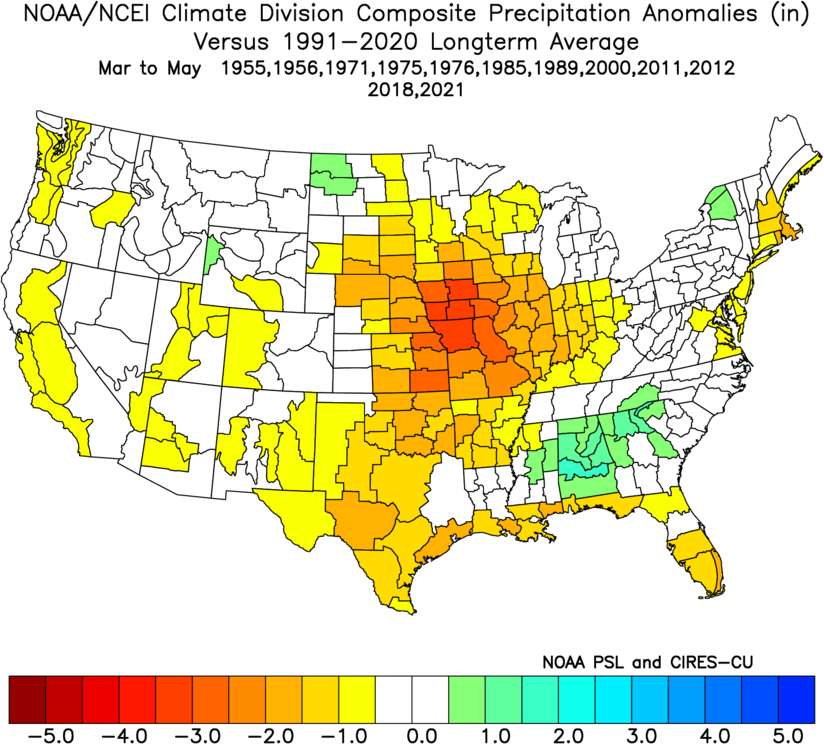
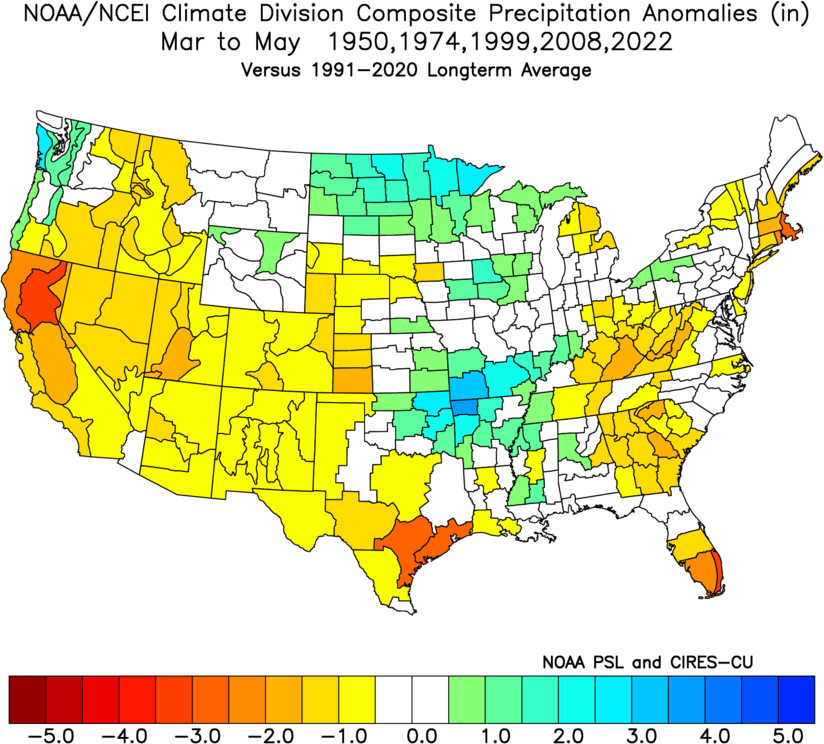
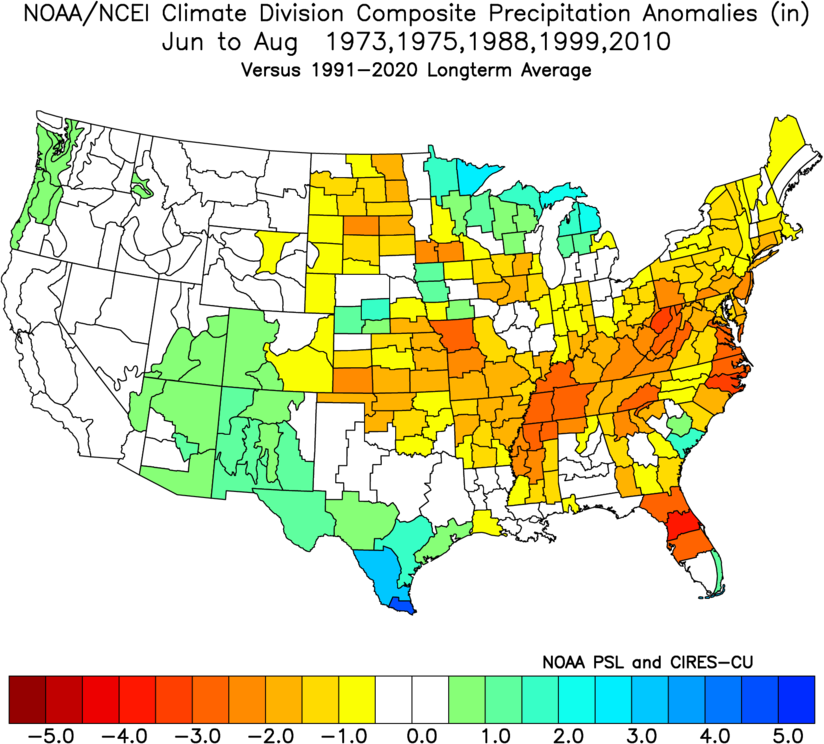
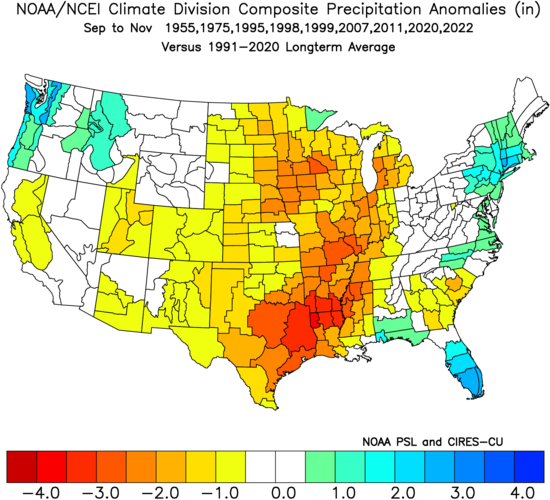
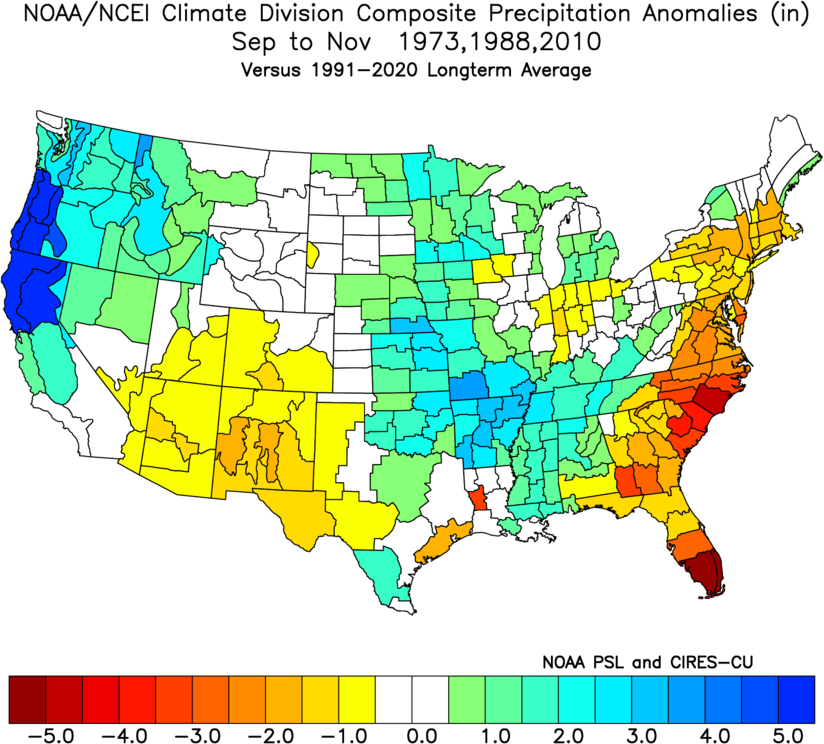
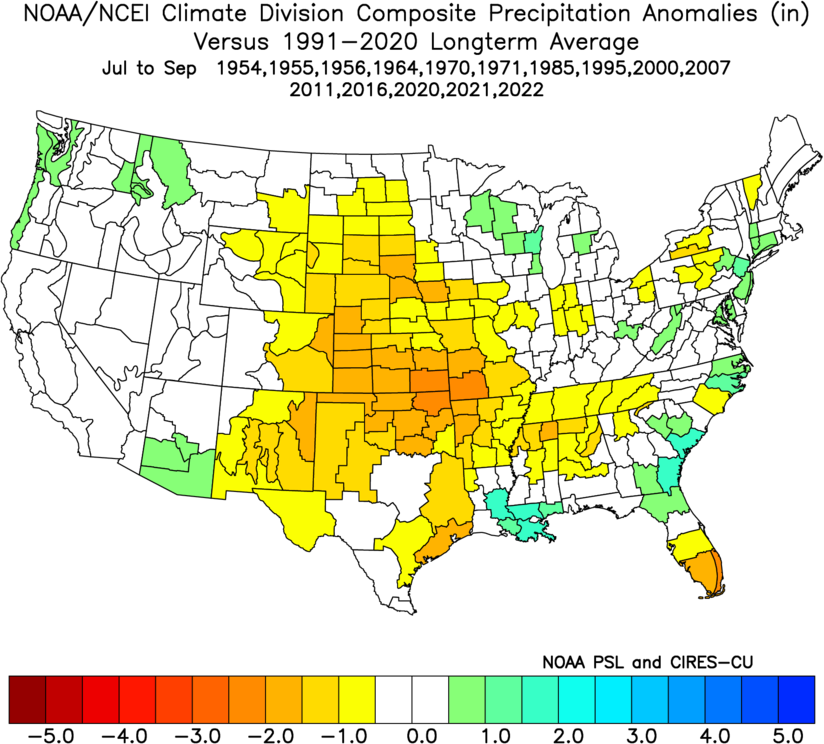
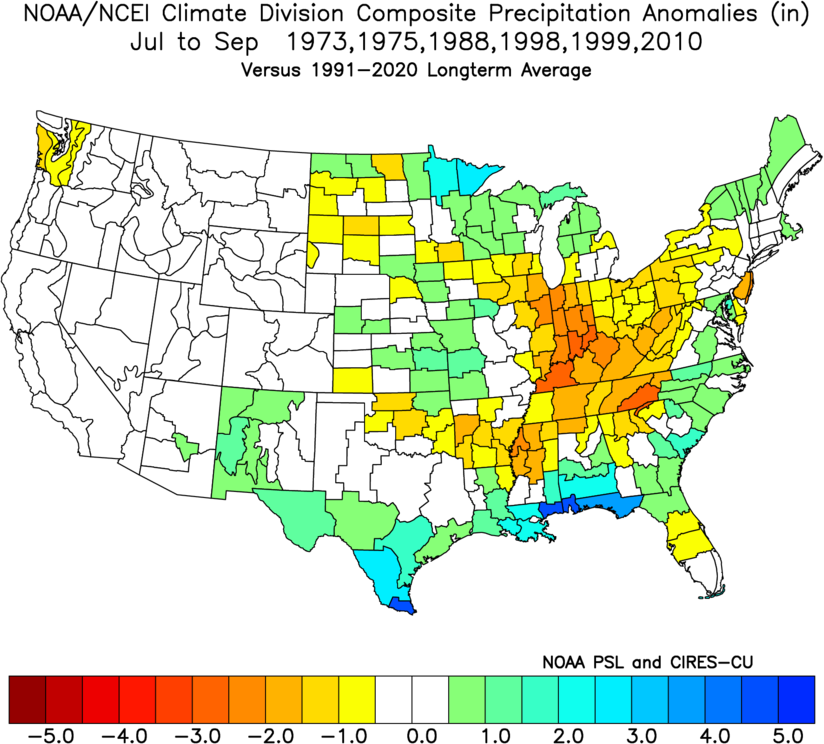
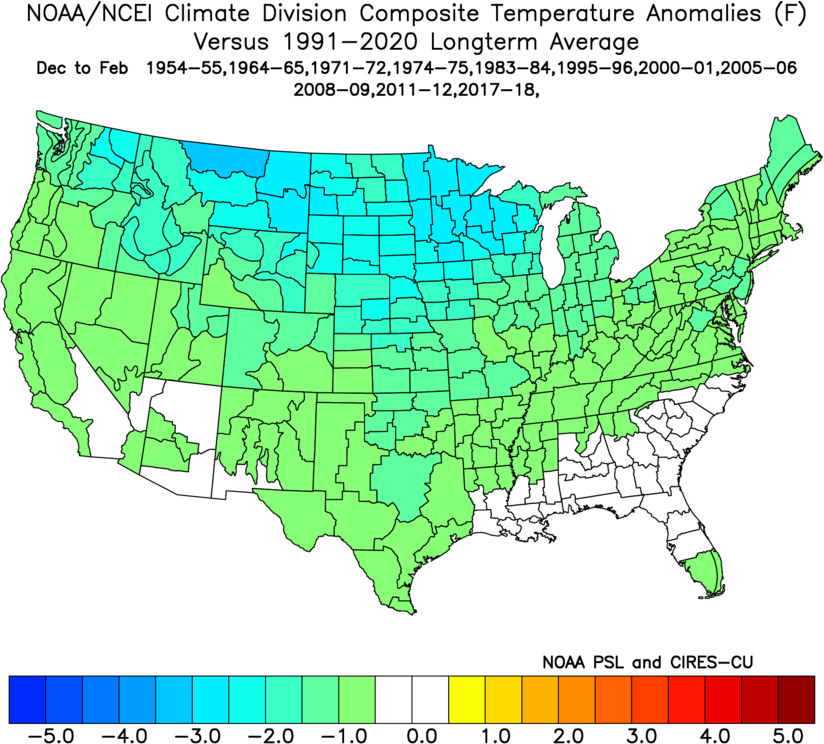
La Niña Precipitation & Temperature Anomalies
Below are the 3-month seasonal precipitation and temperature anomalies for weak, moderate and strong La Niña episodes since 1950. The anomalies are based on the official 1991-2020 normal. These composites are not intended to be a forecast of expected conditions. Rather, they use historical data to highlight locations where ENSO can potentially impact precipitation and temperature. Other climate and weather processes along with atmospheric variability may make the impacts of one ENSO event different than another. Some events may be associated with very extreme climate conditions which may dominate the composites. Click each image to enlarge.
La Niña Precipitation Anomalies
|
Seasons |
Weak Episodes |
Moderate Episodes |
Strong Episodes |
|
Winter December through February |
 |
 |
 |
|
Spring March through May |
 |
 |
|
|
Summer June through August |
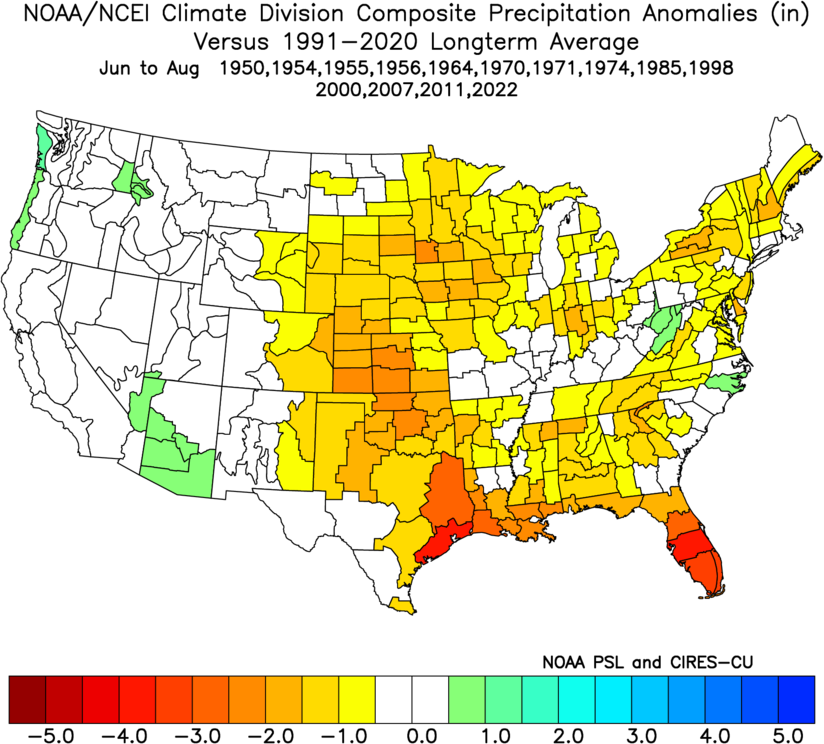 |
 |
|
|
Fall September through November |
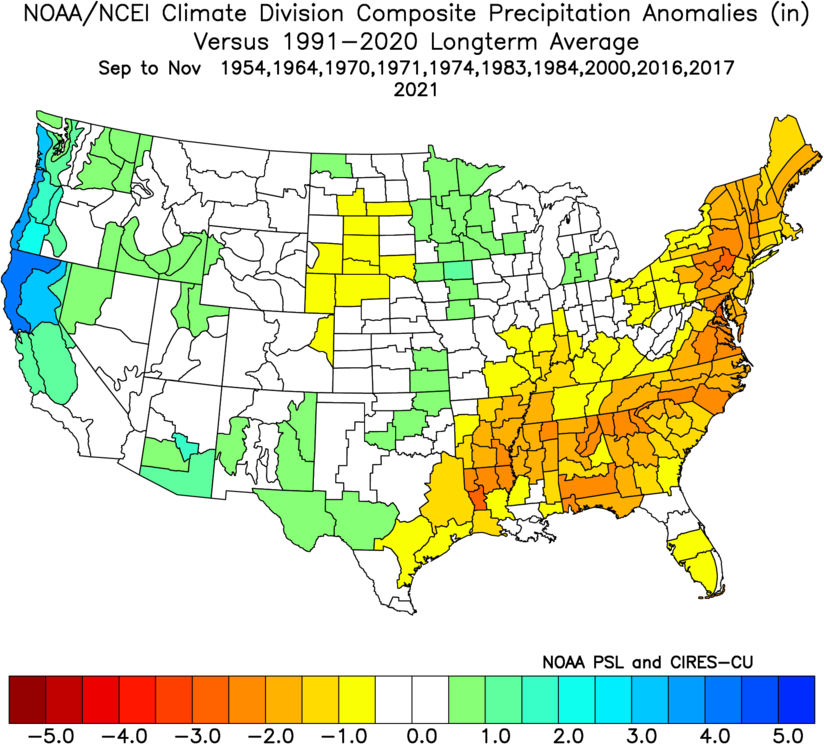 |
 |
 |
|
Monsoon July through September |
 |
 |
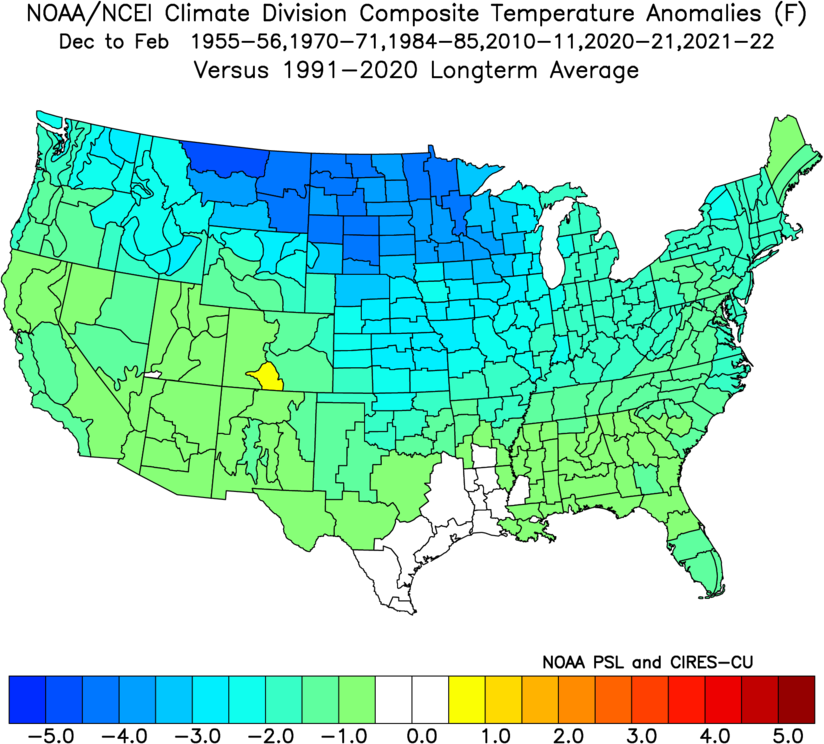
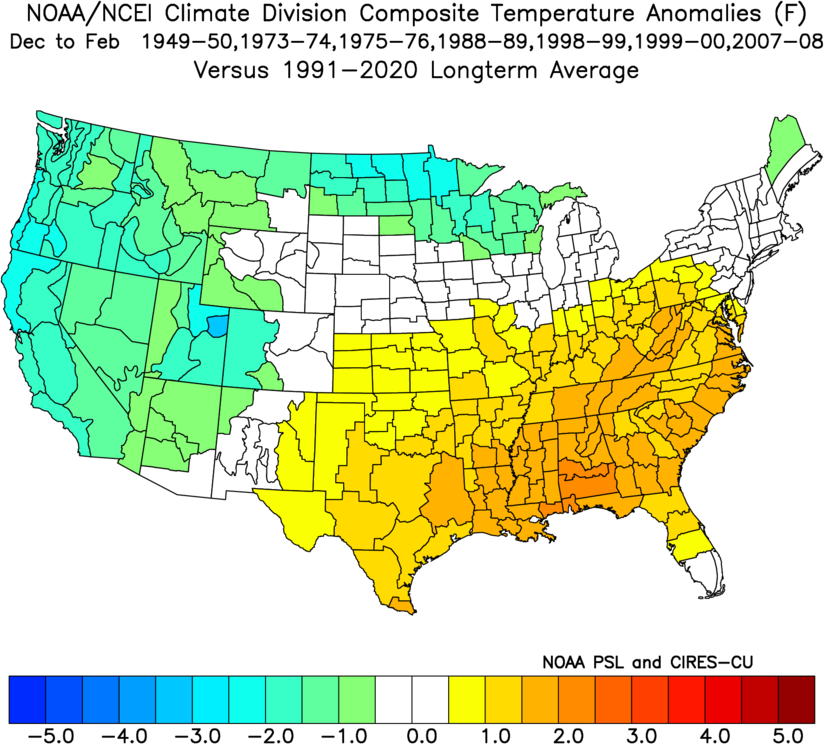
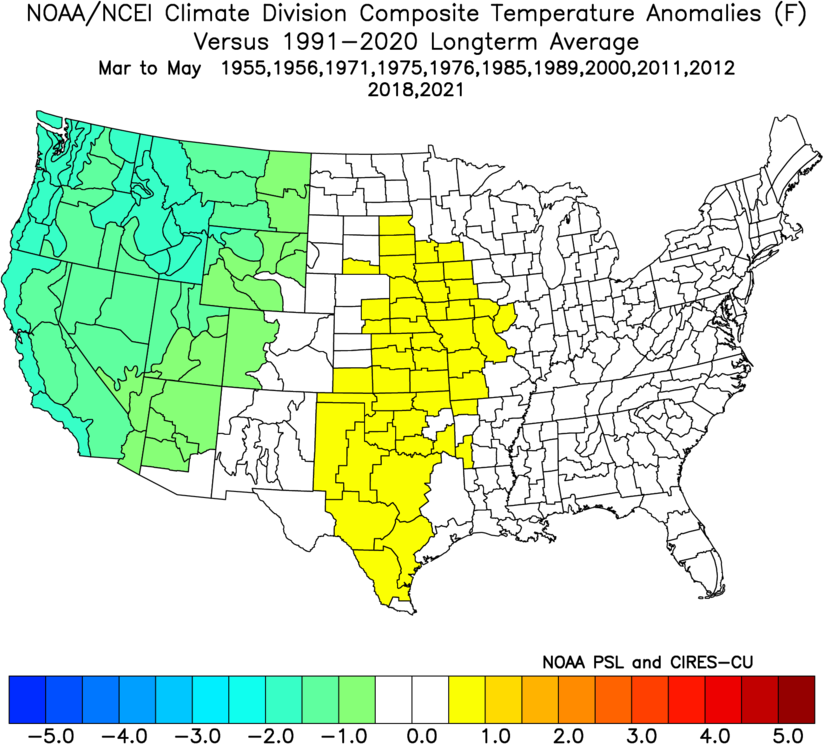
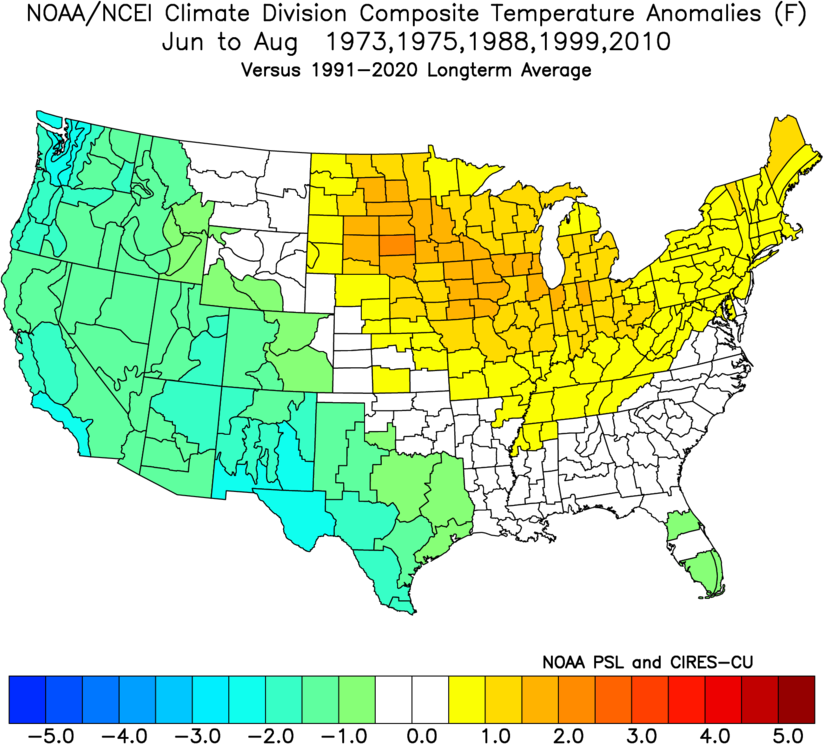
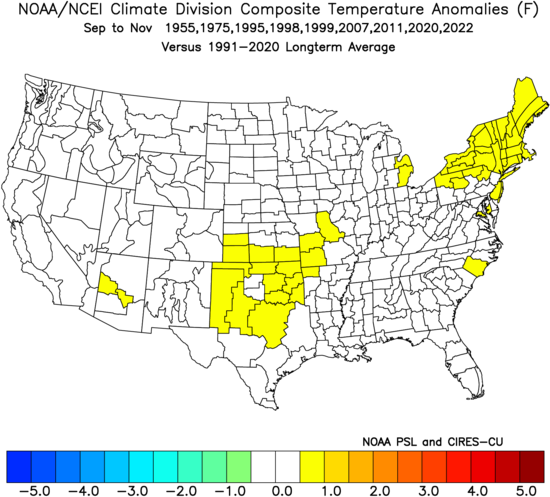
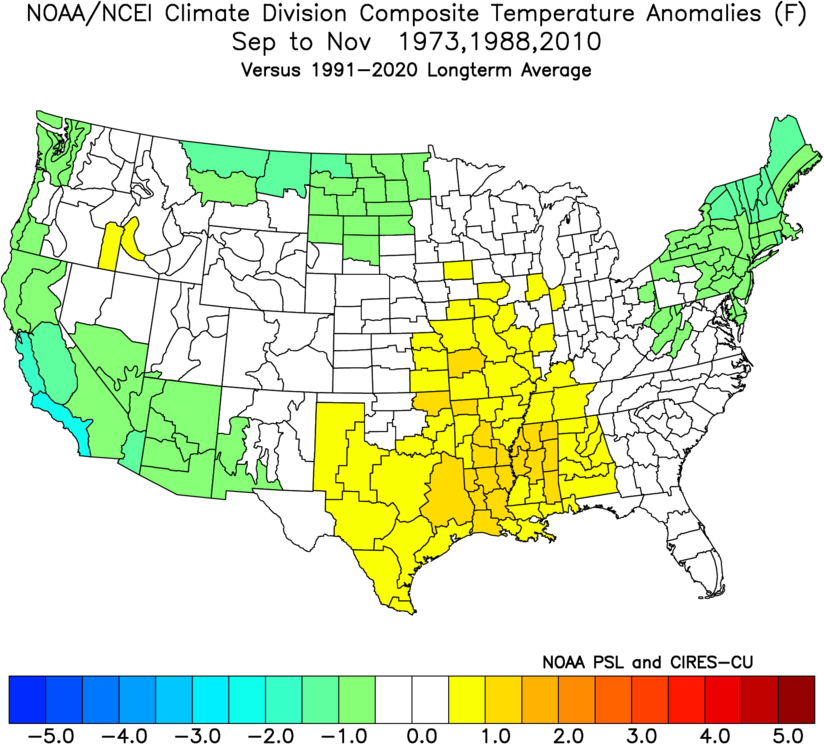
La Niña Temperature Anomalies
|
Seasons |
Weak Episodes |
Moderate Episodes |
Strong Episodes |
|
Winter December through February |
 |
 |
 |
|
Spring March through May |
 |
|
|
|
Summer June through August |
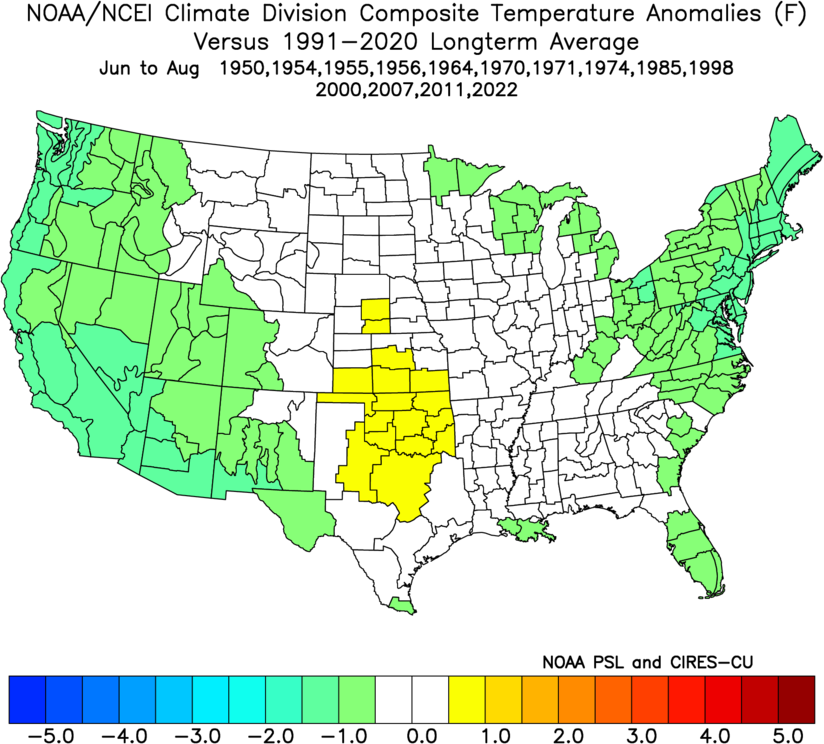 |
 |
|
|
Fall September through November |
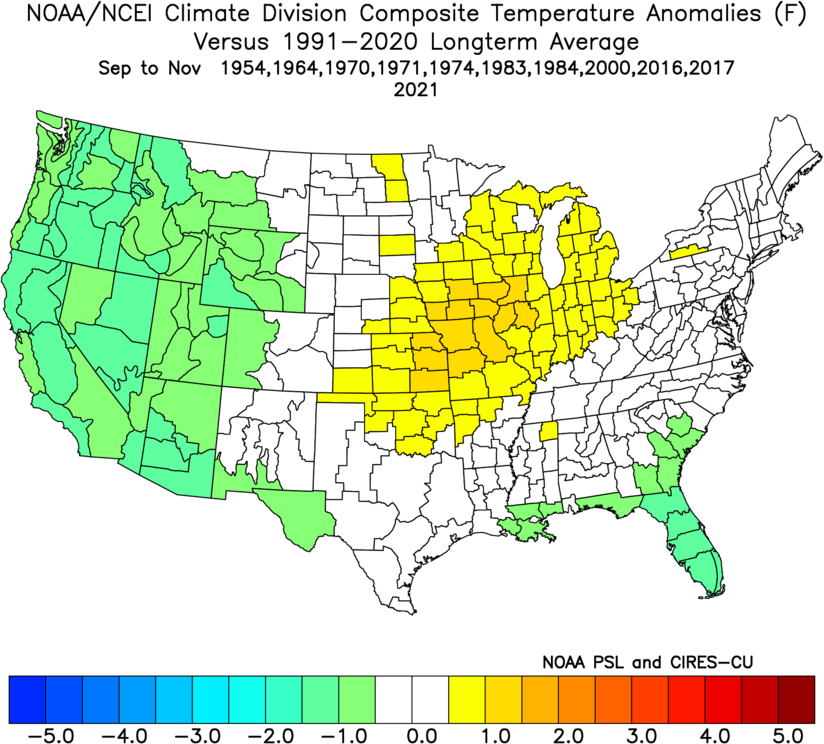 |
 |
 |

