 Email the author
Catastrophic flash flooding and river flooding occurred across much of Vermont in early to mid-July 2023. Extensive flooding to communities, washouts of numerous roads and bridges, and even the occurrence of land and mudslides resulted in significant property losses (monetary values are still being tallied). The most widespread and significant flood damage occurred as a result of prolonged heavy rainfall during the 10-11 July 2023 period (Fig. 1), when rainfall amounts of 3 to 9 inches were observed across the state over 48 hours (Fig. 2).The highest 48-hour rainfall total was 9.20" in Calais, Vermont and rainfall reports of 4 to 8 inches were commonplace along the spine of the Green Mountains and adjacent communities. See a listing of these reports here.
Figure 1. The National Severe Storms Laboratory Multi-Radar Multi-sensor (MRMS) mosaic composite reflectivity (dBZ) loop from 15 UTC (11am EDT) on 9 July 2023 through 16 UTC (noon EDT) on 11 July 2023.[click to enlarge]
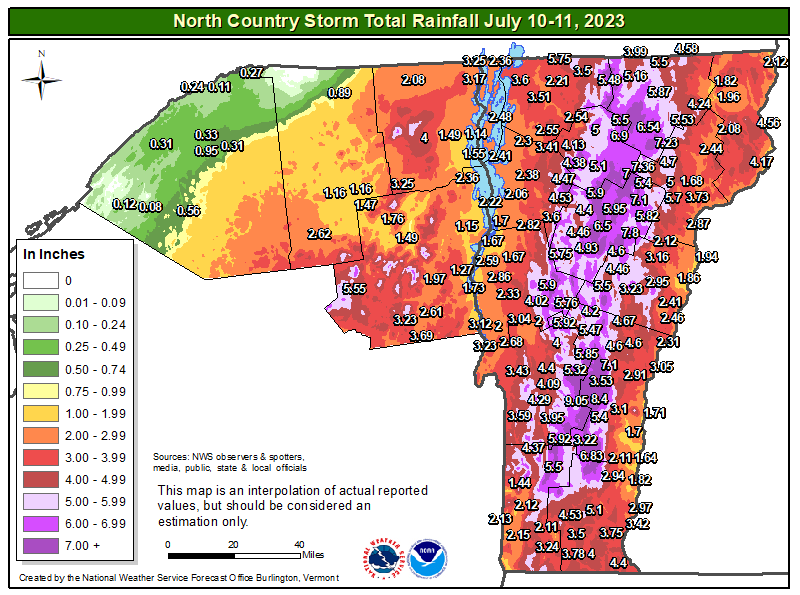
Figure 2a. Observed 48-hour rainfall amounts (inches) for the period 8 am EDT Sunday (7/9/2023) through 8 am EDT Tuesday (7/11/2023). Analysis by NWS Burlington. [click to enlarge]
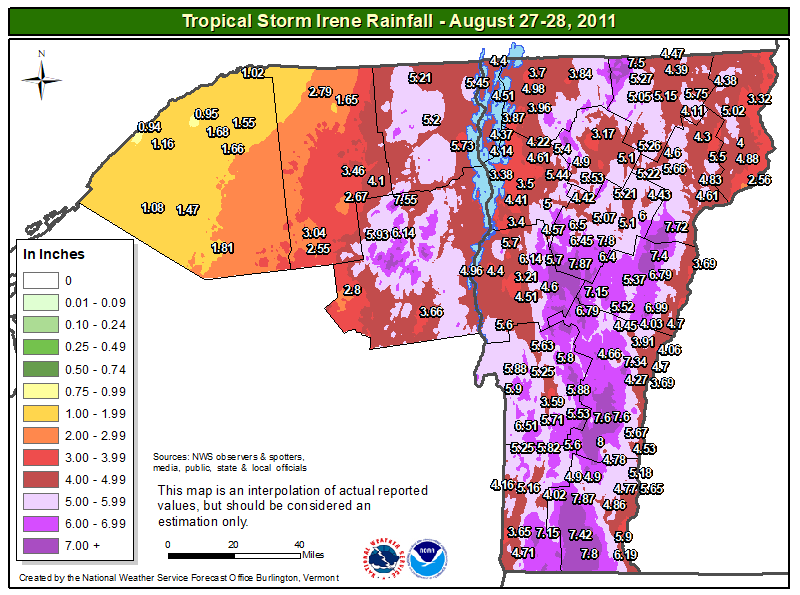
Figure 2b. Observed 48-hour rainfall amounts (inches) associated with Tropical Storm Irene for 27-28 August 2011. Analysis by NWS Burlington. [click to enlarge]
The 5.28" rainfall at the airport in Montpelier was the greatest calendar day rainfall at the site since records began in 1948, beating the previous record of 5.27" set with Tropical Storm Irene on 28 August 2011 (see Fig. 2b for rainfall analysis associated with Irene). July rainfall at Montpelier set an all-time monthly record of 12.06", beating the previous monthly record set in August 1989 (10.69").
Damage from the Great Vermont Flood of July 2023 rivaled - and in some areas exceeded - Tropical Storm Irene in 2011. Only the Great Flood of 3-4 November 1927, an event that preceded modern flood control in the state, exceeded the impact of the 2011 and 2023 events in the past century.
While two fatalities tragically occurred in connection with the flooding, the National Weather Service (NWS) Burlington forecast office worked in partnership with state agencies in advance of the storm to raise awareness of its severity. Confidence in the weather and water forecasts allowed a State of Emergency Declaration by Vermont Governor Phil Scott on Sunday afternoon, 9 July 2023, for the "imminent likelihood of excessive rain" and associated threat to property and public safety. The State of Emergency declaration facilitated mobilization of Type 1 swift water teams and other resources from nearby states, and activation of the state Emergency Operating Plan to mitigate storm impacts to the maximum extent possible. These were crucial steps in the protection of life and property during the flood events that followed. By the pre-dawn morning hours on July 11th, nearly 100 State and U.S. Highways were closed (Fig. 3). By July 14th, at least 212 urban and swift water rescues had been performed across Vermont.
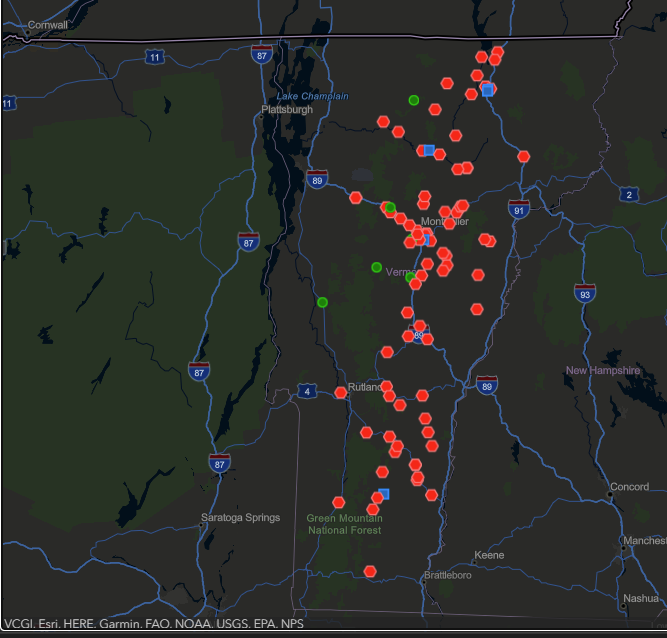
Figure 3. Status of state and U.S. highway total road closures (both lanes, red dots) at 230am EDT on Tuesday, July 11th. Blue squares denote partial road closures (e.g., one-lane open) and green dots indicate where previously closed roads had reopened. At its peak, state and U.S. highway road closures exceeded 100 instances across Vermont. [click to enlarge]
NWS Burlington also worked in close partnership with neighboring Weather Forecast Offices (WFOs), and intra-agency partners such as the Weather Prediction Center (WPC) and Northeast River Forecast Center (NERFC). This allowed for consistency in NWS messaging.
Following flooding in the Killington area on Friday July 7th, new Flood Watches for flash flooding were issued across Vermont on Saturday, July 8th for the July 9-11 period by WFOs Albany and Burlington. In anticipation of potentially historic flooding, on Sunday morning, July 9th, forecasters on duty worked to coordinate a "HIGH-risk" WPC Day 2 Excessive Rainfall Outlook (ERO) (Fig. 4). This was the first HIGH-risk Day 2 ERO ever issued for the Burlington forecast area. Later that morning during a Vermont Emergency Management conference call, forecasters used the words "historic" and "catastrophic" to describe the flooding that was about to unfold, also stating that impacts would be the worst seen since Irene. The consistency in messaging across NWS operational units responsible for heavy rainfall and river forecasts added confidence and facilitated the lifesaving actions that followed in conjunction with federal, state, and local partners.
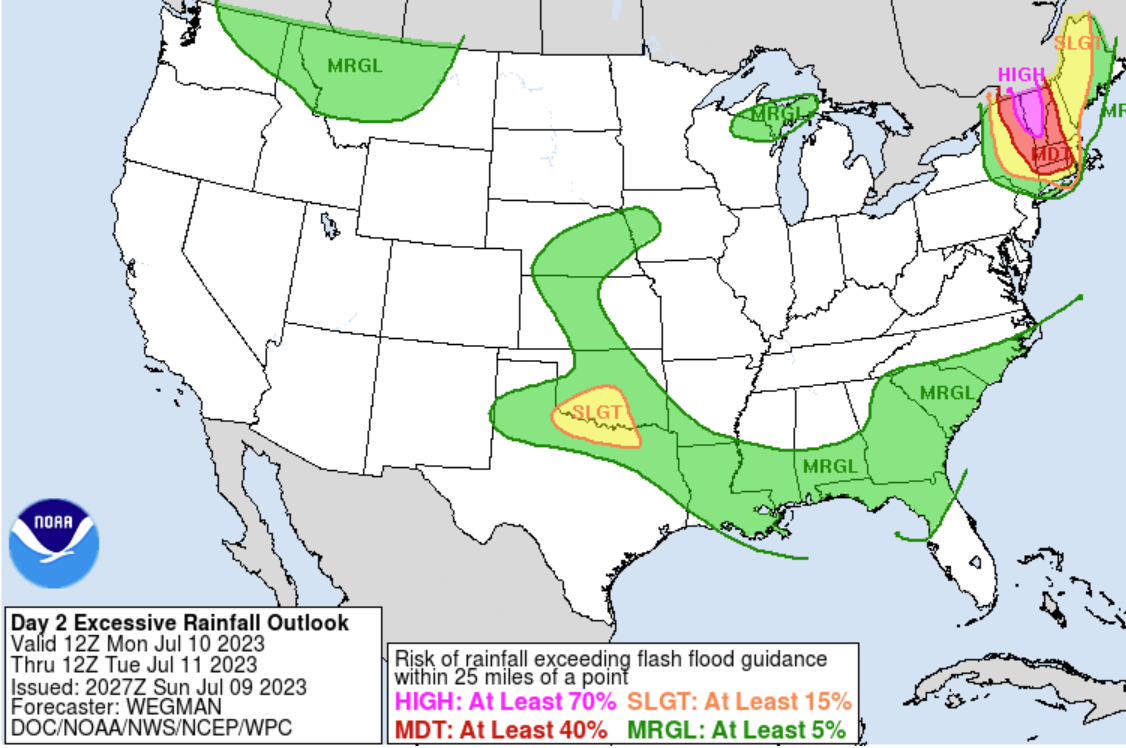
Figure 4. The Weather Prediction Center Day 2 Excessive Rainfall Outlook, issued at 4:27pm EDT Sunday, 9 July 2023 and valid for the period 8am EDT Monday 10 July through 8am EDT Tuesday 11 July 2023. The "High Risk" denotes at least a 70% chance of rainfall exceeding flash flooding guidance within 25 miles of a point. [click to enlarge]
This preliminary summary highlights some of the meteorological and hydrological data during 9-11 July 2023 period, in addition to some of the other flooding that occurred throughout early to mid-July 2023.
There were three primary meteorological factors that led to the heavy rain and flooding on 10-11 July 2023:
A high-latitude block was in place with an anomalously strong 500-mb ridge centered near southern Greenland, and an upstream closed upper low west of James Bay on 9 July (Fig. 5). This was part of an Omega block that extended eastward across the North Atlantic. Over time, the upper ridge would strengthen and also retrograde slightly on 10 July (Fig. 6) and 11 July (Fig. 7).

Figure 5. Daily composite mean 500mb heights (contours, meters) and height anomalies (color filled, meters) for 9 July 2023. Height anomalies are based on 1991-2020 NCEP/NCAR Reanalysis climatological data. (From NOAA Physical Sciences Laboratory) [click to enlarge]
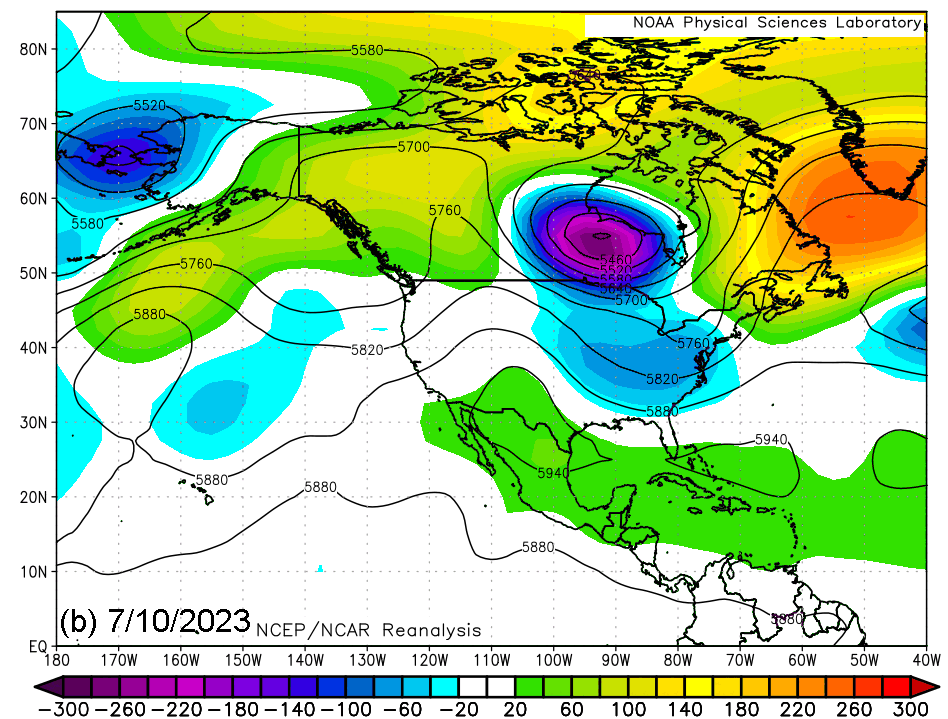
Figure 6. As in Figure 5, except for 10 July 2023. [click to enlarge]
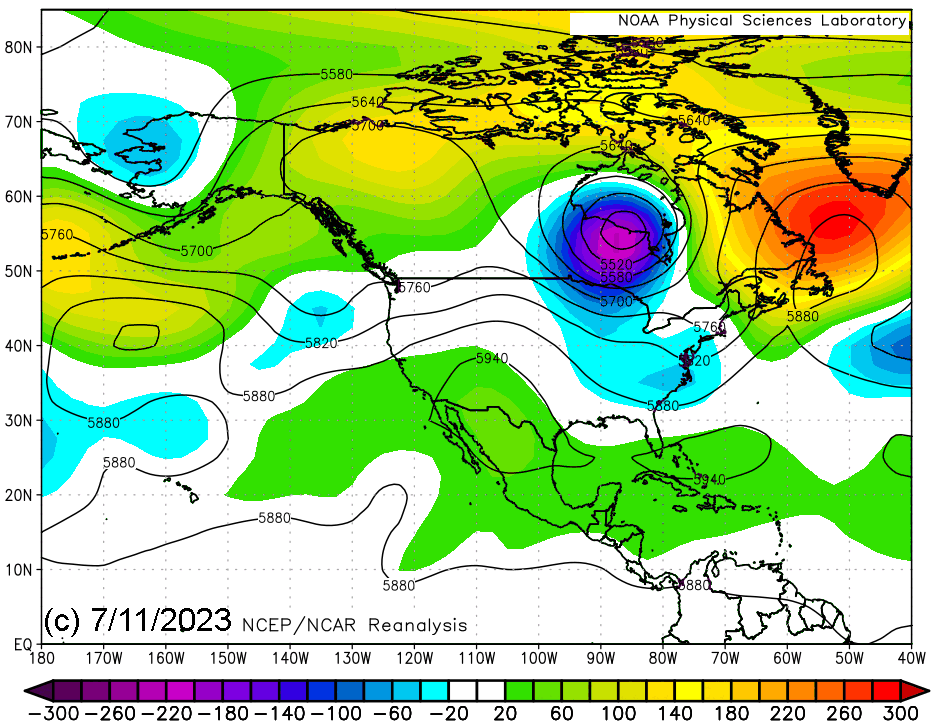
Figure 7. As in Figure 5, except for 11 July 2023. [click to enlarge]
A shortwave trough rounding the base of the shortwave trough across the Great Lakes and Ohio Valley of 9 July (Fig. 5) was associated with unseasonably strong upper tropospheric winds, with a dual 250-mb jet of 100-125 knots across the Ohio Valley and separately across southeastern Ontario and Quebec (Fig. 8). Upper diffluence helped strengthen the shortwave trough as it tracked into the Northeastern U.S. on July 10 and 11 (Fig. 6-7). As a result of the downstream blocking ridge, the intensifying system decelerated as it crossed New York and Vermont, prolonging the period of heavy rainfall. Surface low development was modest, but surface low pressure over New Jersey late Sunday evening (Fig. 9a) strengthened slowly as it lifted northward into western New England by late Monday morning (Fig. 9b). An inverted trough extended northward across Vermont, and became a focus for heavy rainfall, aided by orographic ascent along the spine of the Green Mountains.
Figure 8. The 250mb analysis valid at 8pm EDT, 9 July 2023. Isotachs are shaded in 25 knot increments above 75 knots. (From NOAA/Storm Prediction Center)[click to enlarge]
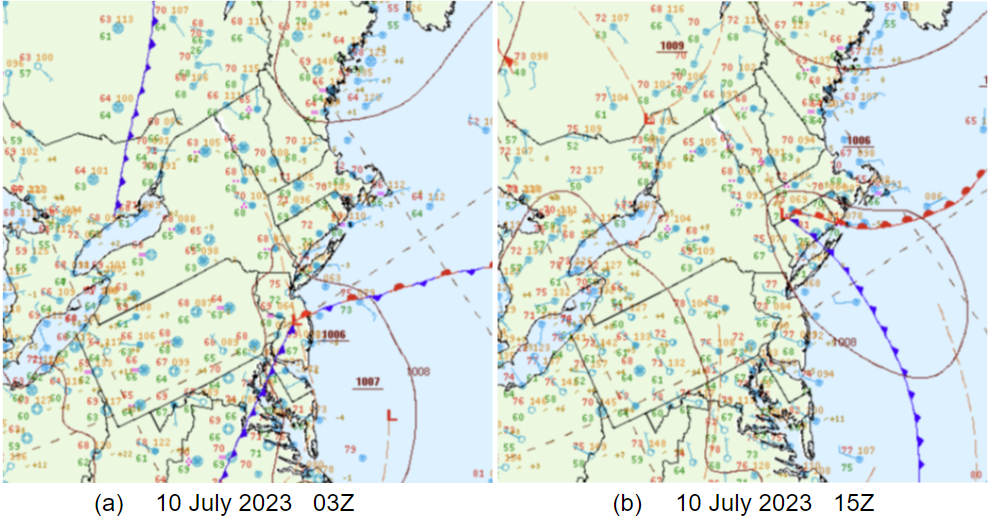
Figure 9. Surface analysis at (a) 11pm EDT, 9 July 2023 and (b) 11am EDT, 10 July 2023. (From NOAA/Weather Prediction Center) [click to enlarge]
Rich moisture was in place across New York and New England with surface dewpoints were in the upper 60s to lower 70s and precipitable water values of 1.6 - 1.8 inches (Fig. 10) in Vermont during the late evening hours on Sunday, 9 July. As the decelerating mid-level trough, developing surface low, and strong upper diffluence moved into eastern New York and western New England, the presence of rich moisture resulted in heavy rainfall rates as forcing for ascent increased. Instability was low, but a few embedded thunderstorms increased rainfall rates locally with convective updrafts. The high freezing levels (13 - 14 kft MSL) in place contributed to efficient warm rain, collision-coalescence processes and helped maximized rainfall efficiency from a microphysical perspective.
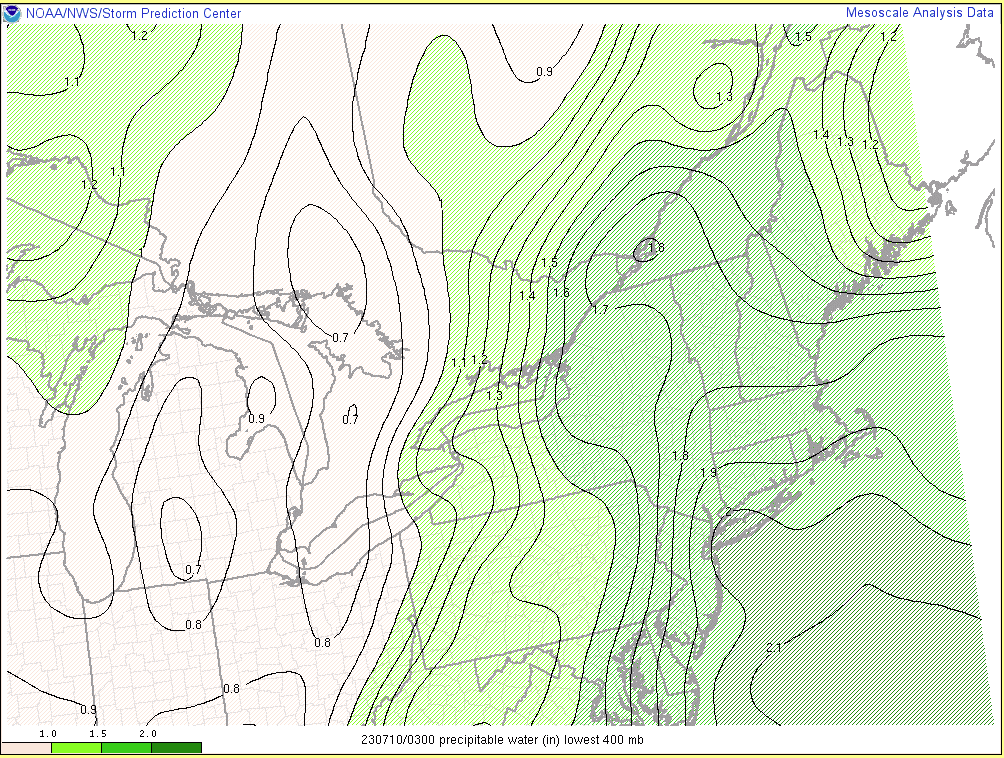
Figure 10. The NCEP/Storm Prediction Center (SPC) mesoanalysis precipitable water (inches) valid at 11pm EDT, 9 July 2023. The SPC mesoanalysis uses the Rapid Refresh (RAP) model 1-hr forecast in conjunction with surface observations as its basis. (From NOAA/Storm Prediction Center mesoanalysis) [click to enlarge]
From a hydrological standpoint, heavy rainfall preceding the main event on 10-11 July 2023 resulted in high soil moisture content and increased runoff when the heaviest rain arrived. June rainfall had been 1-2 inches above average across portions of central and southern Vermont, including 2.42" above average at Springfield. Also, localized flash flooding occurred immediately prior to the historic flooding across portions of central and southern Vermont on Friday, 7 July when 2-4 inches of rain fell across central Vermont. A localized rainfall total of 4.43" in Killington resulted in significant flash flooding. The abnormally high antecedent soil moisture contributed to greater runoff and a higher incidence of flash and river flooding on 10-11 July 2023, just as it had when Irene struck Vermont in August 2011.
While a comprehensive review of numerical model forecasts is beyond the scope of this document, numerical models generally captured the significant rainfall, which aided in forecaster expectations on rainfall amounts and impact. From an ensemble standpoint, The High Resolution Ensemble Forecast (HREFv3) run from 9 July 2023 at 12Z (8am EDT) local probability-matched mean (LPMM) quantitative precipitation forecast (QPF) product was useful to BTV forecasters in real-time. The LPMM QPF was generally 3-5" for the 24-hour period ending at 11 July 2023 at 00Z (Fig. 11) and was spatially accurate.
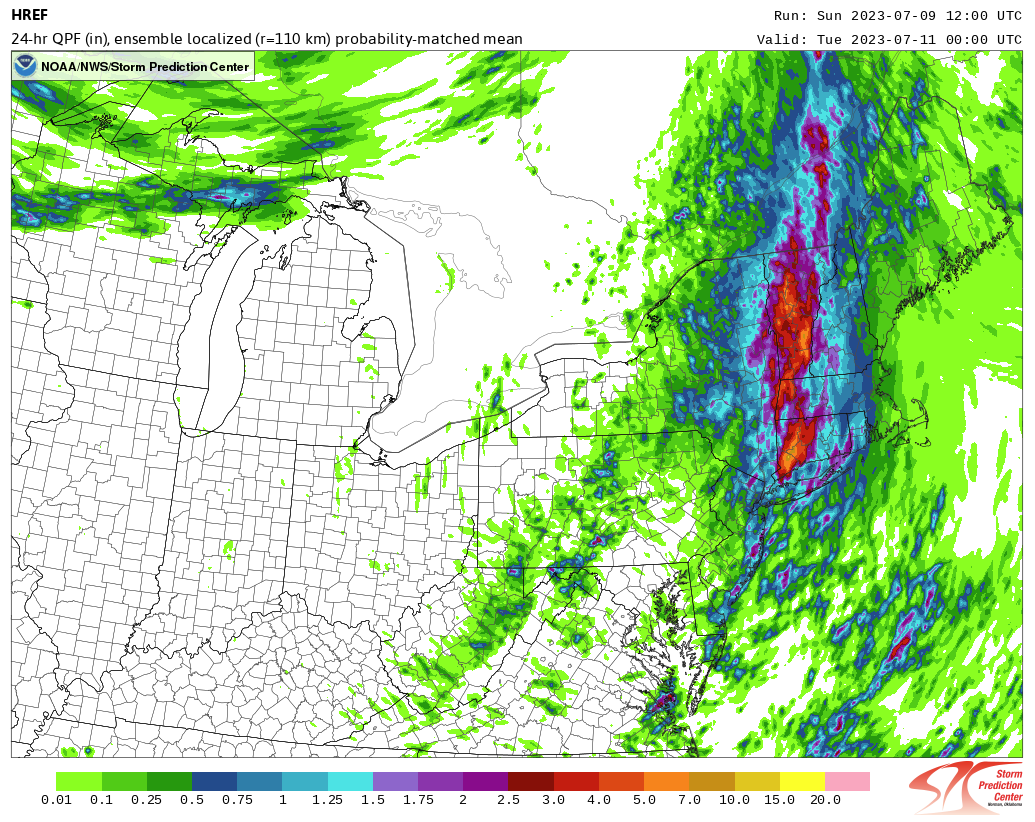
Figure 11. The NCEP/EMC High-Resolution Ensemble Forecast (HREF) localized (radius = 110 km) probability-matched mean 24-hour precipitation forecast, for the period 8pm July 9th through 8pm July 10th. Maximum values in the 4-5 inch range were forecast across central Vermont for the 24 hour period (graphic generated by NOAA/Storm Prediction Center). [click to enlarge]
The lower-resolution global ensembles, while unable to capture the heavy rainfall event with the same sharpness, nonetheless provided useful signals to forecasters. The 9 July 2023 12Z Global Ensemble Forecast System (GEFS) mean 48-hr QPF was 2-3" broadly across Vermont for the period 12Z Sunday, July 9th through 12Z Tuesday, July 11th (Fig. 12). However, relative to reforecasts of the GEFS over a 20-year period (2000-2019), these mean QPF values were in the 99th percentile to a new maximum. This lended confidence in using a historical analog (i.e., Irene) as a reference in messaging the expected impacts from this event in real-time. Since the events of 2011 are still in the collective memory of many Vermonters, we believe the use of a historic analog in this case was key in the pre-storm actions taken to mitigate flooding impacts to the extent possible.
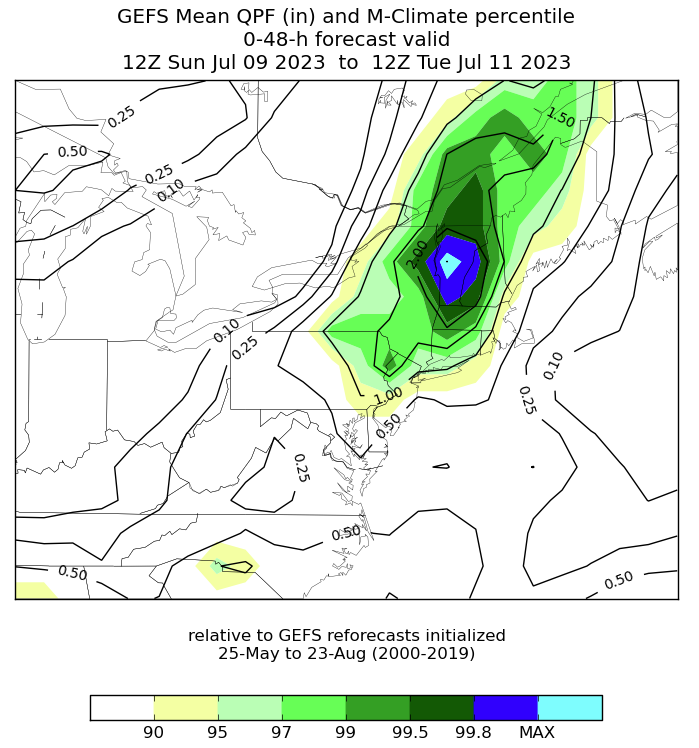
Figure 12. The Global Ensemble Forecast System (GEFS) ensemble mean 48-hr quantitative precipitation forecast (QPF in inches, solid lines) for the period 8am EDT Sunday, 9 July 2023 through 8am EDT Tuesday 11 July 2023. Color-filled regions denote the mean QPF percentile rank greater than the 90th percentile based on the 20-year reforecast period (2000-2019) within 45-days of the calendar day analyzed (25 May through 23 August). The "MAX" category denotes where the GEFS 48-hour mean QPF exceeded any past forecast. From the NOAA/Ensemble Situational Awareness Table. [click to enlarge]
Flooding reports were widespread across much of Vermont during 10-11 July 2023 (Fig. 3), with the greatest concentration of damage occurring throughout the central portion of the state including the cities of Barre and Montpelier. In the state capital, much of the downtown district was inundated by flood waters from the Winooski river and its tributaries. Many communities along the Winooski and Lamoille rivers suffered inundation with damage to homes and businesses. While a comprehensive listing of flash flooding reports is beyond the scope of this preliminary report, many small towns along the eastern slopes of the Green Mountains were hard hit, including Londonderry, Weston, Ludlow, and Hardwick. Damage included washouts of roads and railroad beds, while flooding and mudslides stranded some residents in their homes. Flooding also extended to the Missisquoi basin of far northern Vermont and the Upper Passumpic basin in Vermont’s Northeast Kingdom. Basement flooding was also widespread.
Many main-stem rivers across Vermont reached major to record crests, as displayed in the NWS Advanced Hydrologic Prediction System (AHPS) images below.
In central and northern Vermont, the Winooski River at Montpelier crested at 21.35 feet on Tuesday morning, 11 July 2023 (Fig. 13), resulting in inundation of the downtown district. This exceeded the crest associated with Irene by 2+ feet, and is second only to the crest of 27.10 feet observed on 3 November 1927. The Winooski River at Waterbury and Essex Junction (not shown) also recorded their second and third highest crests, respectively. The Dog River in Northfield Falls (not shown) also reached major flood stage, cresting at 11.63 feet.
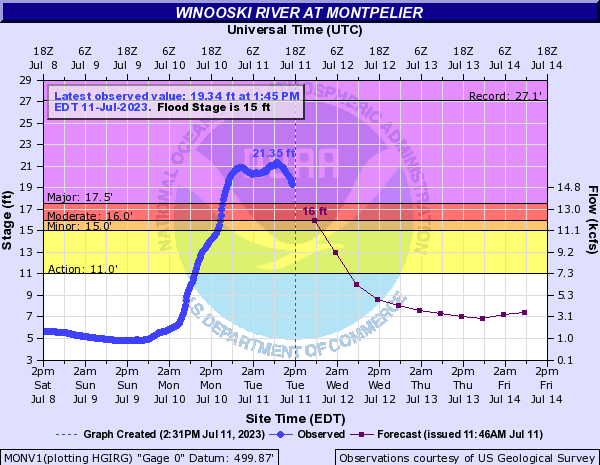
Figure 13. The observed hydrograph (dark blue line) for the Winooski River at Montpelier, showing a crest of 21.35 feet during the mid-morning hours on Tuesday, 11 July 2023. Crest values are considered preliminary. (NOAA/Advanced Hydrologic Prediction Service) [click to enlarge]
In the Lamoille River Valley, the gage at Johnson reached its second highest crest on record (after November 1927) (Fig. 14), while Jeffersonville set a new record (note: the Jefferson gage went online in January 2010). The Missisquoi River also reached major flood stage, with the 5th highest crest on record at North Troy (not shown).
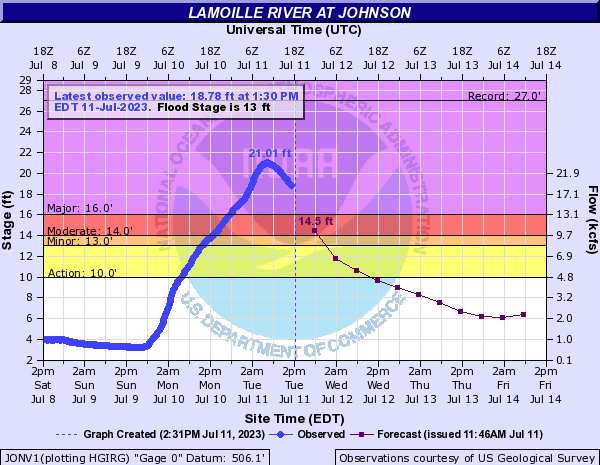
Figure 14. The observed hydrograph (dark blue line) for the Lamoille River at Johnson, showing a crest of 21.01 feet during the pre-dawn hours on Tuesday, 11 July 2023. Crest values are considered preliminary. (NOAA/Advanced Hydrologic Prediction Service) [click to enlarge]
In south-central and southern Vermont, the Otter Creek at Center Rutland hit major flood stage, cresting at 16.36 feet (Fig. 15). This was within one foot of their all-time record and second only to Irene in August 2011. The Williams River near Rockingham crested at 16.16 feet (not shown), also in the major flood category.

Figure 15. The observed hydrograph (dark blue line) for the Otter Creek at Center Rutland, showing a crest of 16.36 feet during the pre-dawn hours on Tuesday, 11 July 2023. Crest values are considered preliminary. (NOAA/Advanced Hydrologic Prediction Service)[click to enlarge]
As alluded to in the introduction, flooding was not limited to the July 10-11, 2023 period. Other periods of significant impacts occurred over more localized areas. This was unlike Tropical Storm Irene in 2011, when conditions rapidly dried out following that storm.
On 7 July 2023, severe flooding occurred in the vicinity of U.S. Route 4 and Killington, with numerous road washouts.Rainfall totals locally exceeded 4" in Killington that afternoon and evening. On Thursday, July 13th, severe thunderstorms also produced heavy rainfall and localized flooding. On Friday evening, July 14th, strong thunderstorms produced observed rainfall of 3.42" in Ripton, Vermont resulting in flooding of the Middlebury river. This yielded state road closures in Middlebury, East Middlebury, and Ripton. In Ripton, a landslide occurred resulting in destruction of one home and damage to 12 others.
On Sunday, 16 July 2023, a tropical air mass and favorable upper jet dynamics contributed to additional flooding that evening in the Richmond area and across portions of Vermont’s Northeast Kingdom. The observed precipitable water value on the Gray, ME rawinsonde was 2.34", though is thought to have been entrained into a thunderstorm updraft. Rainfall totals (Fig. 16) exceeded 3+" in the communities of Charlotte (3.89"), Richmond (3.45"), Hinesburg (3.25") and Williston (3.15"). In Northeast Vermont, greater than 3+" rainfall was observed in Wheelock (4.45"), Burke Hollow (3.89"), Wheelock (3.66"), and Danville (3.07"). These heavy rainfall totals resulted in a significant number of road closures in those communities that Sunday evening, in addition to Lyndonville, Sutton, and East Haven.
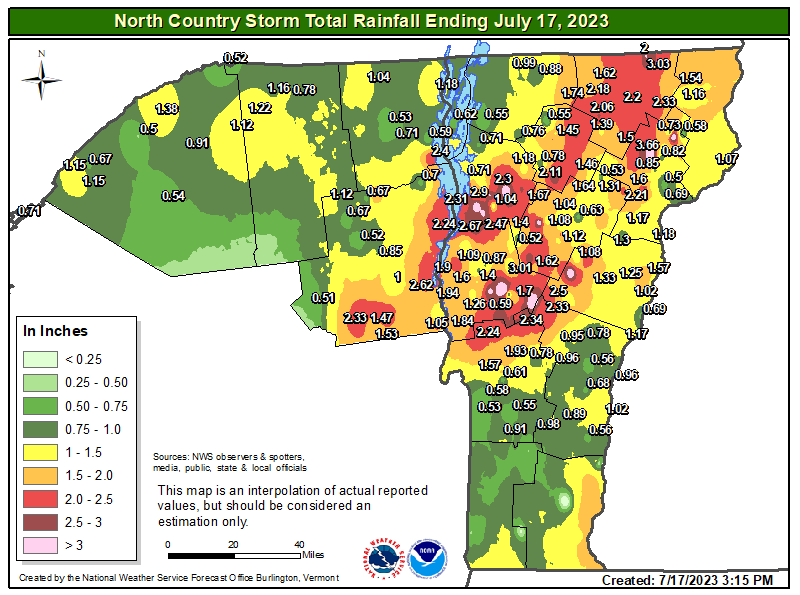
Figure 16. Observed 36-hour rainfall amounts (inches) for Sunday, July 16th through noon EDT on Monday, July 17th. Analysis by NWS Burlington. [click to enlarge]


 Follow us on YouTube