
Extreme heat continues across the Southwest as temperatures may top 120 degrees. The heat may expand across the West and south-central U.S. into the middle of the month. Severe thunderstorms capable of severe wind gusts and large hail will be the primary hazards today across the northern Plains into the upper Midwest. Rainfall could be locally heavy across the Eastern U.S. today. Read More >
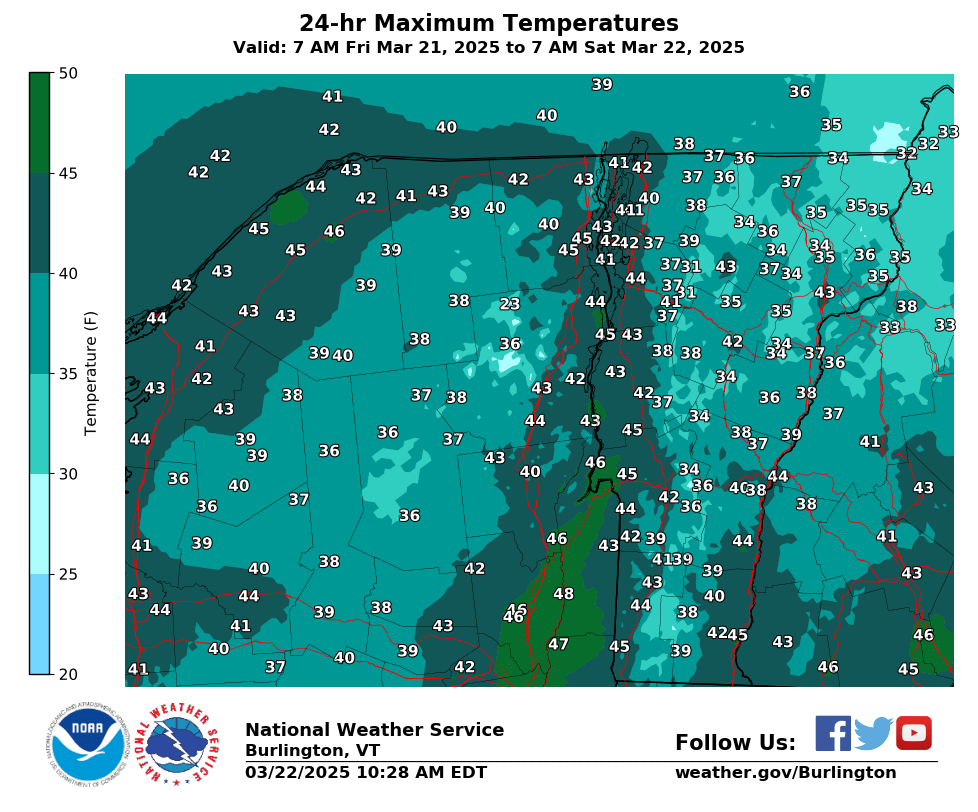
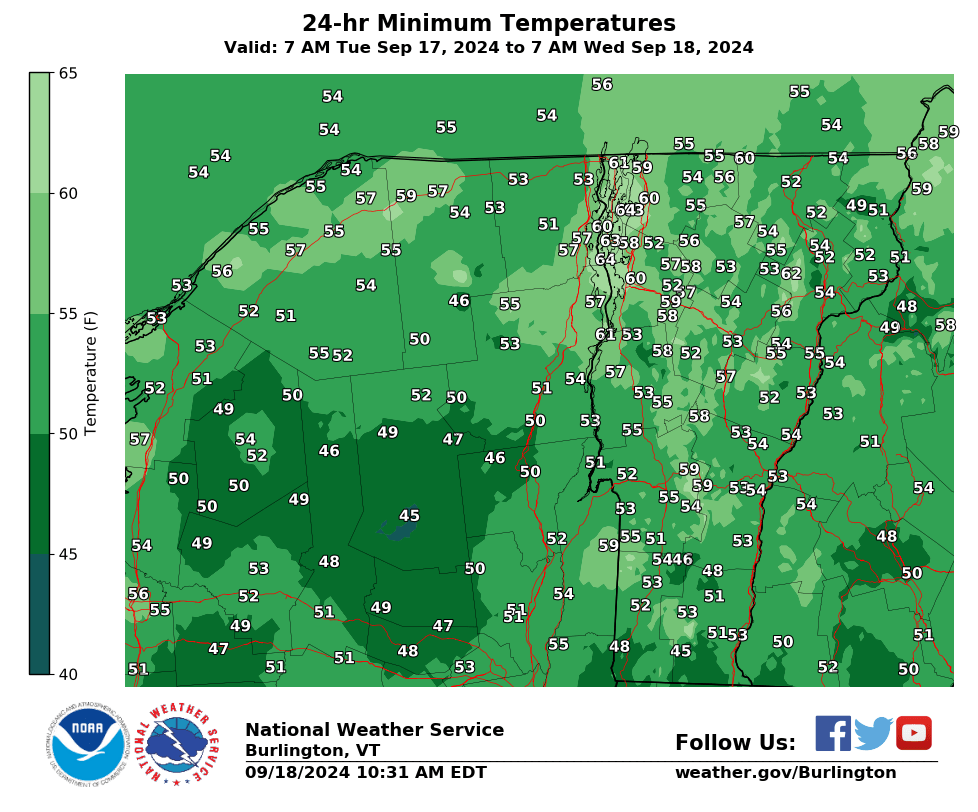
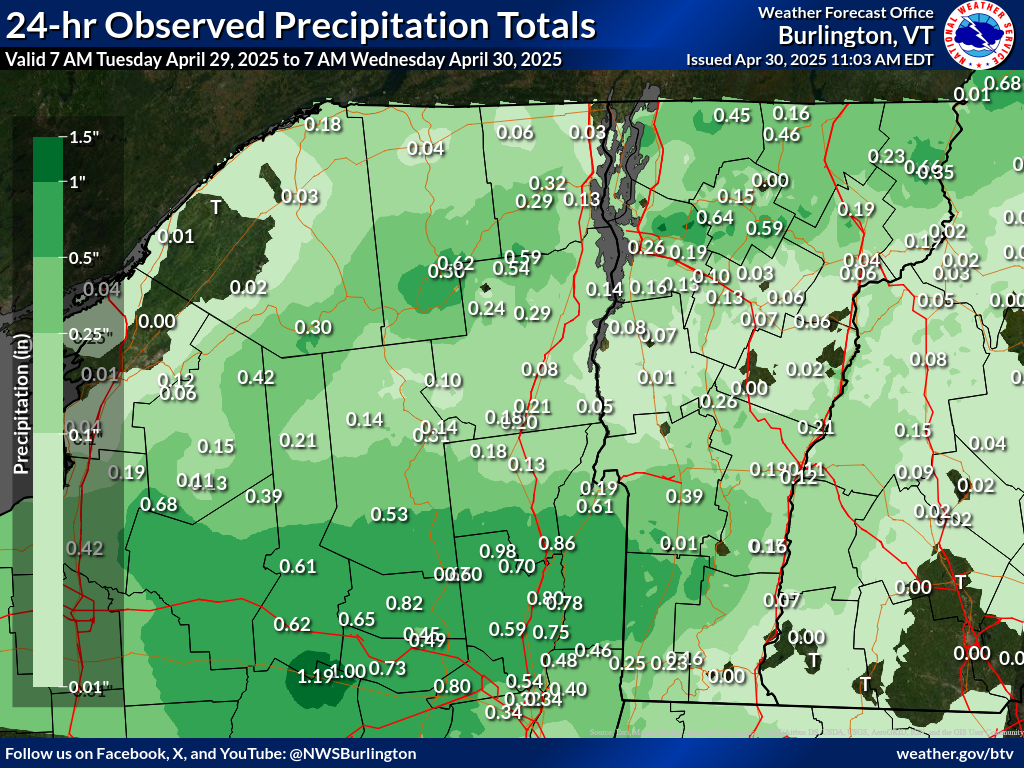
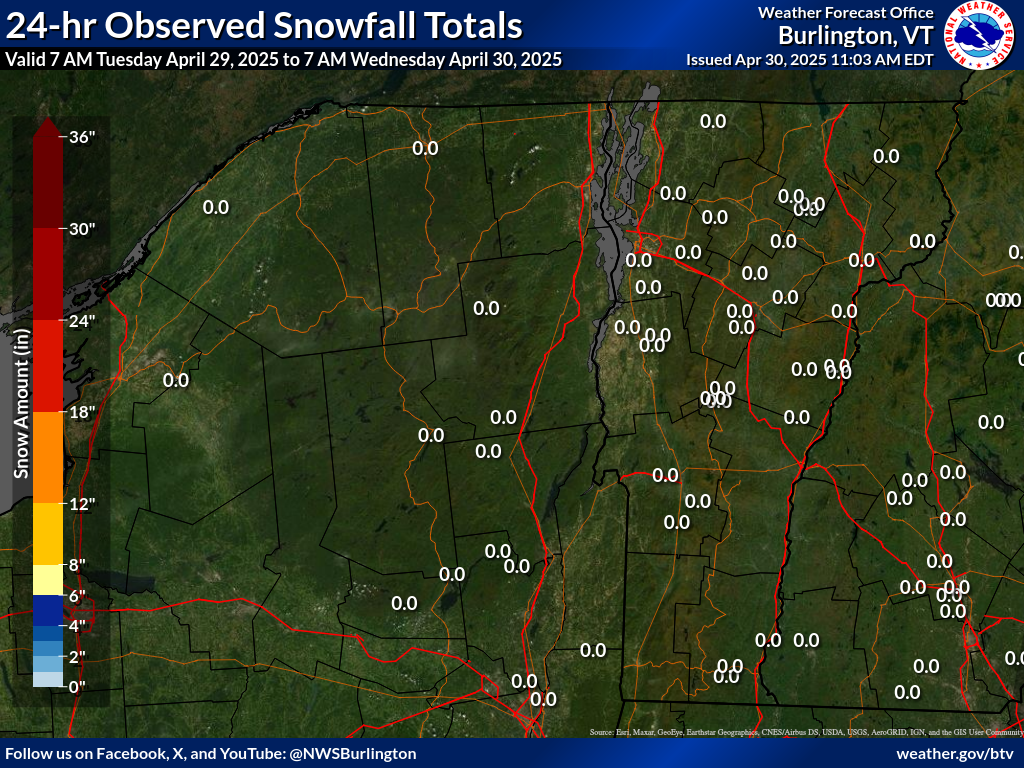
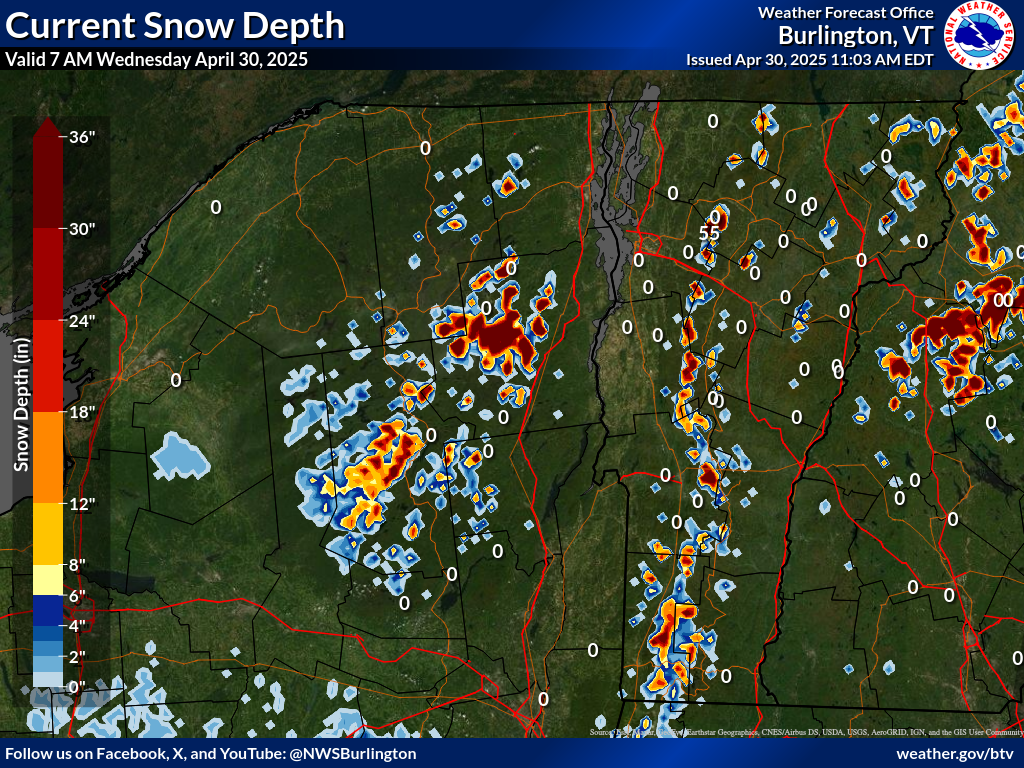
| Max Temp | Min Temp | Precip | Snowfall | Snow Depth |
 |
 |
 |
 |
 |
| Precipitation | Precipitation Departure from Normal | Precipitation Percent of Normal |
| Archive: | Archive: | Archive: |
| Snowfall | Snowfall Departure from Normal | Snowfall Percent of Normal |
| Archive: | Archive: | Archive: |
| Temperature Departure from Normal | ||
| Archive: | ||
| Precipitation | Precipitation Departure from Normal | Precipitation Percent of Normal |
| Archive: | Archive: | Archive: |
| Snowfall | Snowfall Departure from Normal | Snowfall Percent of Normal |
| Archive: | Archive: | Archive: |
| Temperature Departure from Normal | ||
| Archive: | ||
6-10 Day Outlook |
8-14 Day Outlook |
||
Temperature
|
Precipitation
|
Temperature
|
Precipitation
|
One Month Outlook |
Three Month Outlook |
||
Temperature
|
Precipitation
|
Temperature
|
Precipitation
|
| Temperatures | Precipitation & Snowfall |
| Lake Champlain Level Annual Mean & Extremes 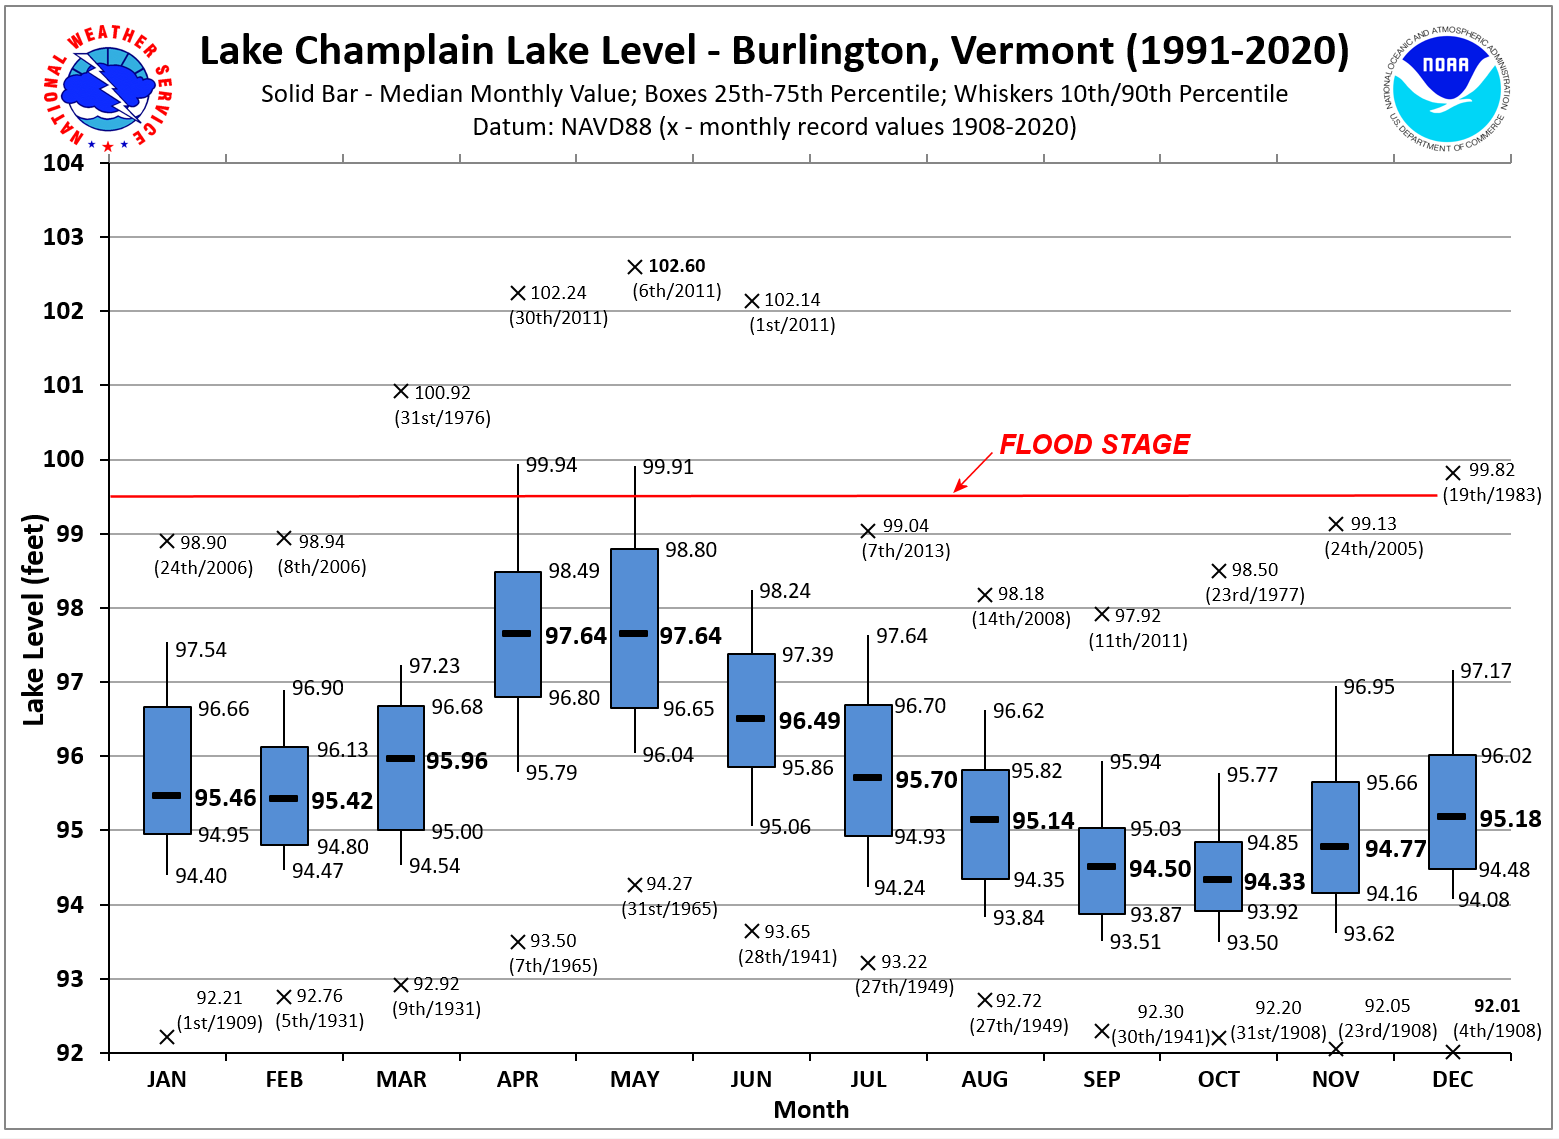
|
Lake Champlain Level Spring Mean & Extremes 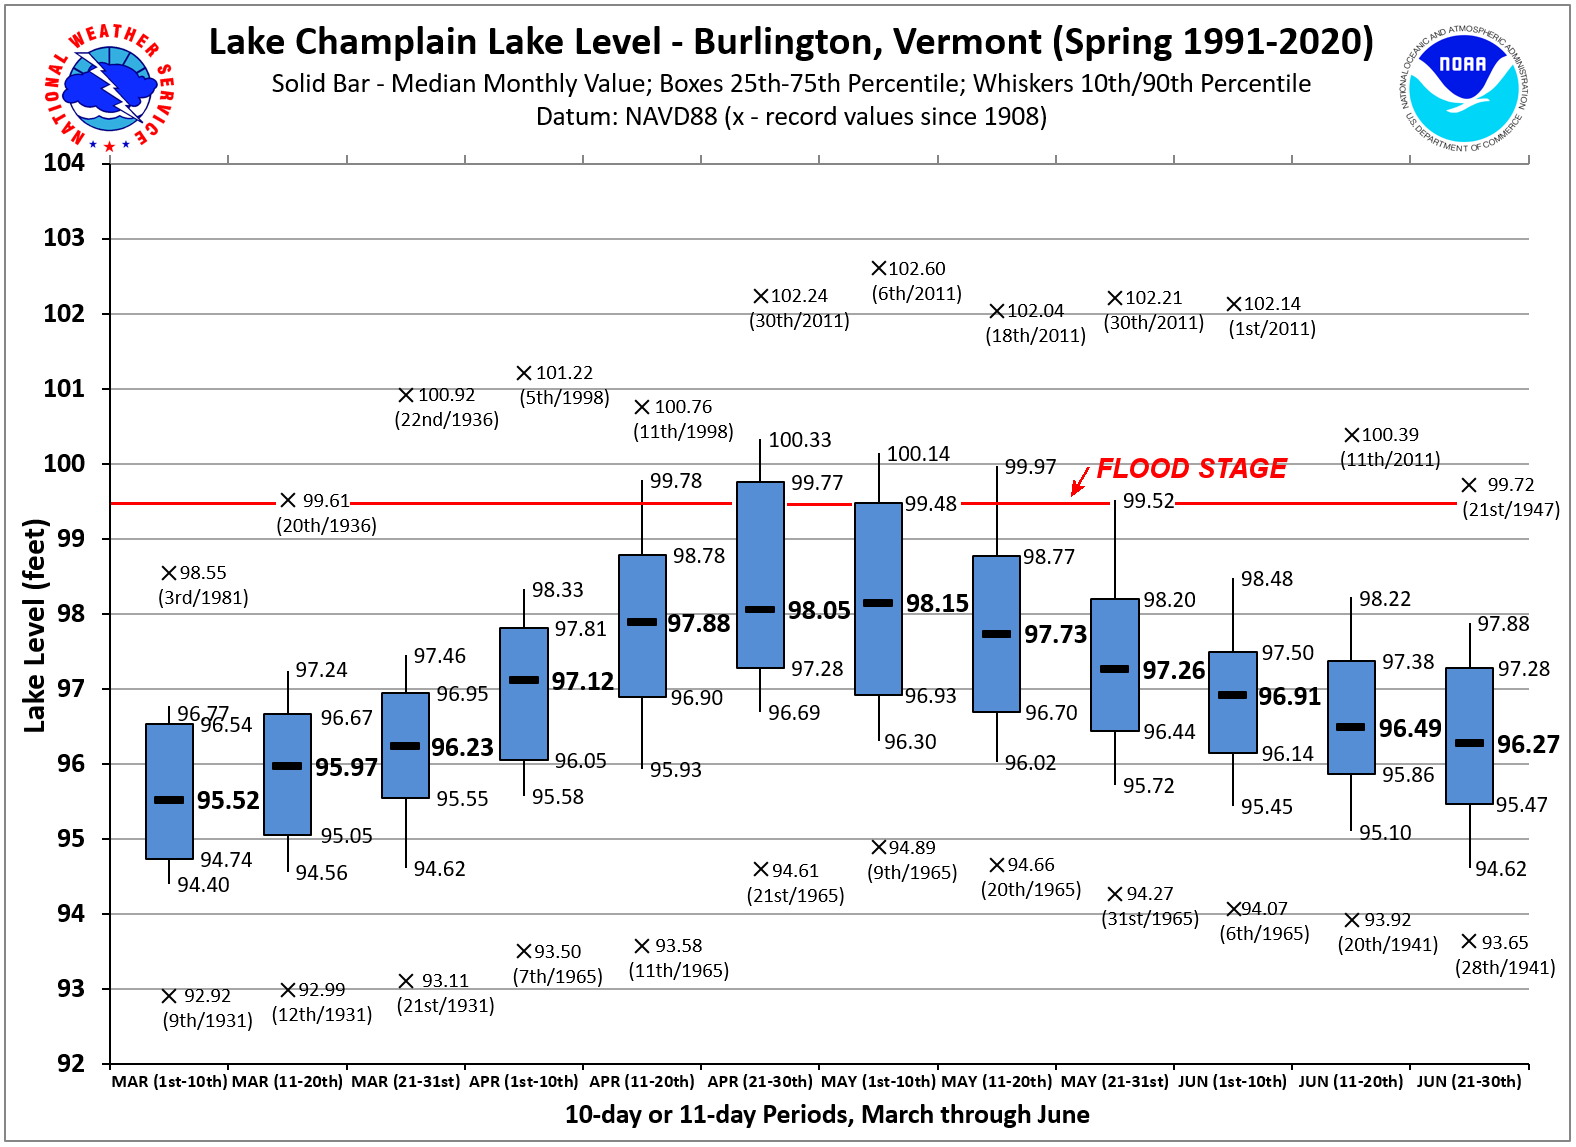
|
Lake Champlain Temperature Mean & Extremes 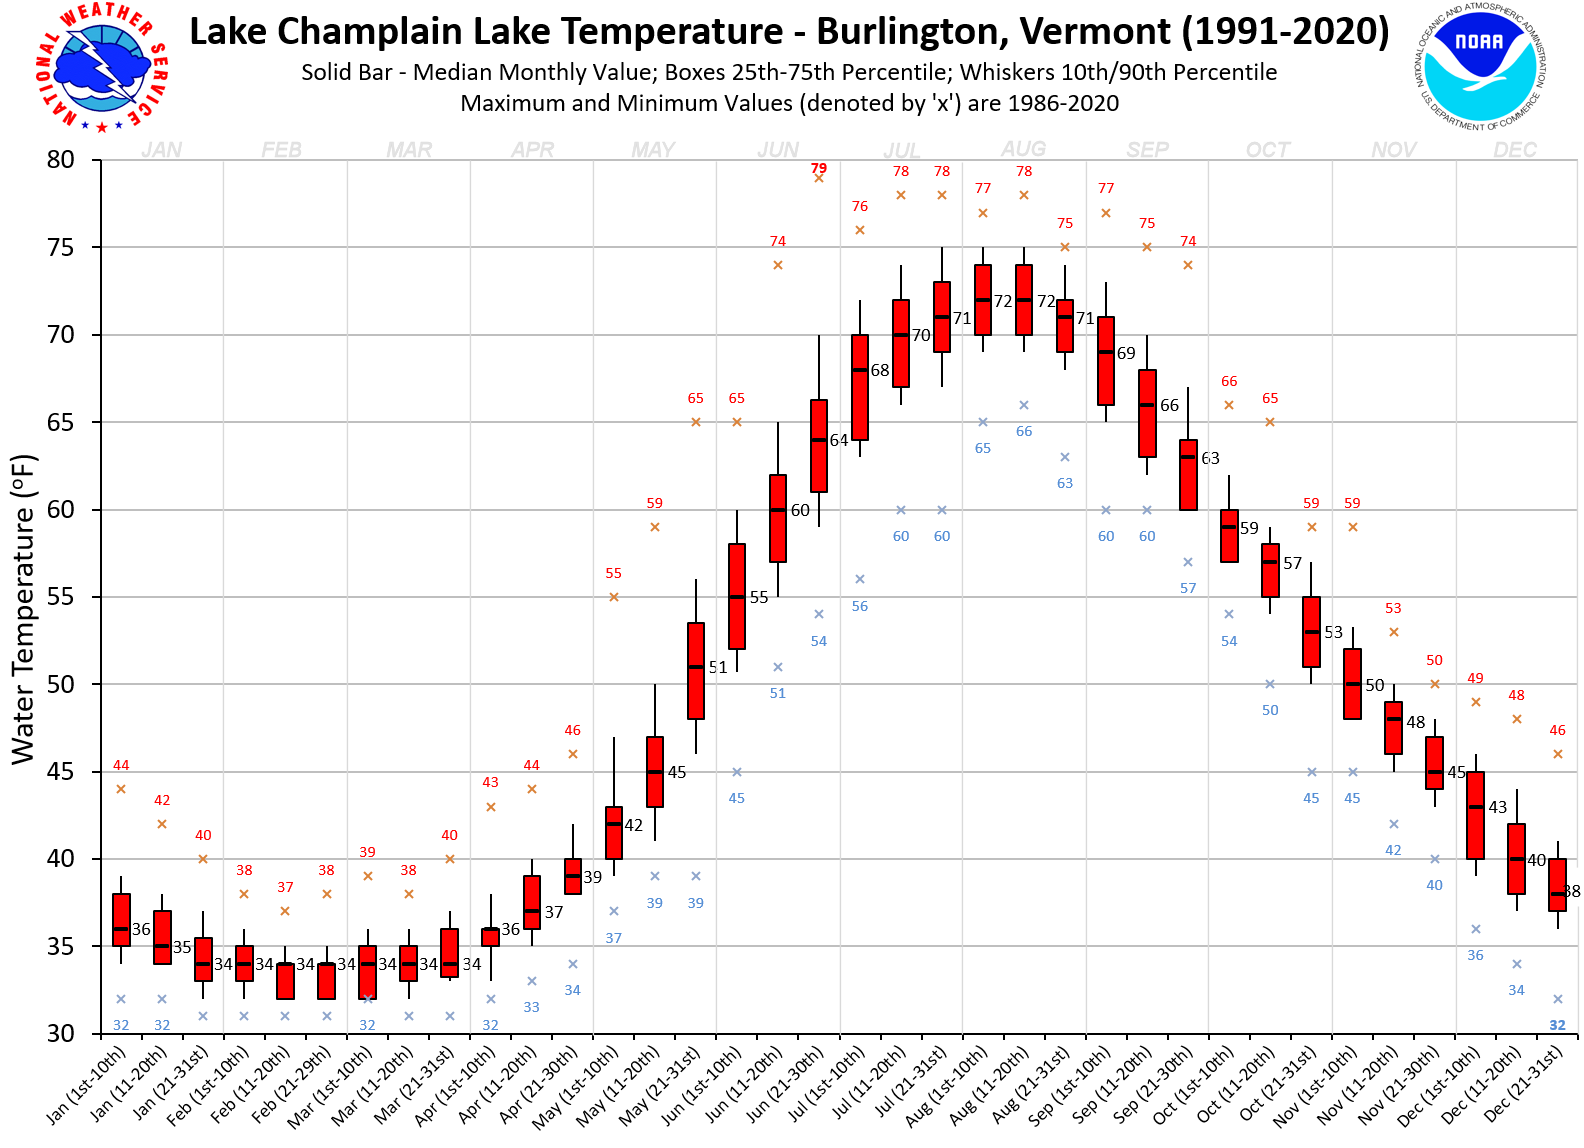
|
| BTV Annual Mean Max Temperature 
|
BTV Annual Mean Min Temperature 
|
BTV Annual Mean Temperature 
|
| New England Annual Mean Max Temperature 
|
New England Annual Mean Min Temperature 
|
New England Annual Mean Temperature 
|
| Northeast Annual Mean Max Temperature 
|
Northeast Annual Mean Min Temperature 
|
Northeast Annual Mean Temperature 
|
BTV Average Annual Precipitation
|
New England Average Annual Precipitation
|
Northeast Average Annual Precipitation
|
BTV Average Annual Snowfall
|
New England Average Annual Snowfall
|
Northeast Average Annual Snowfall
|

