| Informational Videos | |||||||
| What is Severe Weather Awareness Week? | |||||||
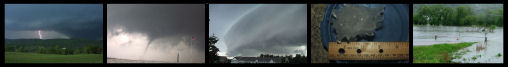
Thunderstorms |
Flash Flooding  |
Hail |
Lightning Safety |
Lightning Formation |
Tornadoes |
Microbursts |
Thunderstorm Preparedness |
Introduction |
The Synthesis of Information |
Ready - Set - Go! |
Watch vs. Warning |
Severe Thunderstorms |
Thunderstorm Climatology |
Thunderstorm Safety |
Lightning Safety |
Tornados |
Lightning Safety |
Types of Flooding |
Flash Flooding |
Social Media |
|||
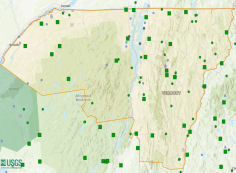
Severe weather can happen at any time. Here are some events from the last few years:
A Review of the Beekmantown, New York EF-0 Tornado on 10 June 2025: A weak tornado touched down near the southern end of Beekmantown, New York on June 10th, 2025. The tornado downed and uprooted multiple trees, caused roof damage, and flung small objects - including a trampoline - as it moved generally in an east-northeastward direction. A post-event damage survey conducted by the National Weather Service (NWS) Forecast Office in Burlington, Vermont determined that the path length of the tornado was approximately one-half mile and the maximum width of the tornado reached 100 yards.
Large Hail and Flash Flooding Event on 17 May 2025: Several rounds of strong to severe thunderstorms produced large hail, isolated wind damage, and localized flash flooding on May 17th, 2025. Favorable environmental conditions allowed for hail up to 2 inches in diameter to fall near Richmond, Vermont. In addition, strong winds knocked over a solo near St. George, NY. Over 4000 customers across Vermont lost power due to strong winds blowing over trees and powerlines. Heavy rainfall also led to flash flooding in Cambridge, Waitsfield, Killington, and Hartford.
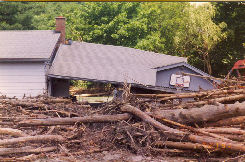
Extreme Nocturnal Rainfall and Flash Flooding in Vermont’s Northeast Kingdom: 30 July 2024: During the overnight hours of July 29th into July 30th, 2024, slow-moving thunderstorms brought torrential rainfall to portions of Orleans, Caledonia, and Essex counties. Rainfall totals across these areas ranged from 4 to 8 inches, with intensities exceeding 2 inches per hour over an extended period. This intense rainfall resulted in rapid and severe flash flooding. Post-event flood surveys conducted by the National Weather Service (NWS) in Burlington identified the towns of Morgan, Lyndon, and St. Johnsbury as some of the hardest hit, with significant destruction reported: 42 homes and 16 bridges were destroyed, and numerous roads were washed out. Several landslides also occurred in the region.
The significant Flooding and Severe Weather Event of 10-11 July 2024: A combination of flash flooding, river flooding, and severe weather was observed with the remnants of Tropical Cyclone Beryl. The remnants interacted with a quasi-stationary front that was draped across the Northeastern United States. The heaviest rainfall fell along an axis from Essex County, NY east-northeastward across central into northeastern Vermont. Total rainfall amounts were generally between 2-5 inches with localized amounts exceeding 7 inches.
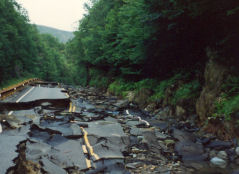
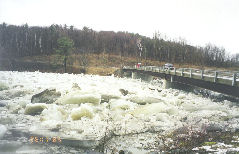
Great Vermont Flood of 2023: Great Vermont Flood of 2023 - Catastrophic flash flooding and river flooding occurred across much of Vermont in early to mid-July 2023. Extensive flooding to communities, washouts of numerous roads and bridges, and even the occurrence of land and mudslides resulted in significant property losses (monetary values are still being tallied). The most widespread and significant flood damage occurred as a result of prolonged heavy rainfall during the 10-11 July 2023 period, when rainfall amounts of 3 to 9 inches were observed across the state over 48 hours. The highest 48-hour rainfall total was 9.20" in Calais, Vermont and rainfall reports of 4 to 8 inches were commonplace along the spine of the Green Mountains and adjacent communities.
For a more comprehensive list of severe weather events, click here.
Other NOAA/NWS Severe Weather Links
| Winter Weather Awareness Week October 27th through November 2nd, 2024 |
|
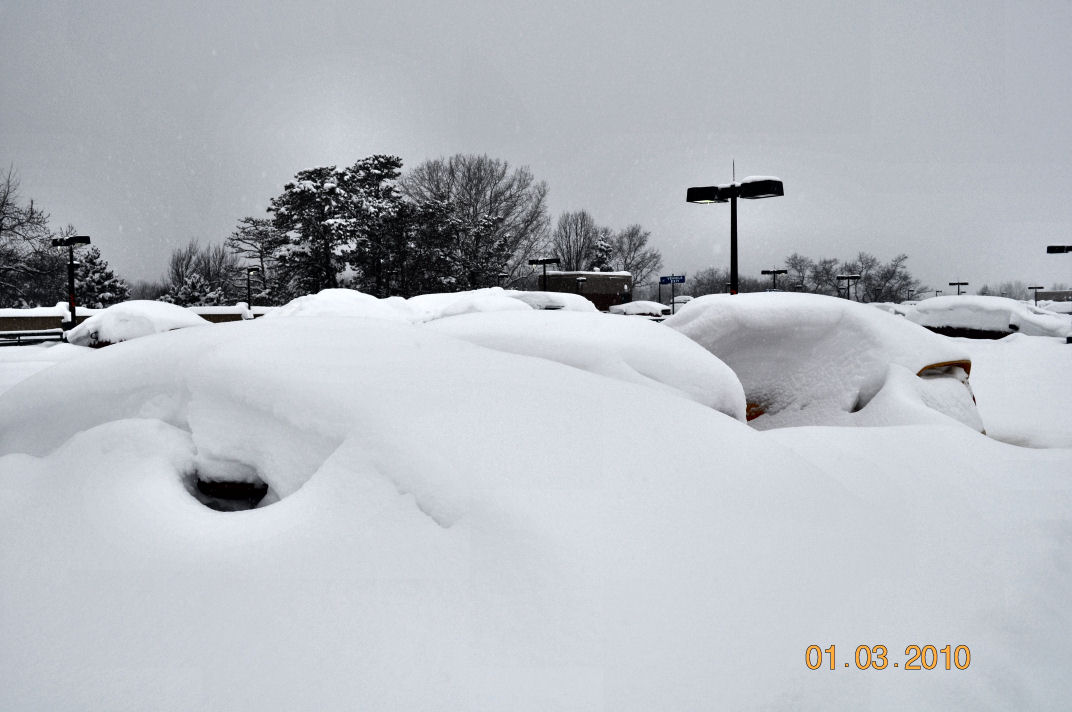 Burlington International Airport, S. Burlington, VT |
Winter 2024-2025 Temperature and Precipitation Outlook Be safe in winter weather. Learn more about: Snow, Ice Storms, Winter Flooding, and Preparedness |
|
Daily Topics
|
Informational Videos
|
|
|
|
|
Forecasts/Warnings
|
Awareness/Preparedness
|
| Climate and Outlooks | Notable BTV Winter Storms |
|
"Stay Cool, Find Shade, Don’t Over Exert and Drink Plenty of Water"
The National Weather Service categorizes a hot day when temperatures reach 90 degrees or warmer. In the North Country, we average between 6 and 10 such days a year, with some years witnessing more than 20 days. In Burlington, the most 90 degree or above days observed was 26 days in 1949. In 2013, 9 days of 90 degree or warmer temperatures were observed. An "official" heat wave is defined as three or more consecutive days with the temperature reaching or exceeding 90 degrees. The longest heat wave in Burlington was 8 days in August 1944. In 2013, there was one heat wave, a 5 day heat wave from July 15 temperatures approaching 100 degrees.
| The Hazards of Excessive Heat Although an "official" HOT DAY is classified when temperatures reach 90 degrees or warmer, heat related health effects can occur with temperatures in the 80s, combined with high humidity and prolonged sun exposure. During extremely hot and humid weather, the body's ability to cool itself is affected. When the body heats too rapidly to cool itself properly, or when too much fluid or salt is lost through dehydration or sweating, body temperature rises and heat-related illnesses may develop. Heat-related illnesses can range from heat cramps to heat exhaustion to more serious heat stroke. Heat stroke can result in death and requires immediate medical attention. |
 |
Factors or conditions that can make some people more susceptible to heat-related illnesses include age (older adults and young children), obesity, fever, heart disease, mental illness, poor circulation, prescription drug and alcohol use, and sunburn.
Please refer to the following page for heat-related illness symptoms and first aid - https://www.weather.gov/safety/heat
HERE ARE SOME SAFETY TIPS TO BEST COPE WITH THE DANGERS OF HEAT:
Take Action, Be Prepared
The National Weather Service in Burlington, Vermont will issue Excessive Heat Watches, Heat Advisories or Excessive Heat Warnings when the Heat Index (Apparent Temperature) is expected to exceed 105°F for several hours or more. The Heat Index is a measure of how hot it really feels when relative humidity is factored in with the actual air temperature.

IMPORTANT: Since heat index values were devised for shady, light wind conditions, exposure to full sunshine can increase heat index values by up to 15°F. Also, strong winds, particularly with very hot, dry air, can be extremely hazardous.
The Heat Index Chart shaded zone above 105°F (orange or red) shows a level that may cause increasingly severe heat disorders with continued exposure or physical activity.
NWS BTV Heat Awareness Video
For more information and forecasts - visit us at http://www.weather.gov/btv/
Join us on Facebook - https://www.facebook.com/US.NationalWeatherService.Burlington.gov
Follow us on Twitter - https://twitter.com/NWSBurlington
Other links –
NY Health Department Heat Message - http://www.health.ny.gov/publications/1243.pdf
VT Department of Health - http://healthvermont.gov/
Centers for Disease Control and Prevention - https://www.cdc.gov/disasters/extremeheat/

Monday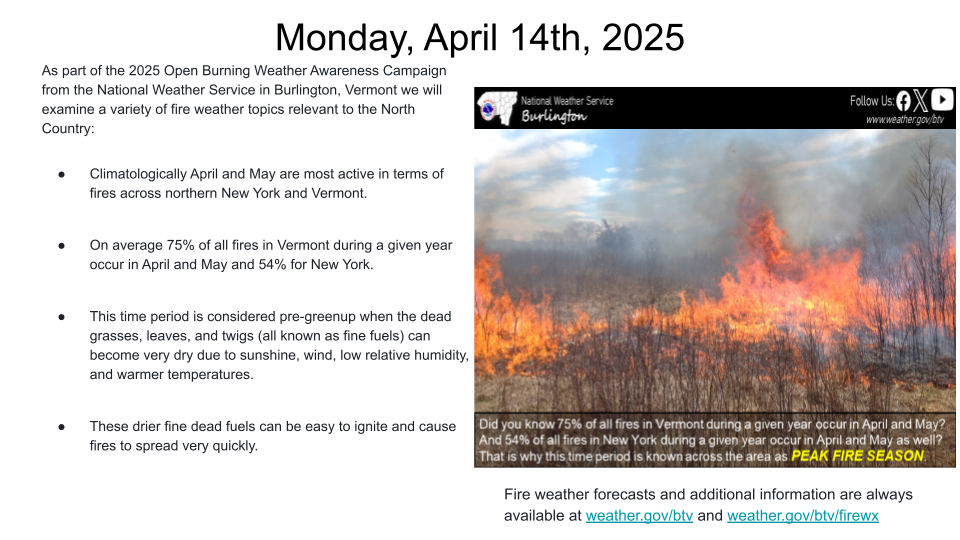 Peak fire season across the North Country |
Tuesday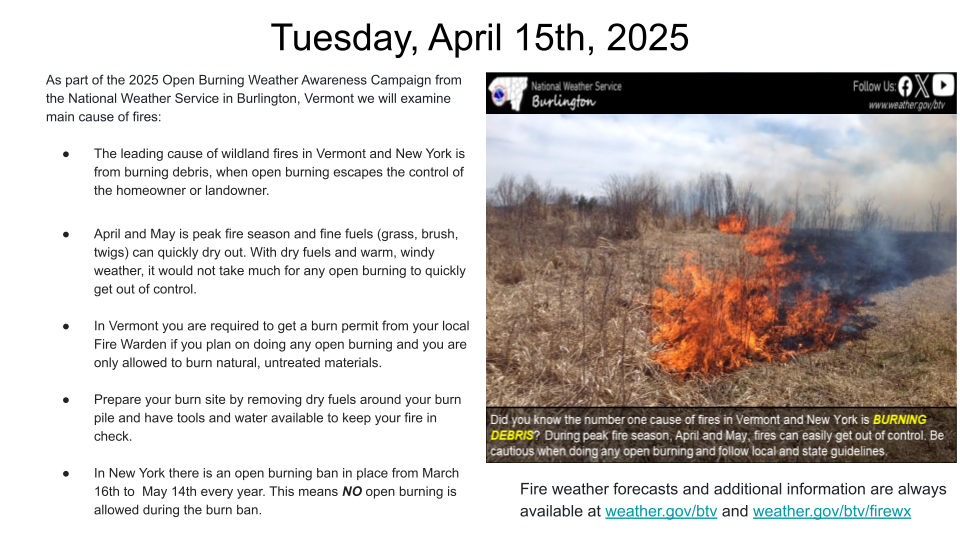 Main causes of fires across the North Country |
Wednesday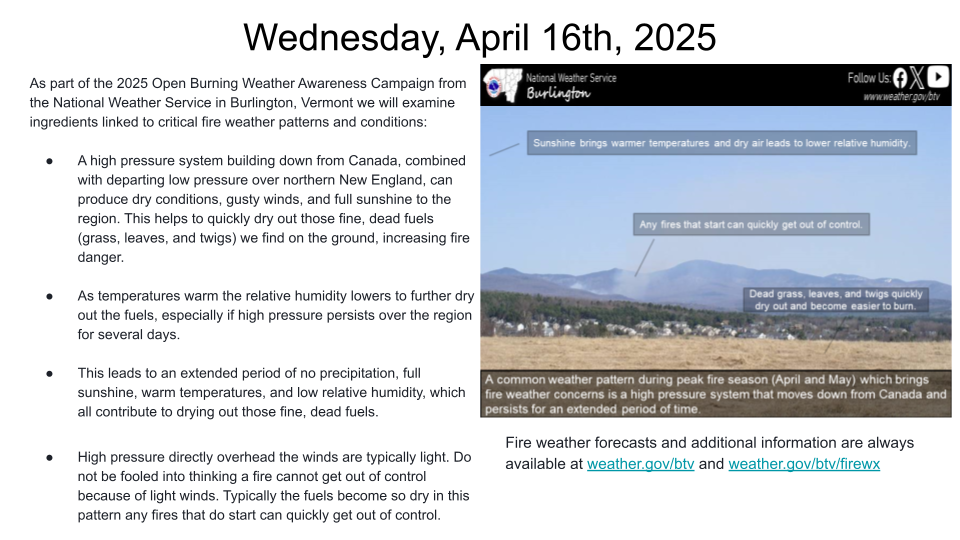 Ingredients linked to critical fire weather patterns and conditions |
Thursday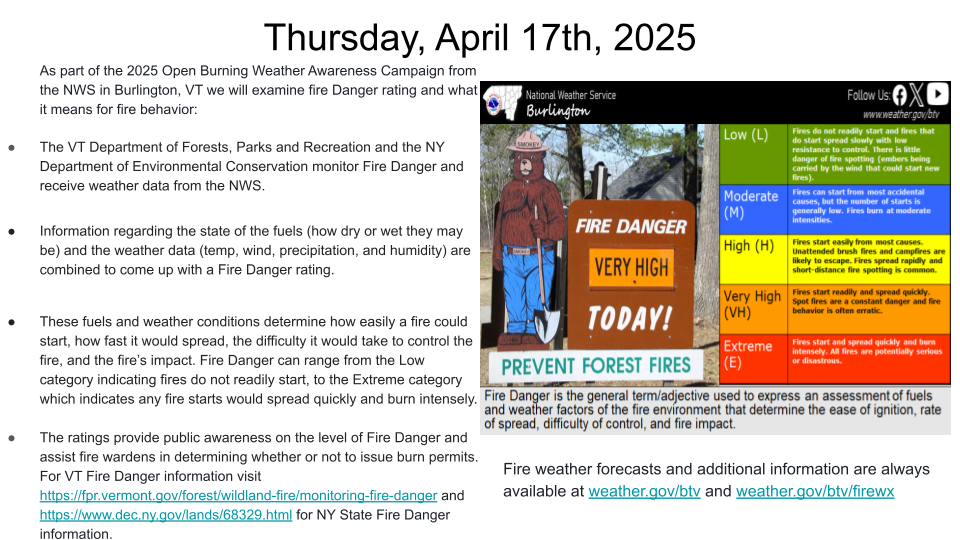 Fire Danger rating and what it means for fire behavior |
Friday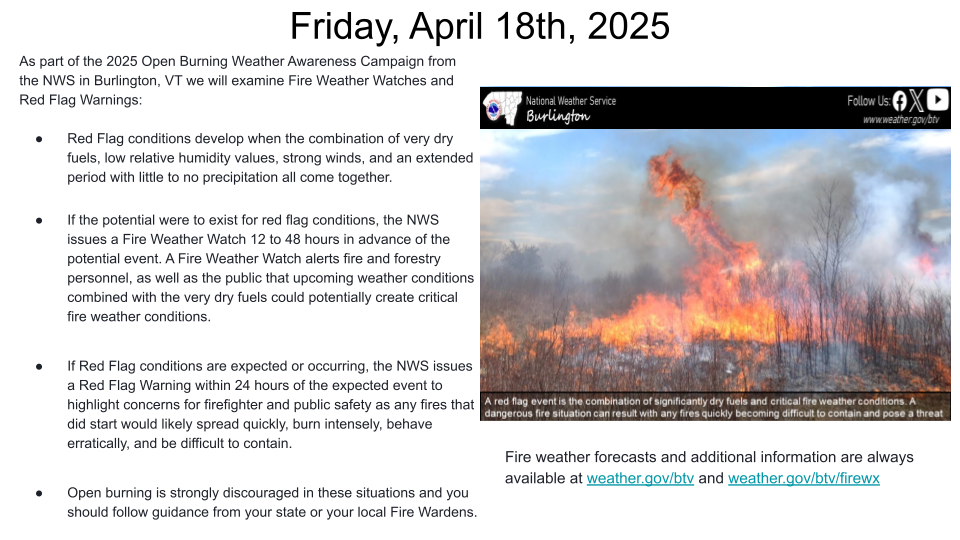 Fire Weather Watches and Red Flag Warnings |
Why is peak fire season April & May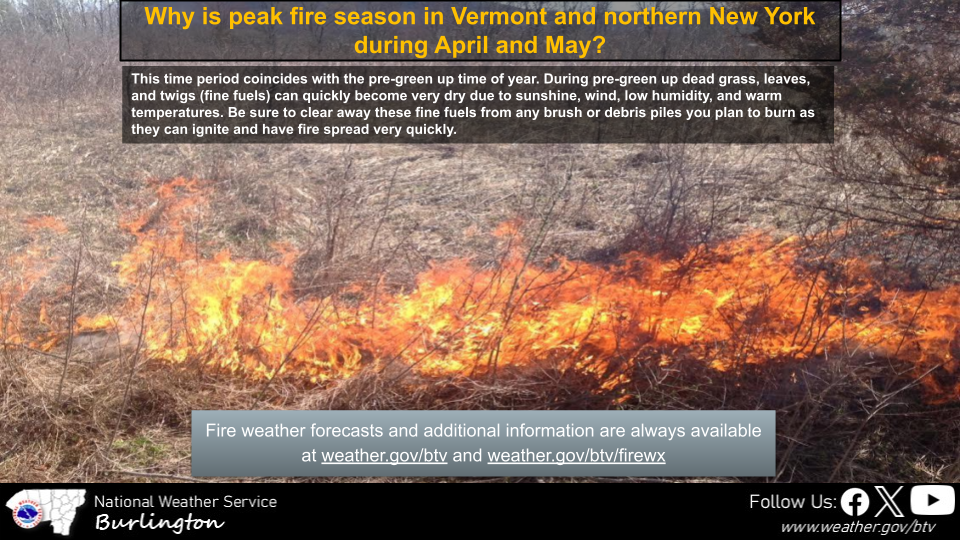 |
What is a red flag event |
Drought and Red Flag Review - 2025 |
2026 Spring Fire Weather Outlook |
Perry Basin Prescribed Burn |
Updates to Products and Services |
Rip Currents: Break The Grip of The Rip!®
For families that are planning a trip to the beach this summer, it is important to realize the dangers of rip currents before swimming in the ocean. The majority of rip current fatalities each year are visitors from non coastal locations. Rip currents are powerful currents of water moving away from shore and are the leading surf hazard for all beachgoers, especially for weak or non swimmers. According to the united states lifesaving association, 80 percent of surf beach rescues are attributed to rip currents and more than 100 people die annually from drowning when they are unable to escape a rip current. Rip currents form when waves break near the shoreline, piling up water between the breaking waves at the beach. One of the ways this water returns to sea is to form a rip current, a narrow jet of water that moves swiftly offshore, roughly perpendicular to the shoreline. Under most tide and sea conditions the speeds are relatively slow, however under certain wave, tide and beach profile conditions, The speeds can quickly increase to become dangerous to anyone entering the surf, Even the most experienced swimmers. Rip currents can be very narrow or extend in widths to hundreds of yards. The seaward pull of rip currents varies from just beyond the line of breaking waves to hundreds of yards offshore. Some of the clues beachgoers can use to identify rip currents including: a channel of churning, choppy water, an area having a notable difference in water color, A line of foam, seaweed or debris moving steadily seaward, or a break in the incoming wave pattern. The above clues may or may not indicate the presence of rip currents and rip currents are often not readily or easily identifiable to the average beachgoer. If you are concerned about the possibilities of rip currents occurring in the surf, it is best to ask an on duty lifeguard before entering the water. If you are caught in a rip current, remain calm to conserve energy and think clearly. Never fight against the current. Swim out of the current in a direction parallel to the shoreline. When out of the current, swim at an angle away from the current and toward the shore. If you are unable to swim out of the rip current, float or calmly tread water. When out of the current, swim toward shore. If you are unable to reach shore, draw attention to yourself by waving your arms and yelling for help. If you see someone in trouble, don't become a victim yourself, many people drown while trying to save someone else from a rip current. Get help from a lifeguard, or if one is unavailable, have someone call 9 1 1. Throw the rip current victim something that floats such as a life jacket, cooler or inflatable ball. Yell instructions on how to escape. It is important to note that under any conditions rip currents can occur and beachgoers should know how to swim and to heed the advice of beach patrol before entering the surf. For more information about rip currents, please visit www.ripcurrents.noaa.gov or if you are at the beach, ask a lifeguard. |
What Weather-Ready Looks Like: Beach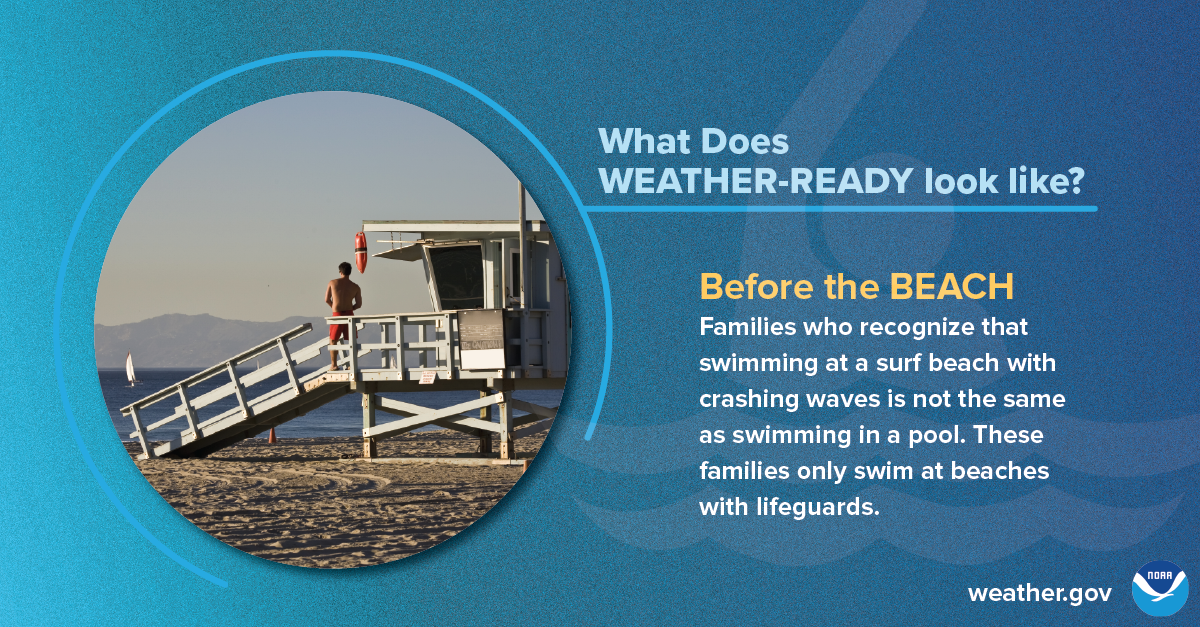 |
Shallow Water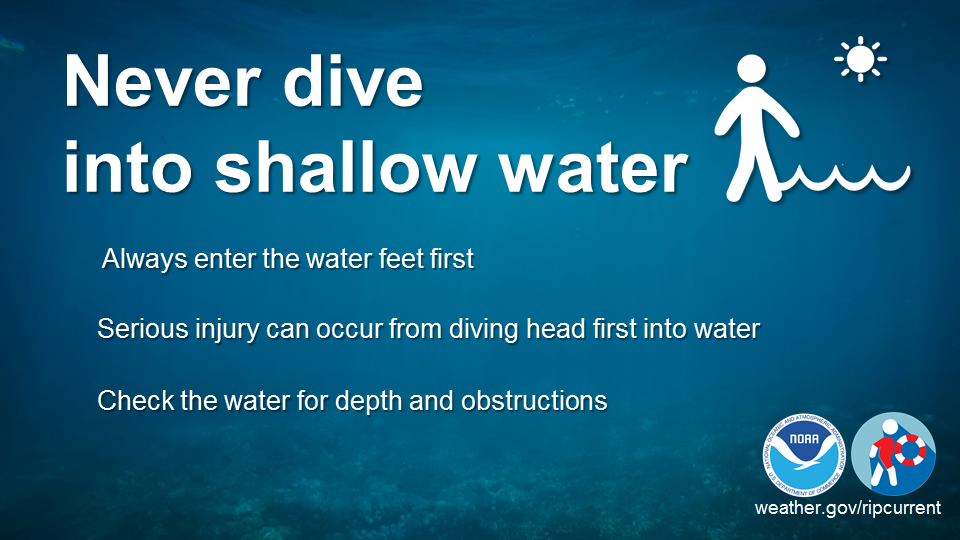 |
Wave Safe Video Series |
What are Rip Currents?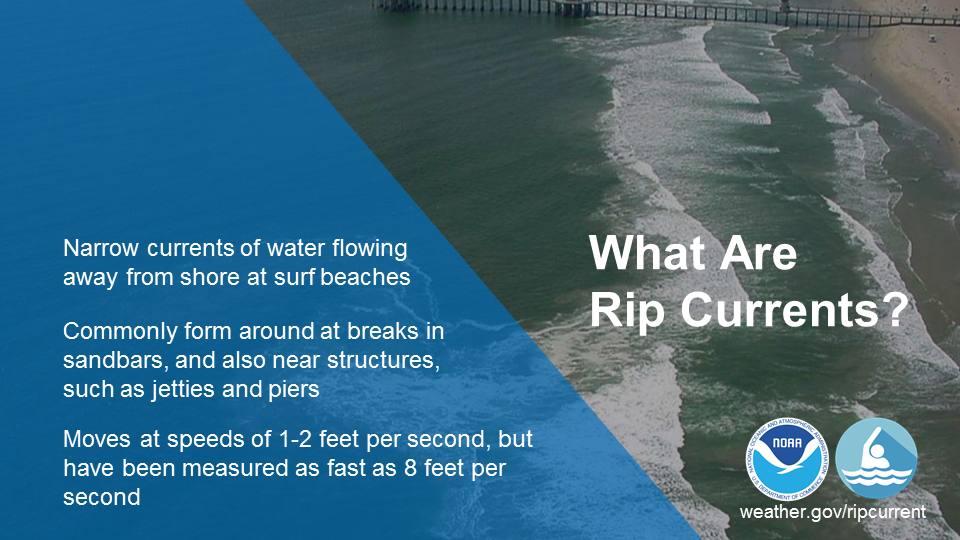 |
Break the Grip of the Rip!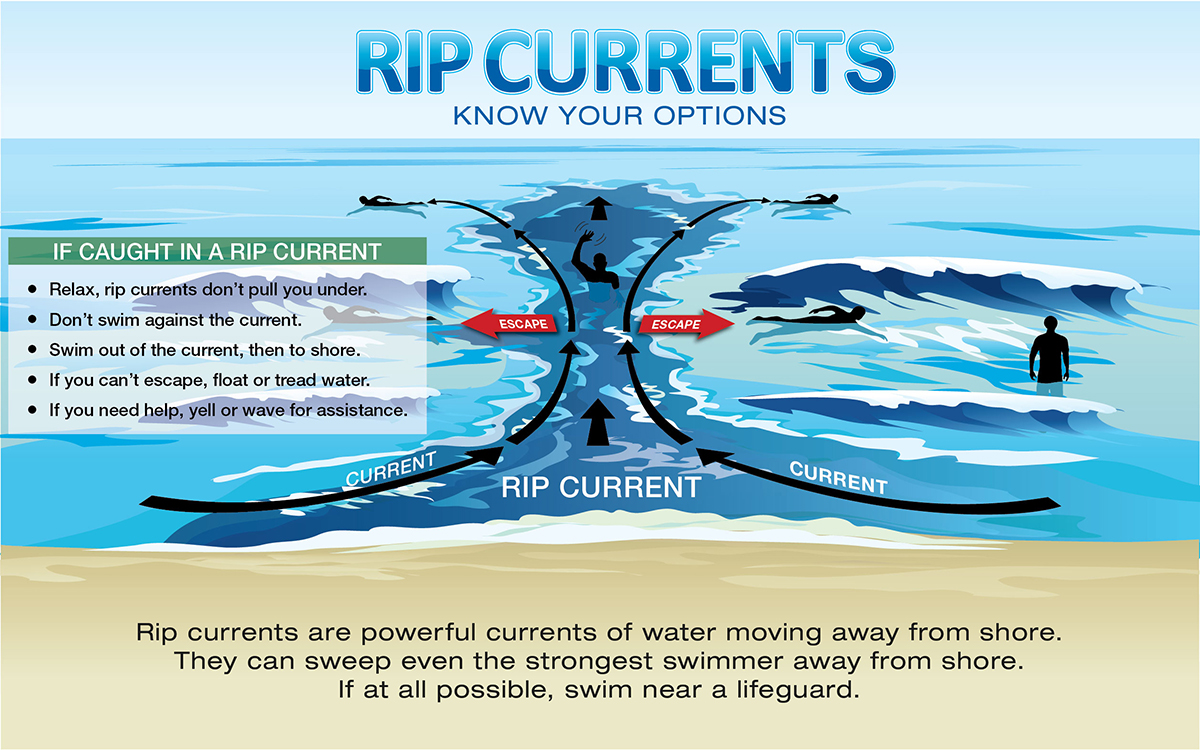 |
Survive a Rip Current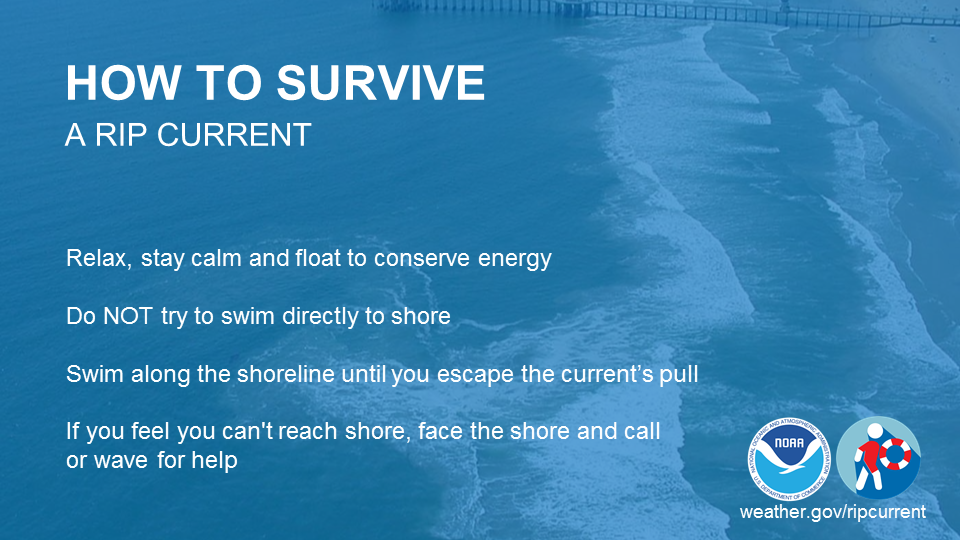 |
Beach Dangers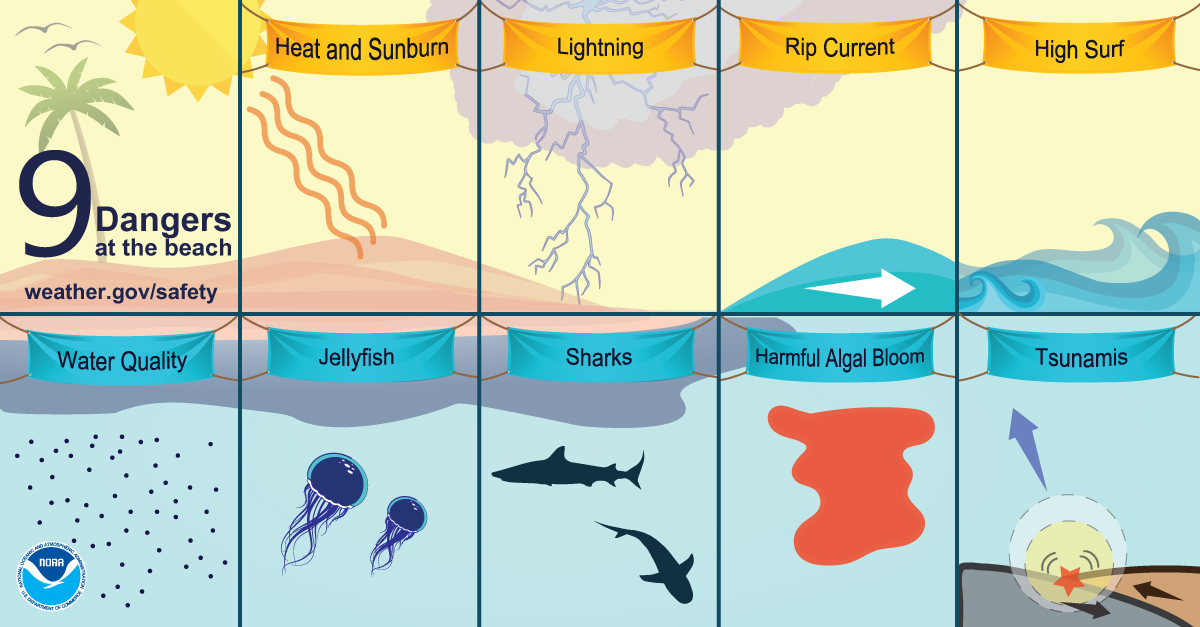 |
Stay Dry When Waves are High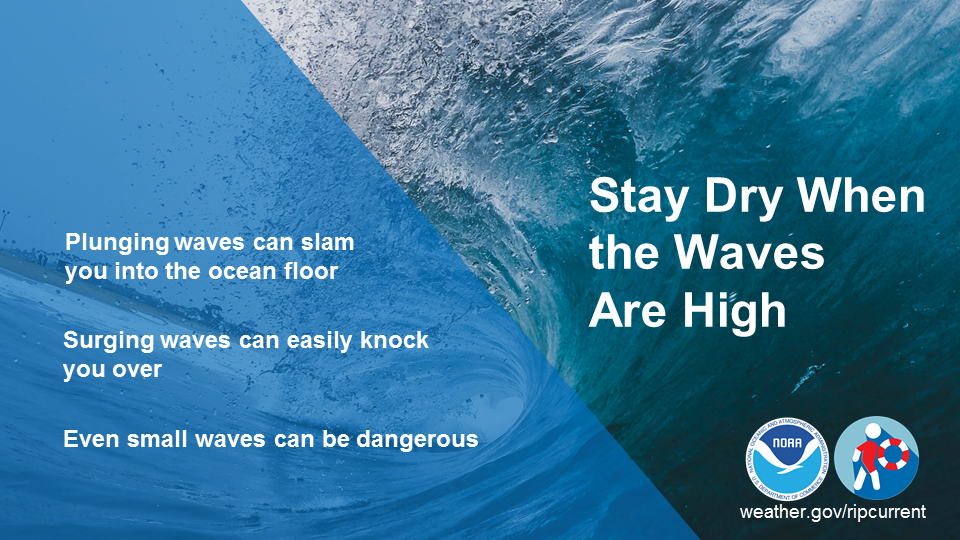 |
Survivor Story: Rip Current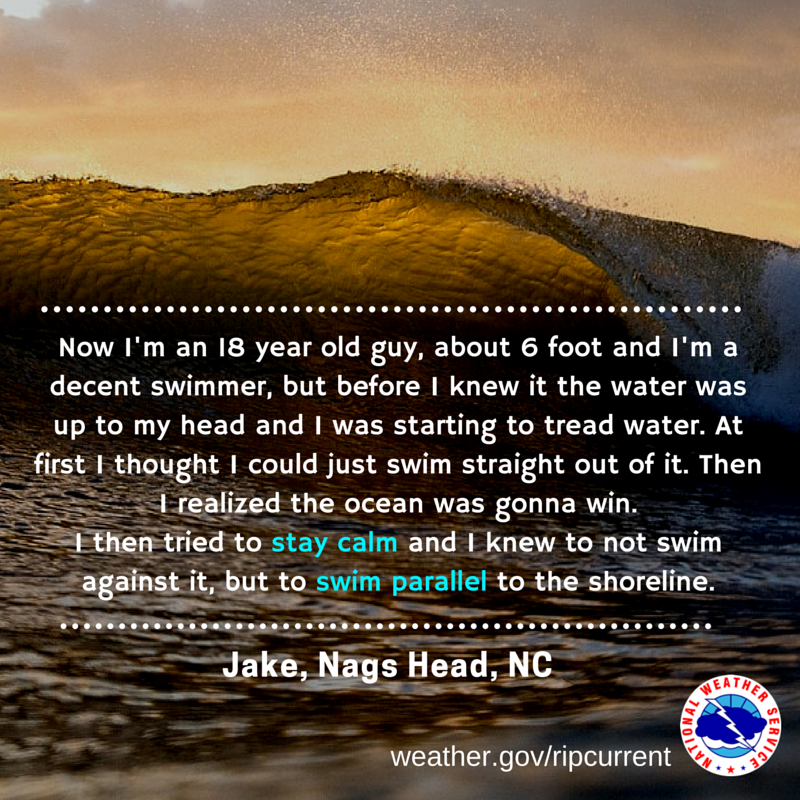 |
Only Swim at a Beach with Lifeguards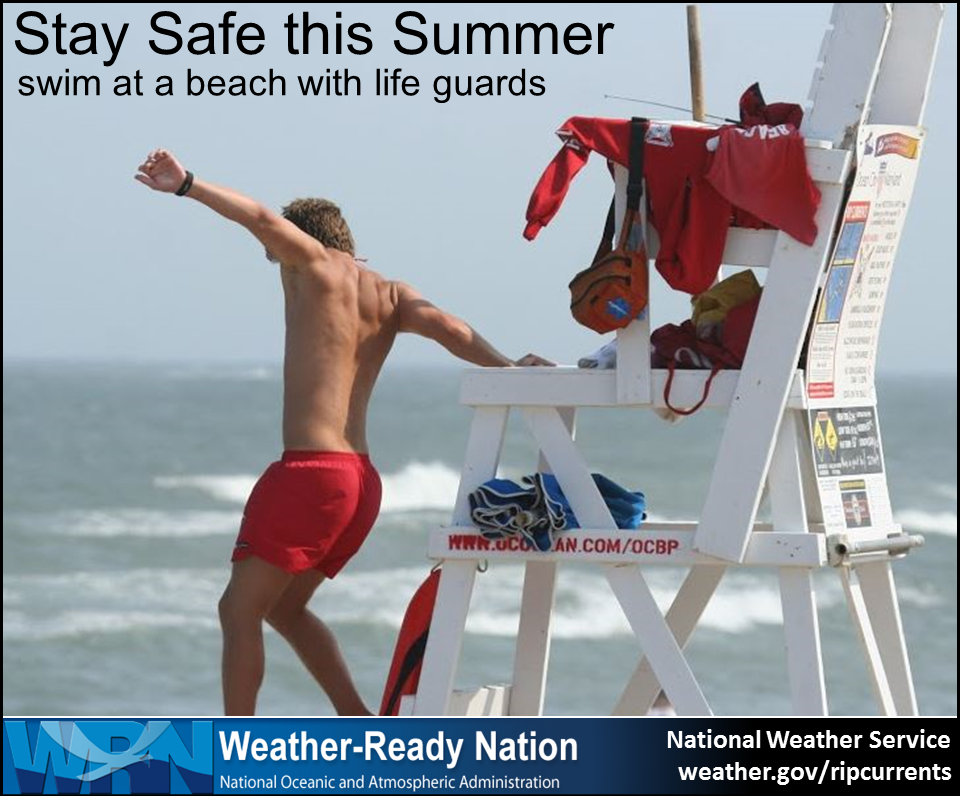 |
||
The National Weather Service and EPA have designated April 29 - May 3, 2019 as Air Quality Awareness Week in the United States. This week was established to remind persons of the importance air quality and air quality forecasts can play in their daily lives. This year's theme is Check the AQI and Get Outside!
There are two kinds of pollutants commonly found in our area. The first is ozone, which is formed when nitrogen oxides and volatile organic compounds are heated by the sun. As a result, ozone levels are usually highest in the summer. The second pollutant is particle pollution, which consists of microscopic particles in the air. Not only is particle pollution a problem in the summer, it is also found in the winter due to wood smoke from stoves and furnaces.
Ozone- and particle-forming pollutants come from a wide variety of sources, including cars, buses, power plants, and industries. Natural sources such as wildfires and dust storms contribute to particle pollution. Trees and other vegetation also emit organic compounds that contribute to particle and ozone pollution.
A perfect example of particle pollution occurred on Memorial Day 2010. Smoke from wildfires in Quebec spread south into Vermont and Northern New York resulting in poor air quality across much of the North Country. For a detailed explanation of the 2010 Memorial Day Smoke Out visit http://www.weather.gov/media/btv/events/31May2010.pdf
Weather plays a big role in the levels of ozone and particle pollution. Sunlight and heat promote ozone formation. Light winds and temperature inversions can keep pollution concentrated near the ground. The wind can bring in more pollution, sometimes from hundreds of miles away. Geography can affect pollution levels, too. Mountain ranges can prevent pollution from dispersing, with the pollutants settling in the surrounding valleys.
Exposure to high levels of ozone and particle pollution is linked with a number of significant health problems. Children, people with lung disease, older adults, and people with heart disease tend to be more vulnerable. When pollution reaches high enough levels, the air can be unhealthy for everyone, especially those who are active outdoors.
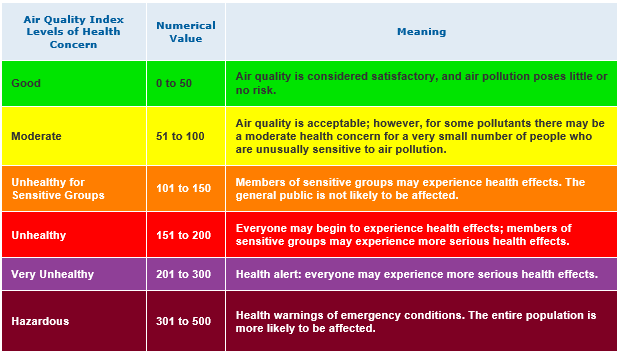
Use the Air Quality Index (AQI) and daily air quality forecasts to help you determine when pollutant levels are high and what steps you should take to protect yourself. The AQI is a color-coded scale that tells you who will be most affected by current or forecast pollution levels. Local air quality forecasts and the AQI can be found at www.airnow.gov and you can subscribe to the daily AQI forecast at www.enviroflash.info.
You can help reduce pollution by following these steps:
|
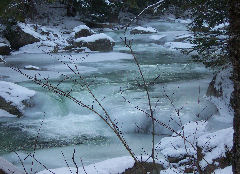
The National Weather Service (NWS) in Burlington, Vermont urges extreme caution when boating, canoeing, or kayaking during the spring, when water temperatures typically remain dangerously cold in the event of a capsize. After a long North Country winter, thoughts naturally turn toward warm weather recreational activities. The first warm days of spring often attract boaters and other recreational enthusiasts to the many beautiful lakes, rivers, and streams across Vermont and northern New York. Those venturing out on area lakes and rivers need to be aware of the dangers posed by cold water temperatures. On pleasantly warm and dry days in April and May, it is easy to overlook the fact that the temperature of the water is much slower to respond to the change of season and warms much more slowly than the air temperature. Rivers are often still affected by runoff from melting snow from mountain summits. Lakes continue to up-well cold water from below until a temperature of 39°F, and then increase in temperature slowly based on amount and days of sunshine, near surface air temperature, and the size of the body of water. On Lake Champlain, climate records indicate that surface water temperatures are typically in the upper 30s in late April, and only rise into the 40s during May. Immersion in cold water can become life threatening very quickly. Should your craft capsize, hypothermia in waters with temperatures in the upper 30s and 40s can occur in just a matter of minutes. Since water conducts body heat away up to 26 times faster than air of the same temperature, the cold water rapidly causes extremities to become numb, weakening the ability of muscles to work effectively. Tragically, several individuals have lost their lives on North Country rivers and lakes in recent years, drowning in the very low water temperatures of early May. The NWS urges the following safety measures to protect yourself and maximize your enjoyment of area waterways:
Remember, no matter the season, when you are on the water, always wear your life jacket. Safe boating is no accident! Please take the time to think safety first and plan appropriately for weather and water conditions before heading out on lakes, rivers, and streams. Supplemental Links: |