On 18 July 2022 a long track rotating low top shower produced two tornado touchdowns across Addison County, Vermont (VT), which caused property damage and uprooted or snapped off multiple trees. Figure 1 below shows the preliminary damage survey results (click here for text product) from the National Weather Service (NWS) in Burlington, VT. Based on damage and tornado videos, it was determined two touchdowns occurred. The first, an EF-1, occurred around 6:50 PM near the intersection of Route 17 and 22A in the town of Addison. Meanwhile, the second, a brief EF-0, touched down approximately 2 miles west-northwest (WNW) of Waltham, VT near the Otter Creek basin around 6:55 PM. The pre-storm environment featured a warm and very moist tropical air mass across the Champlain Valley, while a subtle warm front was lifting from south to north over the central Champlain Valley into parts of central VT. The atmosphere presented limited instability as temperatures were in the upper 60s to lower 70s, due to plenty of clouds and areas of showers, resulting in this low top tornadic shower having no lightning and a very weak reflectivity structure. The lack of significant vertical reflectivity and no lightning provided storm and associated tornadic identification challenges for NWS forecasters.
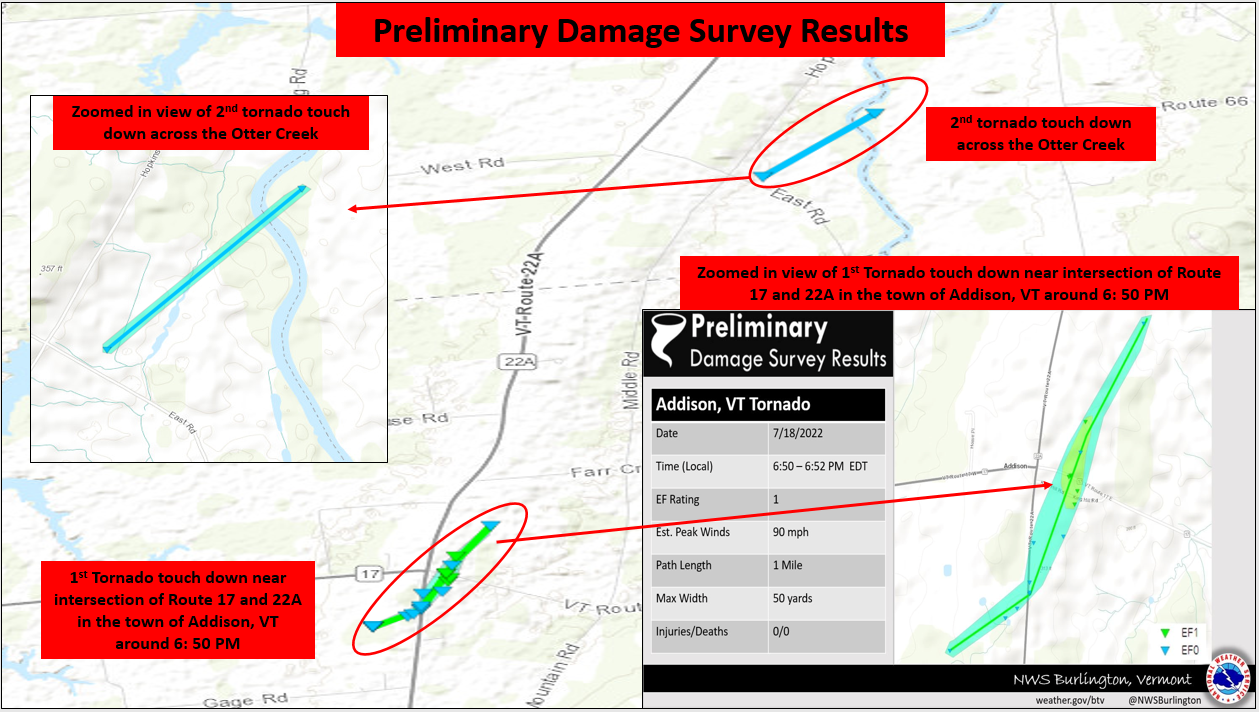
Figure 1: Preliminary damage survey results highlighting tornado path near four corners intersection of Route 17 and 22A in the town of Addison, VT on 18 July 2022.[click to enlarge]
The rotating shower started near Schroon Lake, New York (NY) in south-central Essex County around 5:30 PM on July 18th and tracked northeast into central-northeastern Addison County, VT before weakening by 7:30 PM across southeast Chittenden County. Image 2 below shows the Multiple Sensor Multiple Radar (MRMS) 0 to 2 km maximum azimuthal shear (rotational track) from 5:30 to 7:30 PM on July 18th. The Warning Decision Training Division (WDTD) defines maximum azimuthal shear as rotation divided by diameter; s-1 in the low-level (0–2 km). This MRMS product provides a history of the intensity and spatial coverage of storm circulations that may be associated with mesocyclones or tornadoes and can be utilized to determine if a storm has intensified or dissipated over time. From the image below, the yellow and red colors within the low level rotational track indicate stronger rotation, with values in the 0.01 to 0.020 s-1 range. In addition, the azimuthal shear tracks have shown enormous effectiveness after events for guidance in directing damage survey teams, especially with well sampled and long tracked tornadic events.
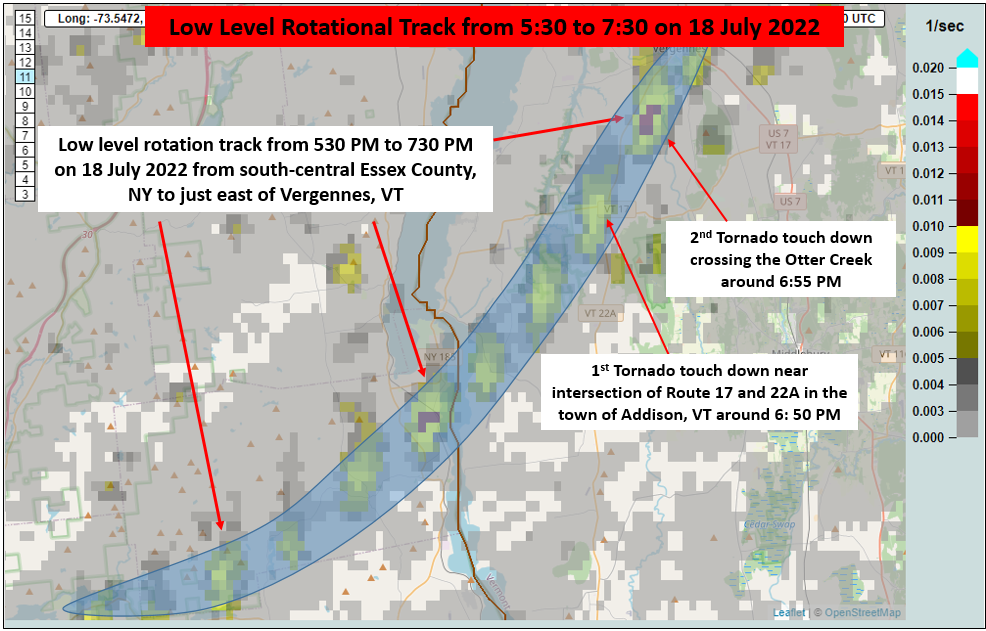
Figure 2: Multiple Sensor Multiple Radar (MRMS) 0 to 2 km low level rotational track from 5:30 PM to 7:30 PM on 18 July 2022.[click to enlarge]
The surface analysis at 5 PM on July 18th indicated 1003mb low pressure entering the southern Saint Lawrence Valley with a warm front extending from low pressure across the High Peaks into central-southern VT. The warm front was lifting from south to north across the region and was the leading edge of slightly better instability with CAPE values increasing to 500 J/kg over the southern Champlain Valley. In addition, this feature helped produce the necessary shear or turning of the winds with height to create conditions favorable for rotating showers and potential tornadoes. Surface winds ahead of this boundary were from the southeast with temperatures in the lower 70s, while behind this front winds shifted to the south-southwest with temperatures warming into the mid/upper 70s. It should be noted a very tropical-like air mass was advecting into the North Country with this warm front, as surface dewpoints were climbing into the lower 70s with precipitable water values exceeding 2.0 inches.
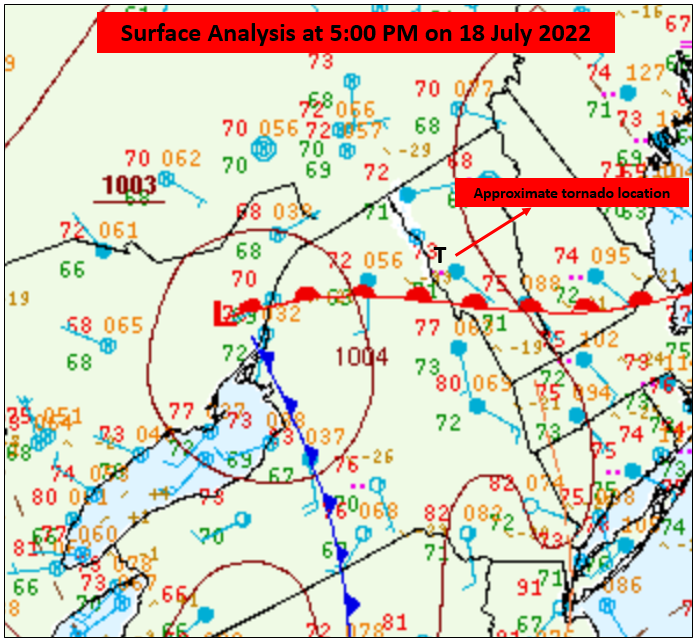
Figure 3: The Weather Prediction Center (WPC) surface analysis at 5:00 PM on 18 July 2022.[click to enlarge]
Figure 4 below shows the Storm Prediction Center (SPC) Rapid Refresh (RAP) model of 0 to 1 km Storm Relative Helicity (SRH) (left) and Lifted Condensation Level (LCL) at 5:00 PM on 18 July 2022. The 0 to 1 km SRH is enhanced in the vicinity of the surface warm front and co-located within an axis of lower LCLs. From SPC 0 to 1 km SRH is a measure of the potential for cyclonic updraft rotation in right-moving supercells, and is calculated for the lowest 1-km above ground level. Larger values of 0-1-km SRH (greater than 100 m²/s², however, do suggest an increased threat of tornadoes with supercells. For SRH, larger values are generally better, but there are no clear thresholds between non-tornadic and significant tornadic supercells. In this event, 0 to 1 km SRH values were up to 150 m²/s² near the tornado locations in central Addison, County.
Meanwhile, from SPC the LCL (Lifting Condensation Level) is the level at which a parcel becomes saturated. It is a reasonable estimate of cloud base height when parcels experience forced ascent. The axis of lower LCL heights across the central Champlain Valley were a result of lift provided by the warm front and created lowering cloud bases favorable for potential tornadoes to occur. LCL heights were generally around 500 meters above ground level.
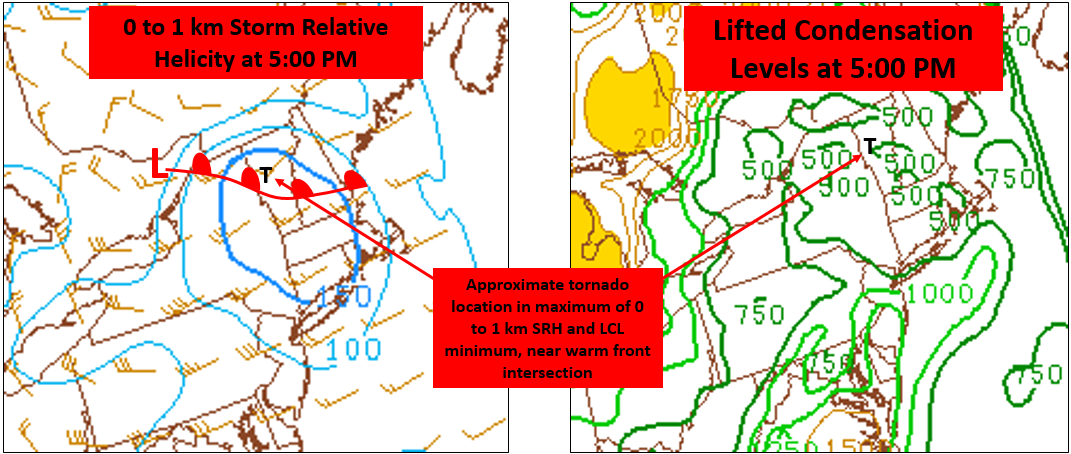
Figure 4: The Storm Prediction Center Rapid Refresh Model of 0 to 1 km storm relative helicity (m²/s²) and storm motion (brown wind barbs in knots)(left) and lifted condensation level in meters above ground level (right) at 5:00 PM on 18 July 2022.[click to enlarge]
The next discussion item will be the pre-storm environmental conditions, to determine if thermodynamic and wind profiles were favorable for tornadoes. Figure 5 below is the BTV 4km model sounding and hodograph initialized at 8 AM on 18 July 2022 for 5 PM at Burlington, VT. The sounding indicated very low LCL heights with potential cloud bases around 2,000 feet above ground level (AGL), especially as the warm front and associated precipitation developed, while wind profiles were veering from southeast at the surface to southwest between 2,500 and 3,000 feet (AGL). A veering wind profile (turning clockwise with height) indicates warm-air advection, which can destabilize the atmosphere. Furthermore, the 10 to 20 knots southeast winds in the boundary layer veering to the southwest at 35 to 40 knots at 4,000 feet (AGL) created large cyclonically curved hodograph, with 0 to 3 km helicity values > 400 m²/s², supporting rotating updrafts and potential tornadoes. Larger values of 0-3 km SRH (greater than 250 m2 s-2), suggest an increased threat of tornadoes. Instability within the 0 to 3 km layer was very minimal with values of CAPE < 200 J/kg and explains why only showers occurred with no lightning.
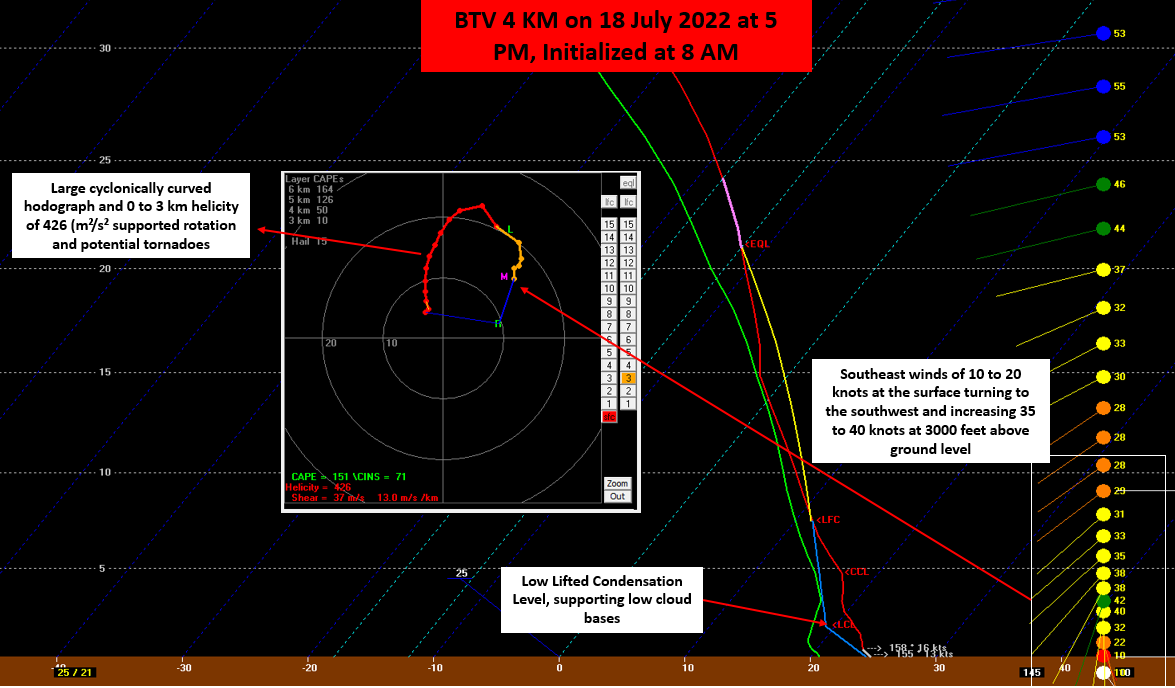
Figure 5: BTV 4km model initialized at 8 AM on 18 July 2022 and hodograph (insert) at Burlington, Vermont.[click to enlarge]
The next image below shows KCXX 0.5° Storm Relative Motion (SRM) (left) at 6:50 PM and a photo of a tornado (right) near Addison in Addison County, Vermont on 18 July 2022. The SRM radar product is very useful for investigating small scale circulations “mesocyclones” in thunderstorms and sometimes these small scale circulations are areas where tornadoes form. What separates storm relative motion from base velocity is the motion of storms are "subtracted" from the overall flow of the wind. As storms move, their own motion can mask circulations within themselves. This motion is removed to make the view of the wind relative to the storm. In effect, what is seen is the wind's motion as if the storms were stationary. The green inbound velocities indicate wind speeds of 35 to 40 knots, while red outbound winds are 20 to 25 knots, creating a favorable total rotation (Vin + Vout) of 55 to 65 knots and rotational velocity (Vr= [Vin + Vout]/2) of 30 knots at 6:50 PM near the 1st tornado touch down in Addison, VT. Typically gate to gate rotational velocity of 45 knots or greater within 30 nautical miles of the radar is considered favorable for tornadic formation. The image on the left below clearly shows a tornado and associated debris from trees being picked up by the EF-1 tornado near Addison, VT. The tornado picture was captured from video taken by Levi Barrett.
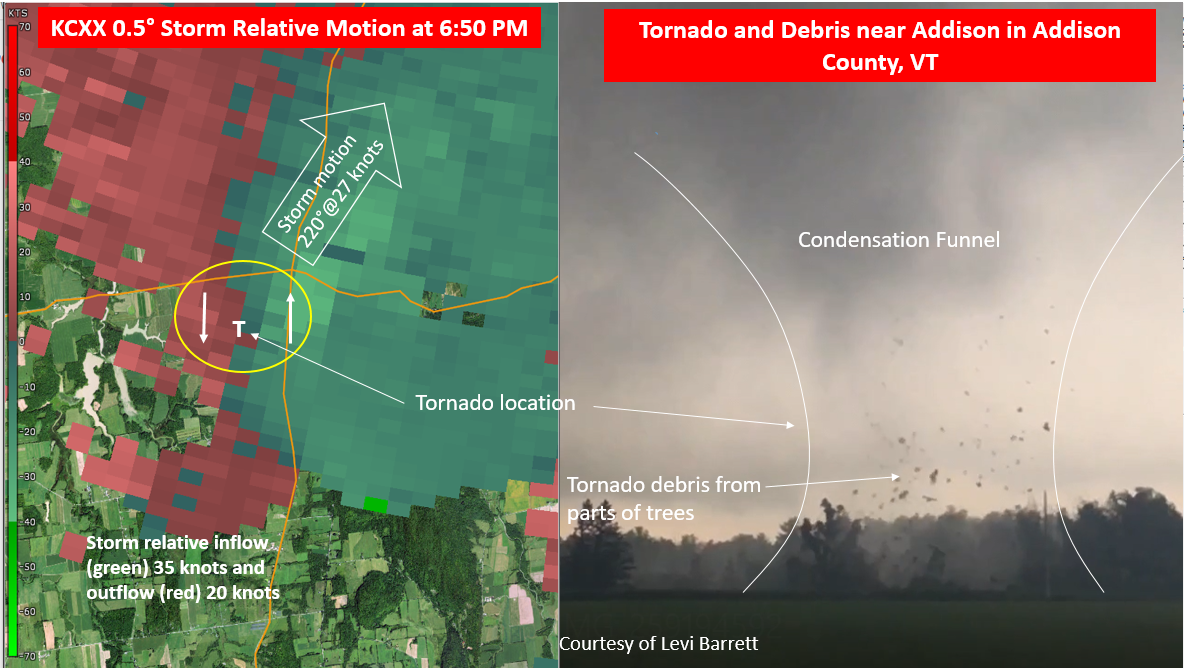
Figure 6: KCXX 0.5° Storm Relative Motion (SRM) (left) at 6:50 PM and photo of tornado (right) near Addison in Addison County, Vermont on 18 July 2022.[click to enlarge]
The next image below shows the same SRM product as above, but next to the KCXX 0.5° base reflectivity at 6:50 PM on July 18th. The overall reflectivity structure of this shower is very weak, however there is a weak reflectivity appendage on the southern flanks, with some enhanced returns of 40 to 45 dBZ. These enhanced reflectivity returns could be a result of debris, such as pieces of trees being lofted into the air by the tornado. The stronger 50 to 60 dBZ returns associated with localized heavy rainfall was displaced well north of the apparent tornadic circulation, creating a difficult detection for forecasters at WFO BTV.
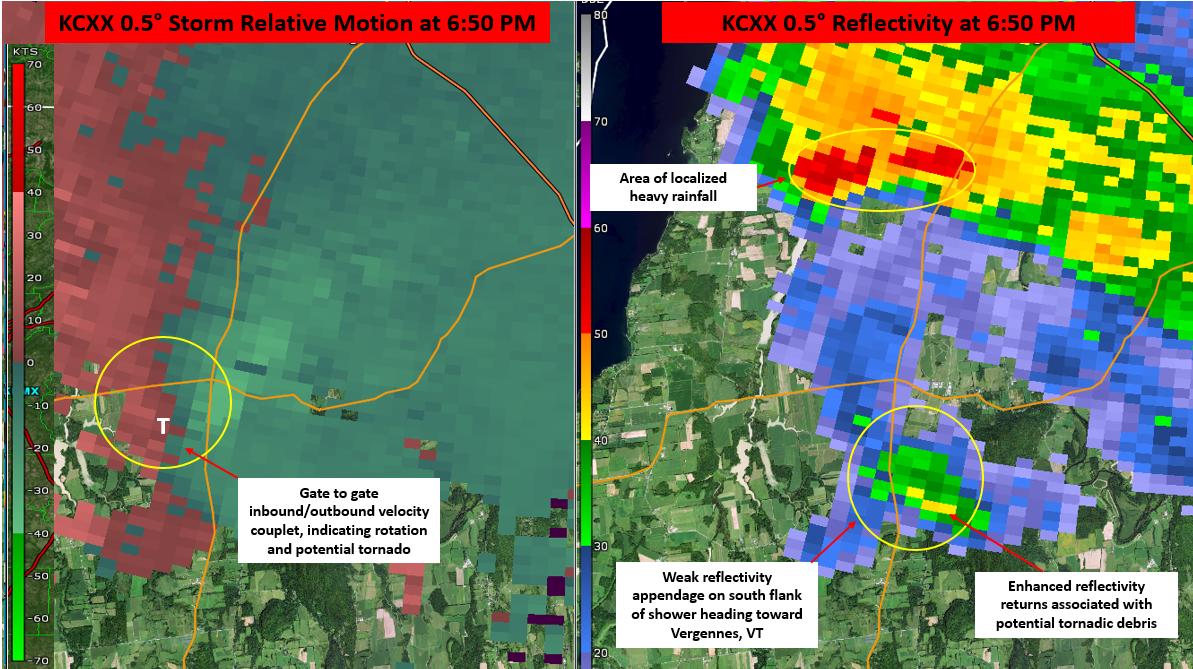
Figure 7: KCXX 0.5° Storm Relative Motion (SRM) (left) and 0.5 reflectivity (Z) (right) near Addison in Addison County, Vermont on 18 July 2022 at 6:50 PM.[click to enlarge]
The final image below shows the KCXX 0.5° SRM (left) at 6:55 PM and photo of tornado (right) by Chas Eller located approximately 2 miles WNW of Waltham, VT between Addison and Vergennes in Addison County, Vermont on 18 July 2022. The SRM continues to show gate to gate rotation with inbound (green color) winds of up to 40 knots, while outbound (red color) of 30 knots. Radar indicated the circulation had increased slightly prior to the last scan at 6:50 PM, while crossing the Otter Creek Basin. The tornado picture was captured from video taken by Chas Eller and confirms an EF-0 tornado with the condensation funnel was reaching the ground at this time.
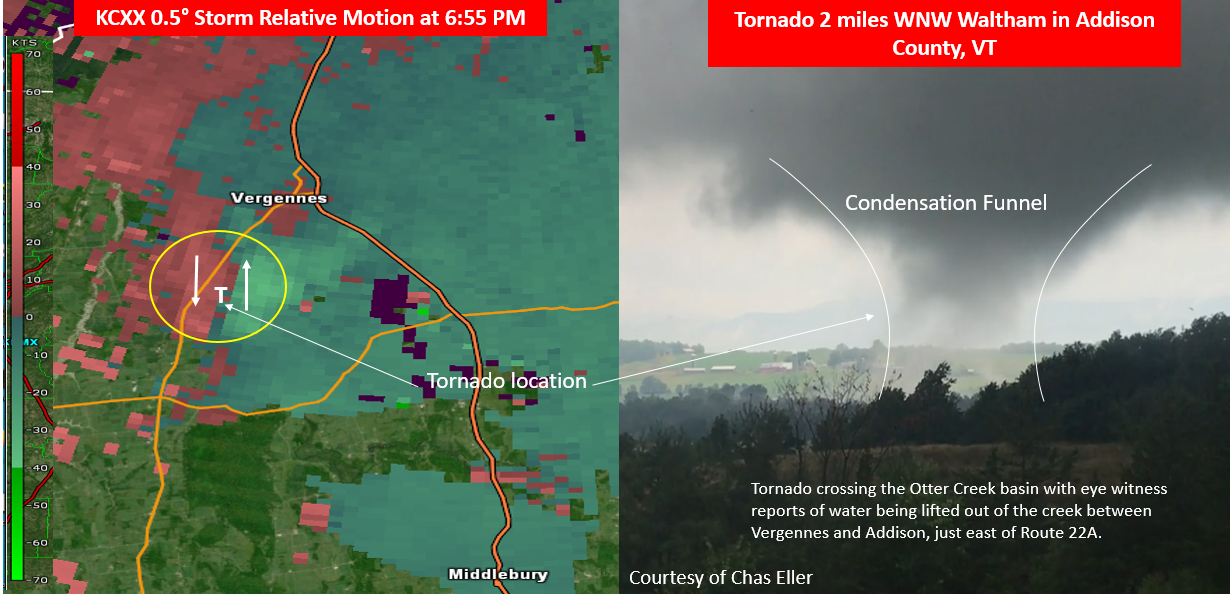
Figure 8: KCXX 0.5° Storm Relative Motion (SRM) (left) at 6:55 PM and photo of tornado (right) between Addison and Vergennes in Addison County, Vermont on 18 July 2022.[click to enlarge]
This event featured two tornado touchdowns from the same shower across Addison County, VT on 18 July 2022. The first touchdown occurred around 6:50 PM near the town of Addison and was rated an EF-1 with peak winds of 90 mph, based on the NWS damage survey. The second touchdown occurred at 6:55 PM about 2 miles WNW of Waltham, VT with a rating of EF-0 and winds of 70 mph, based on video received by the NWS WFO in Burlington. The tornadoes caused property damage in the town of Addison, along with uprooting or snapping off several trees in its path. The path length of the Addison tornado was 1 mile long and up to 50 yards wide, while the 2nd tornado was 0.7 miles long and 25 yards wide. The pre-storm atmosphere indicated wind profiles were favorable for rotating updrafts and potential tornadoes, but the lack of instability limited the convective development and created a difficult environment for forecasters to identify showers that had the potential to produce a tornado.
References and Other Material:
Click here for a KCXX 0.5 reflectivity and storm relative motion loop from 6:02 PM to 7:20 PM on 18 July 2022.
Click here for tornado video courtesy of Levi Barrett near town of Addison in Addison County, VT.
Click here for tornado video courtesy of Chas Eller for the second touchdown near Waltham in Addison County, VT.
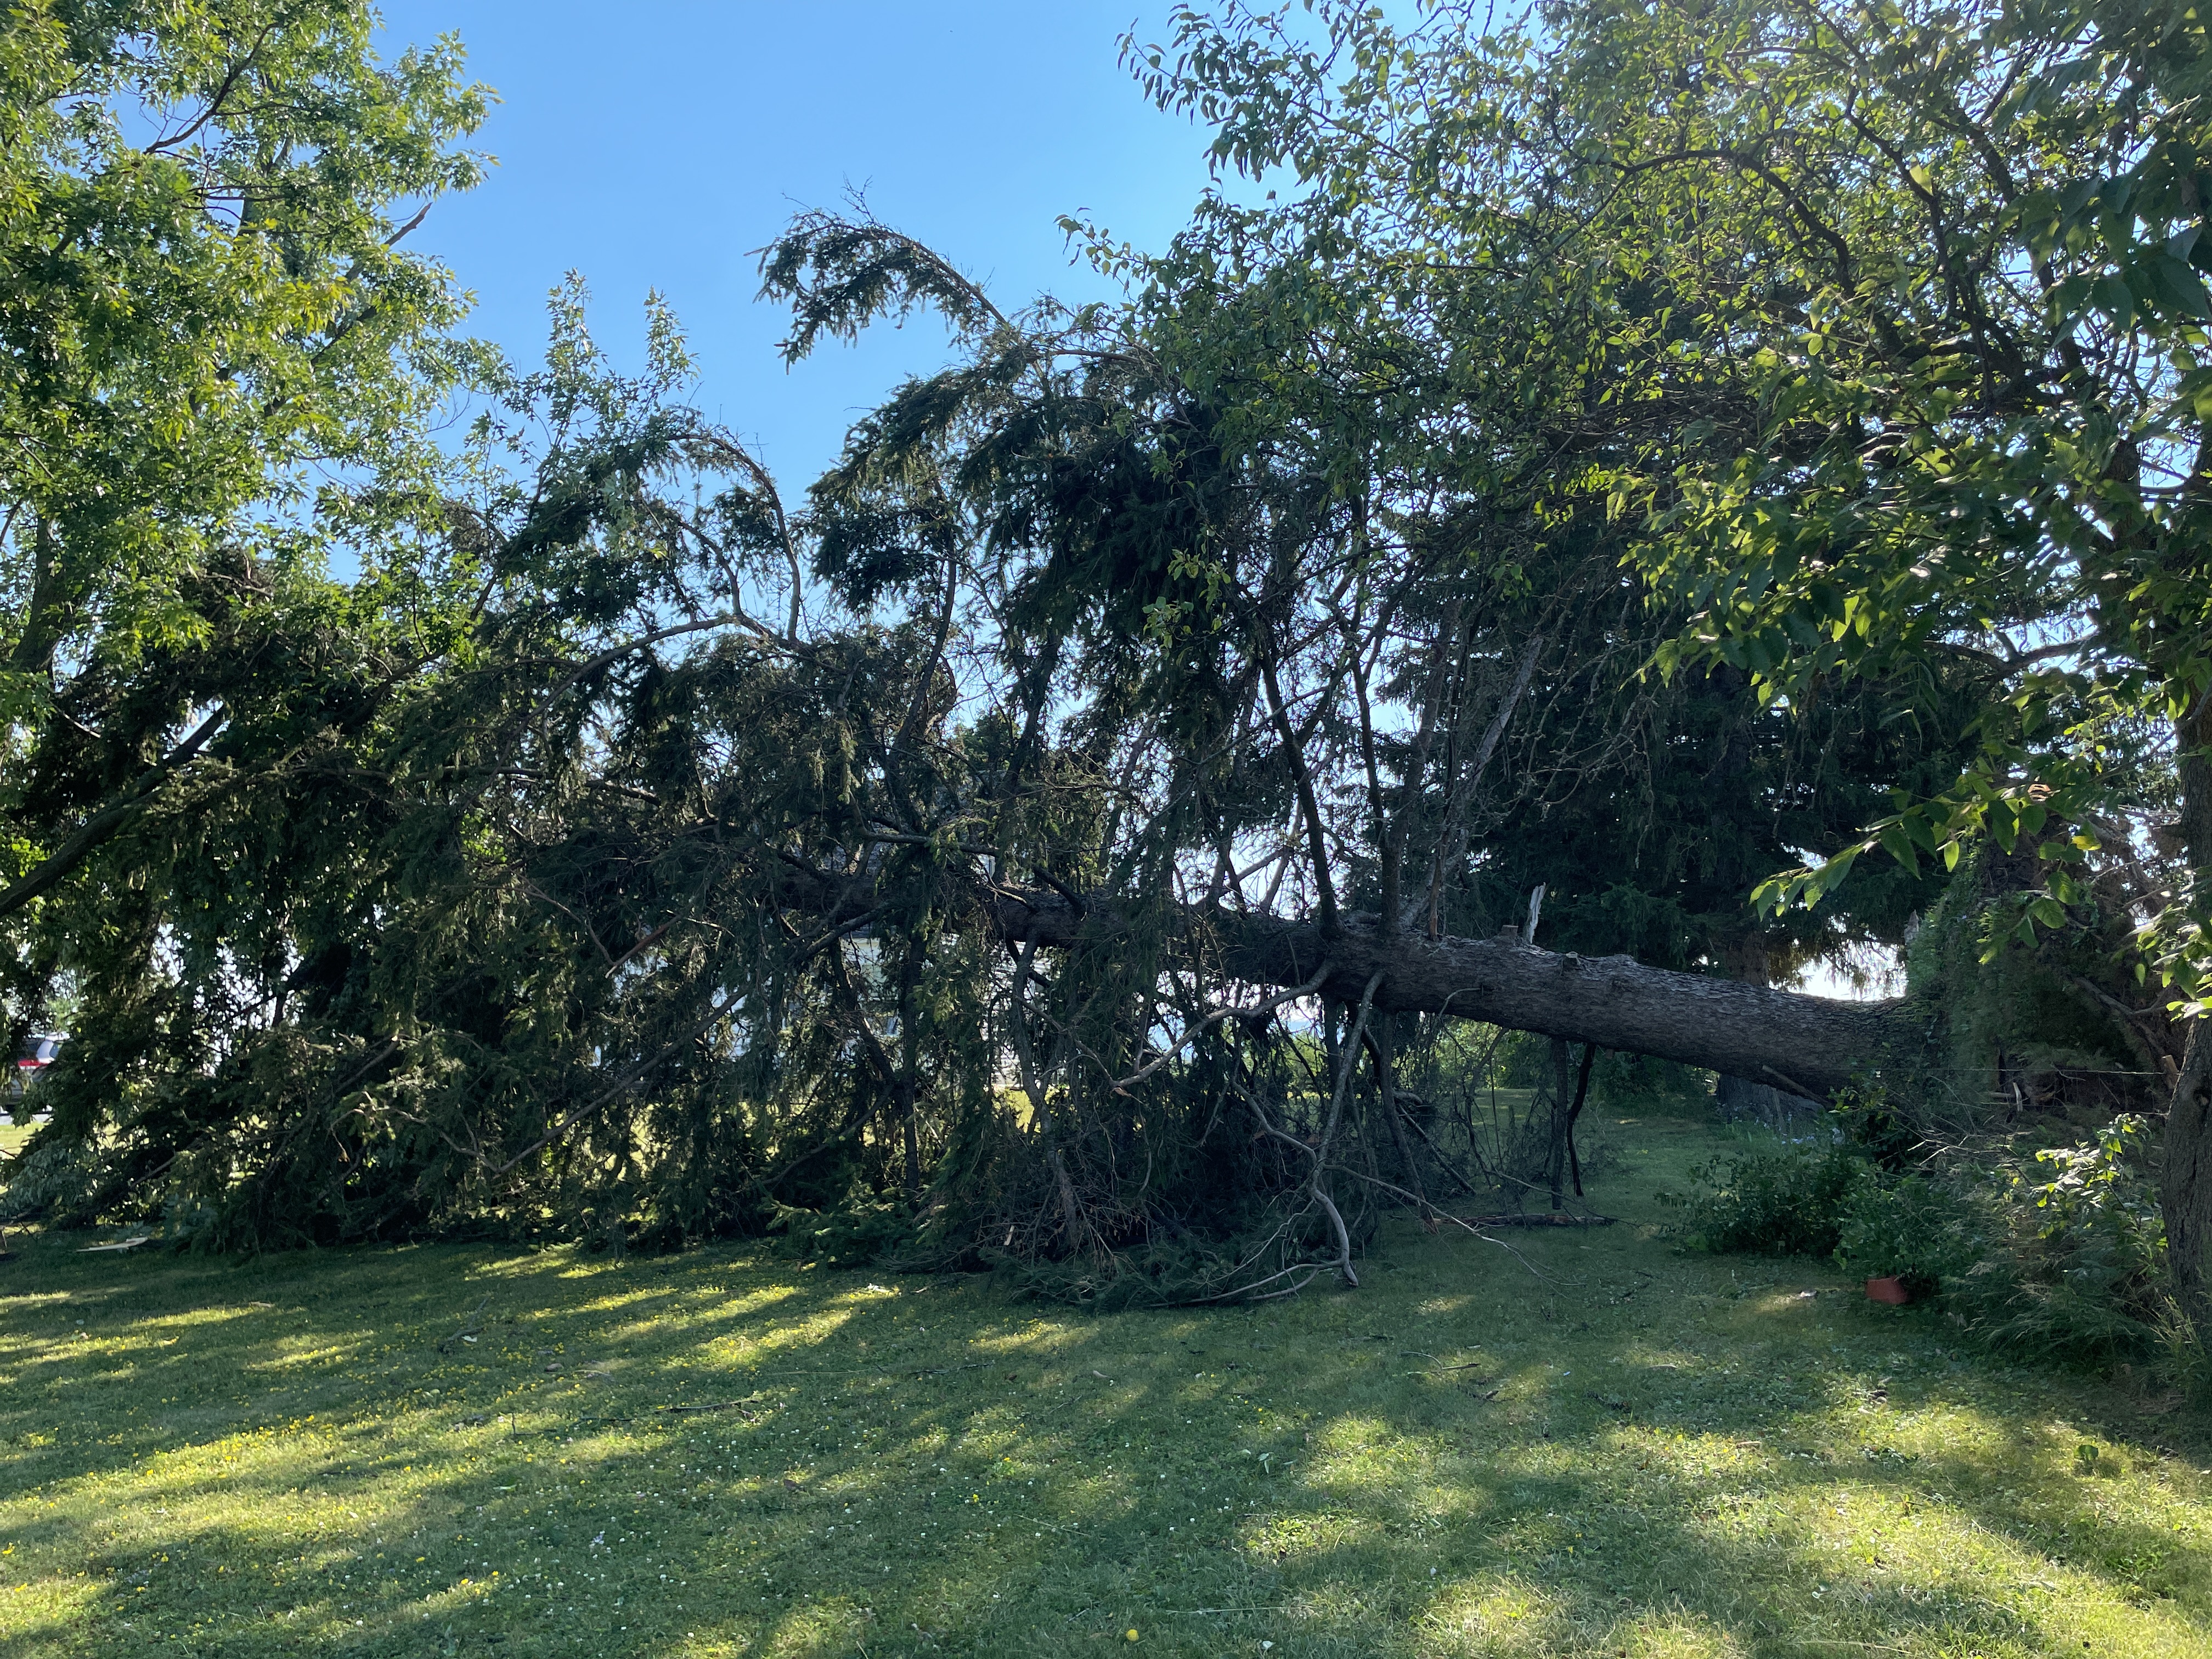
Click here to see an NWS Burlington survey photo of an uprooted used to help assess tornado intensity.
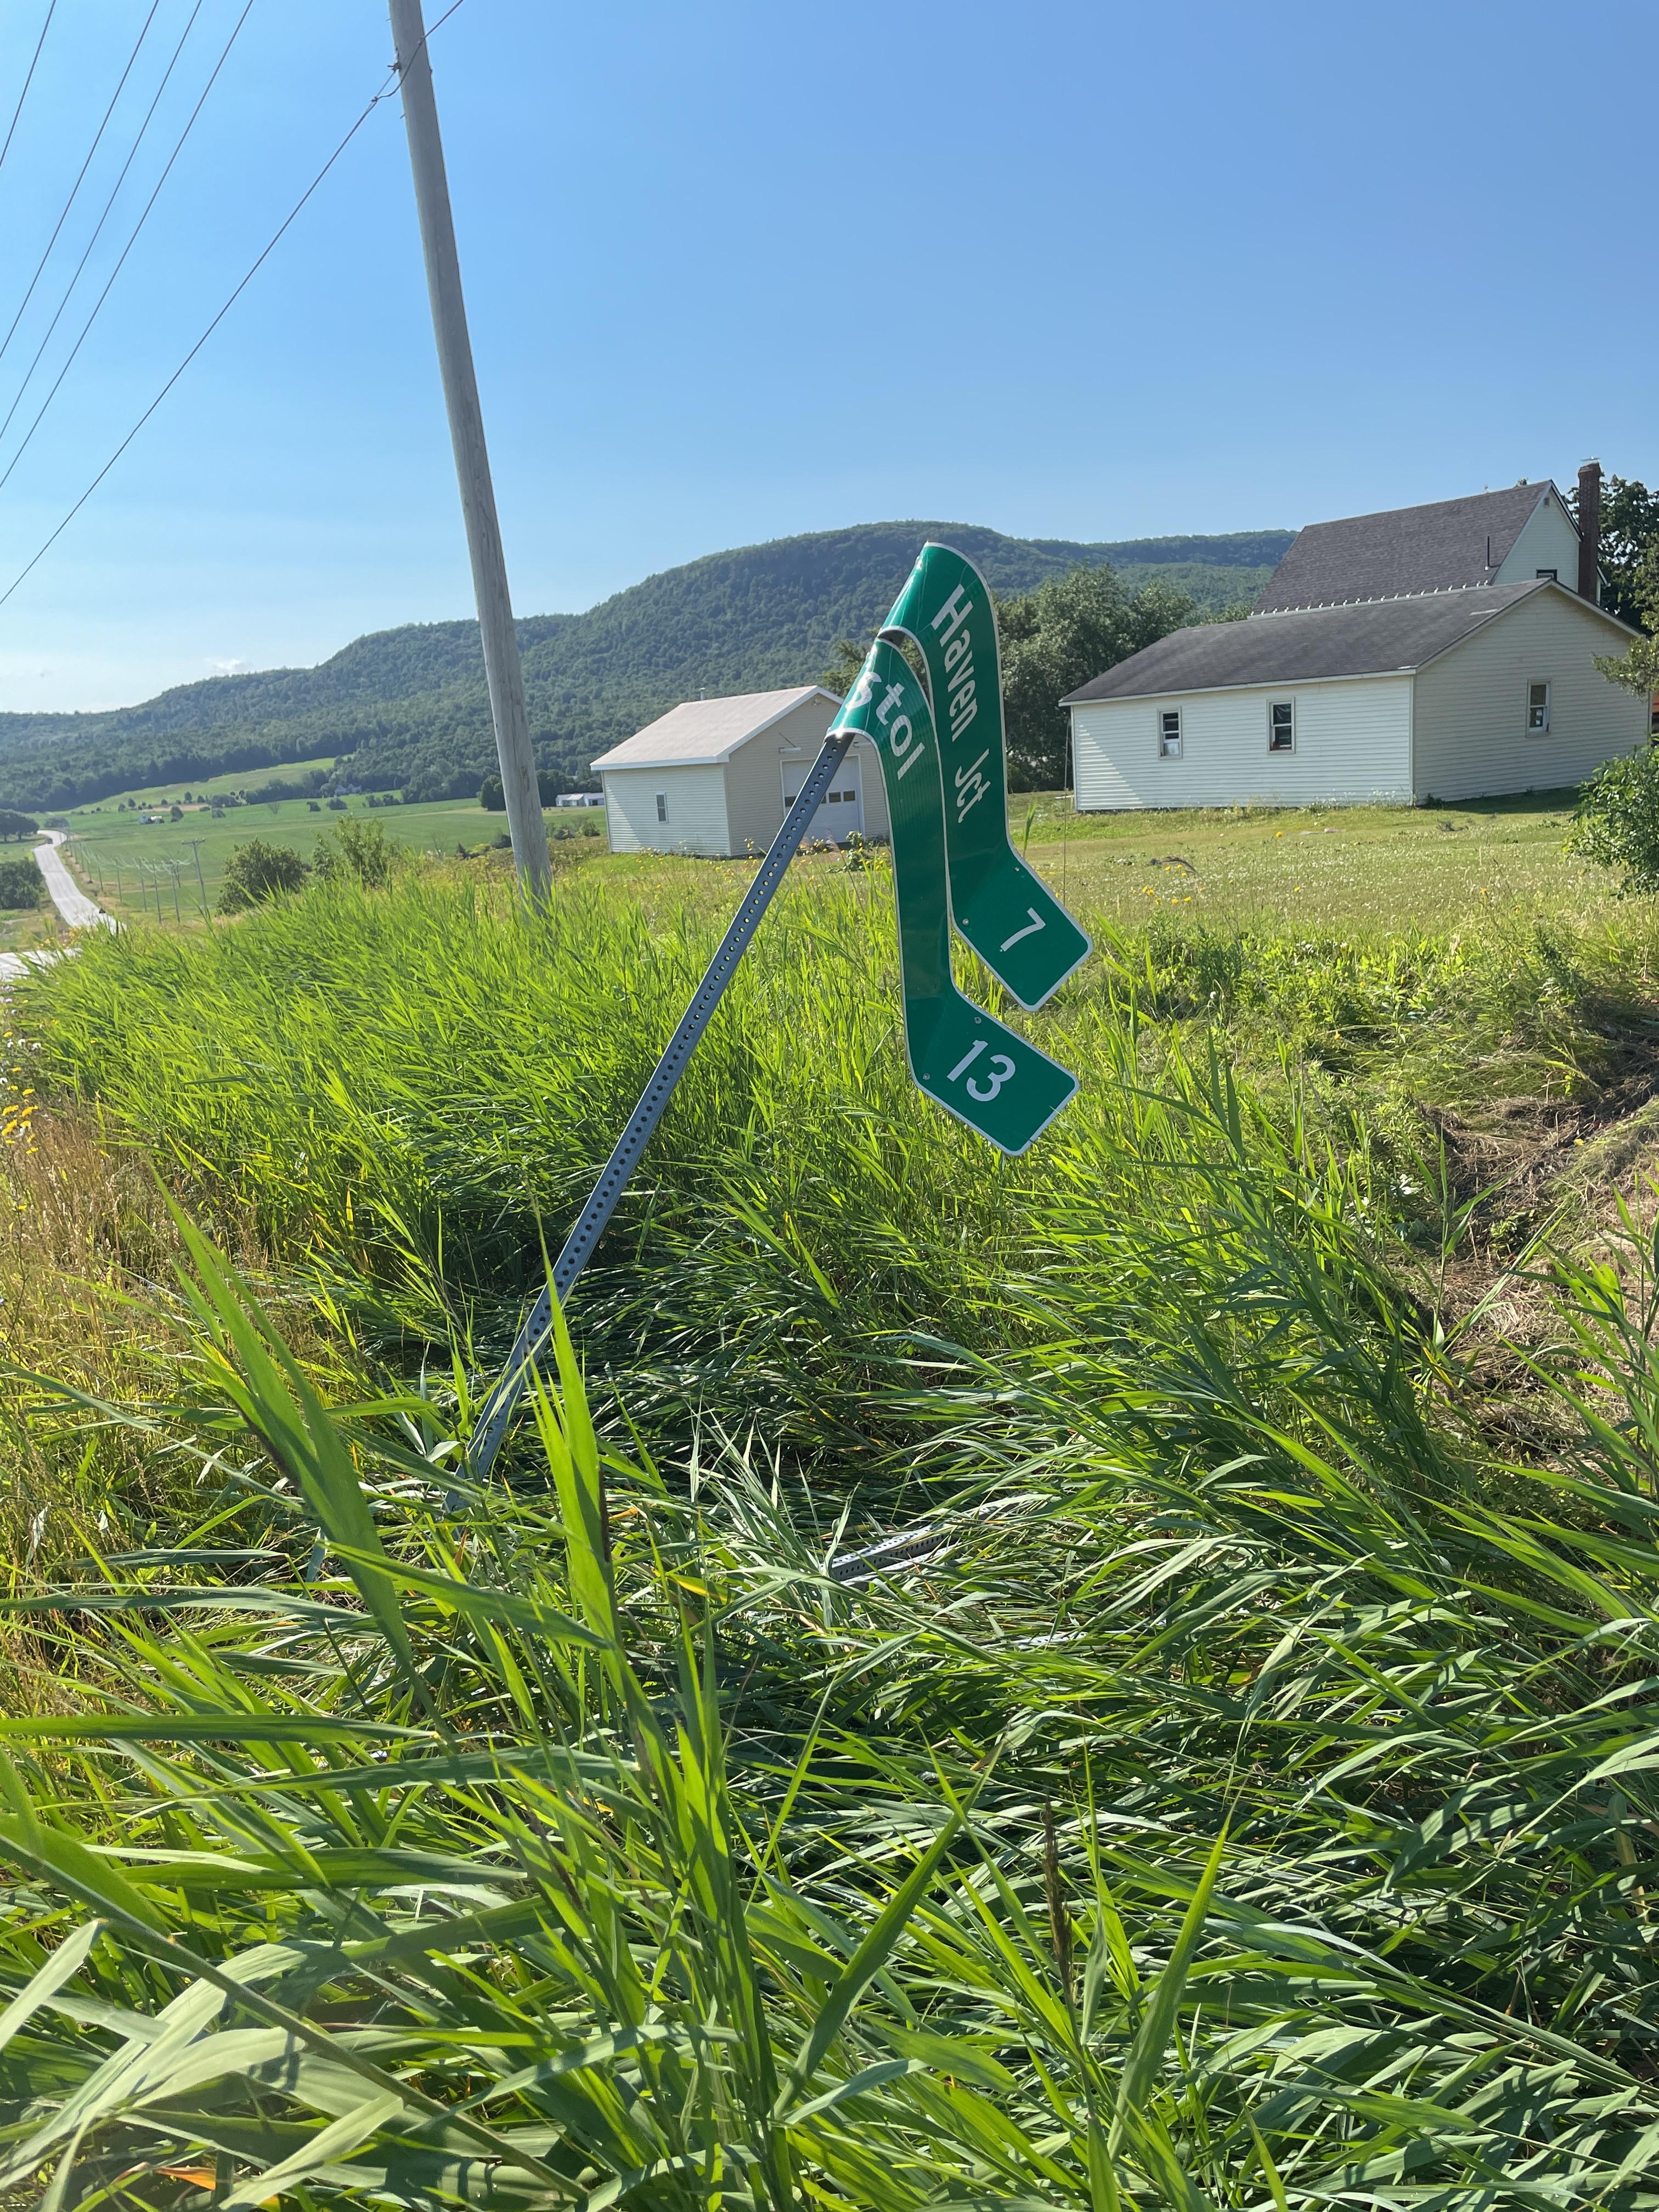
Click here to see an NWS Burlington survey photo of the twisted road sign used to help assess tornado intensity.
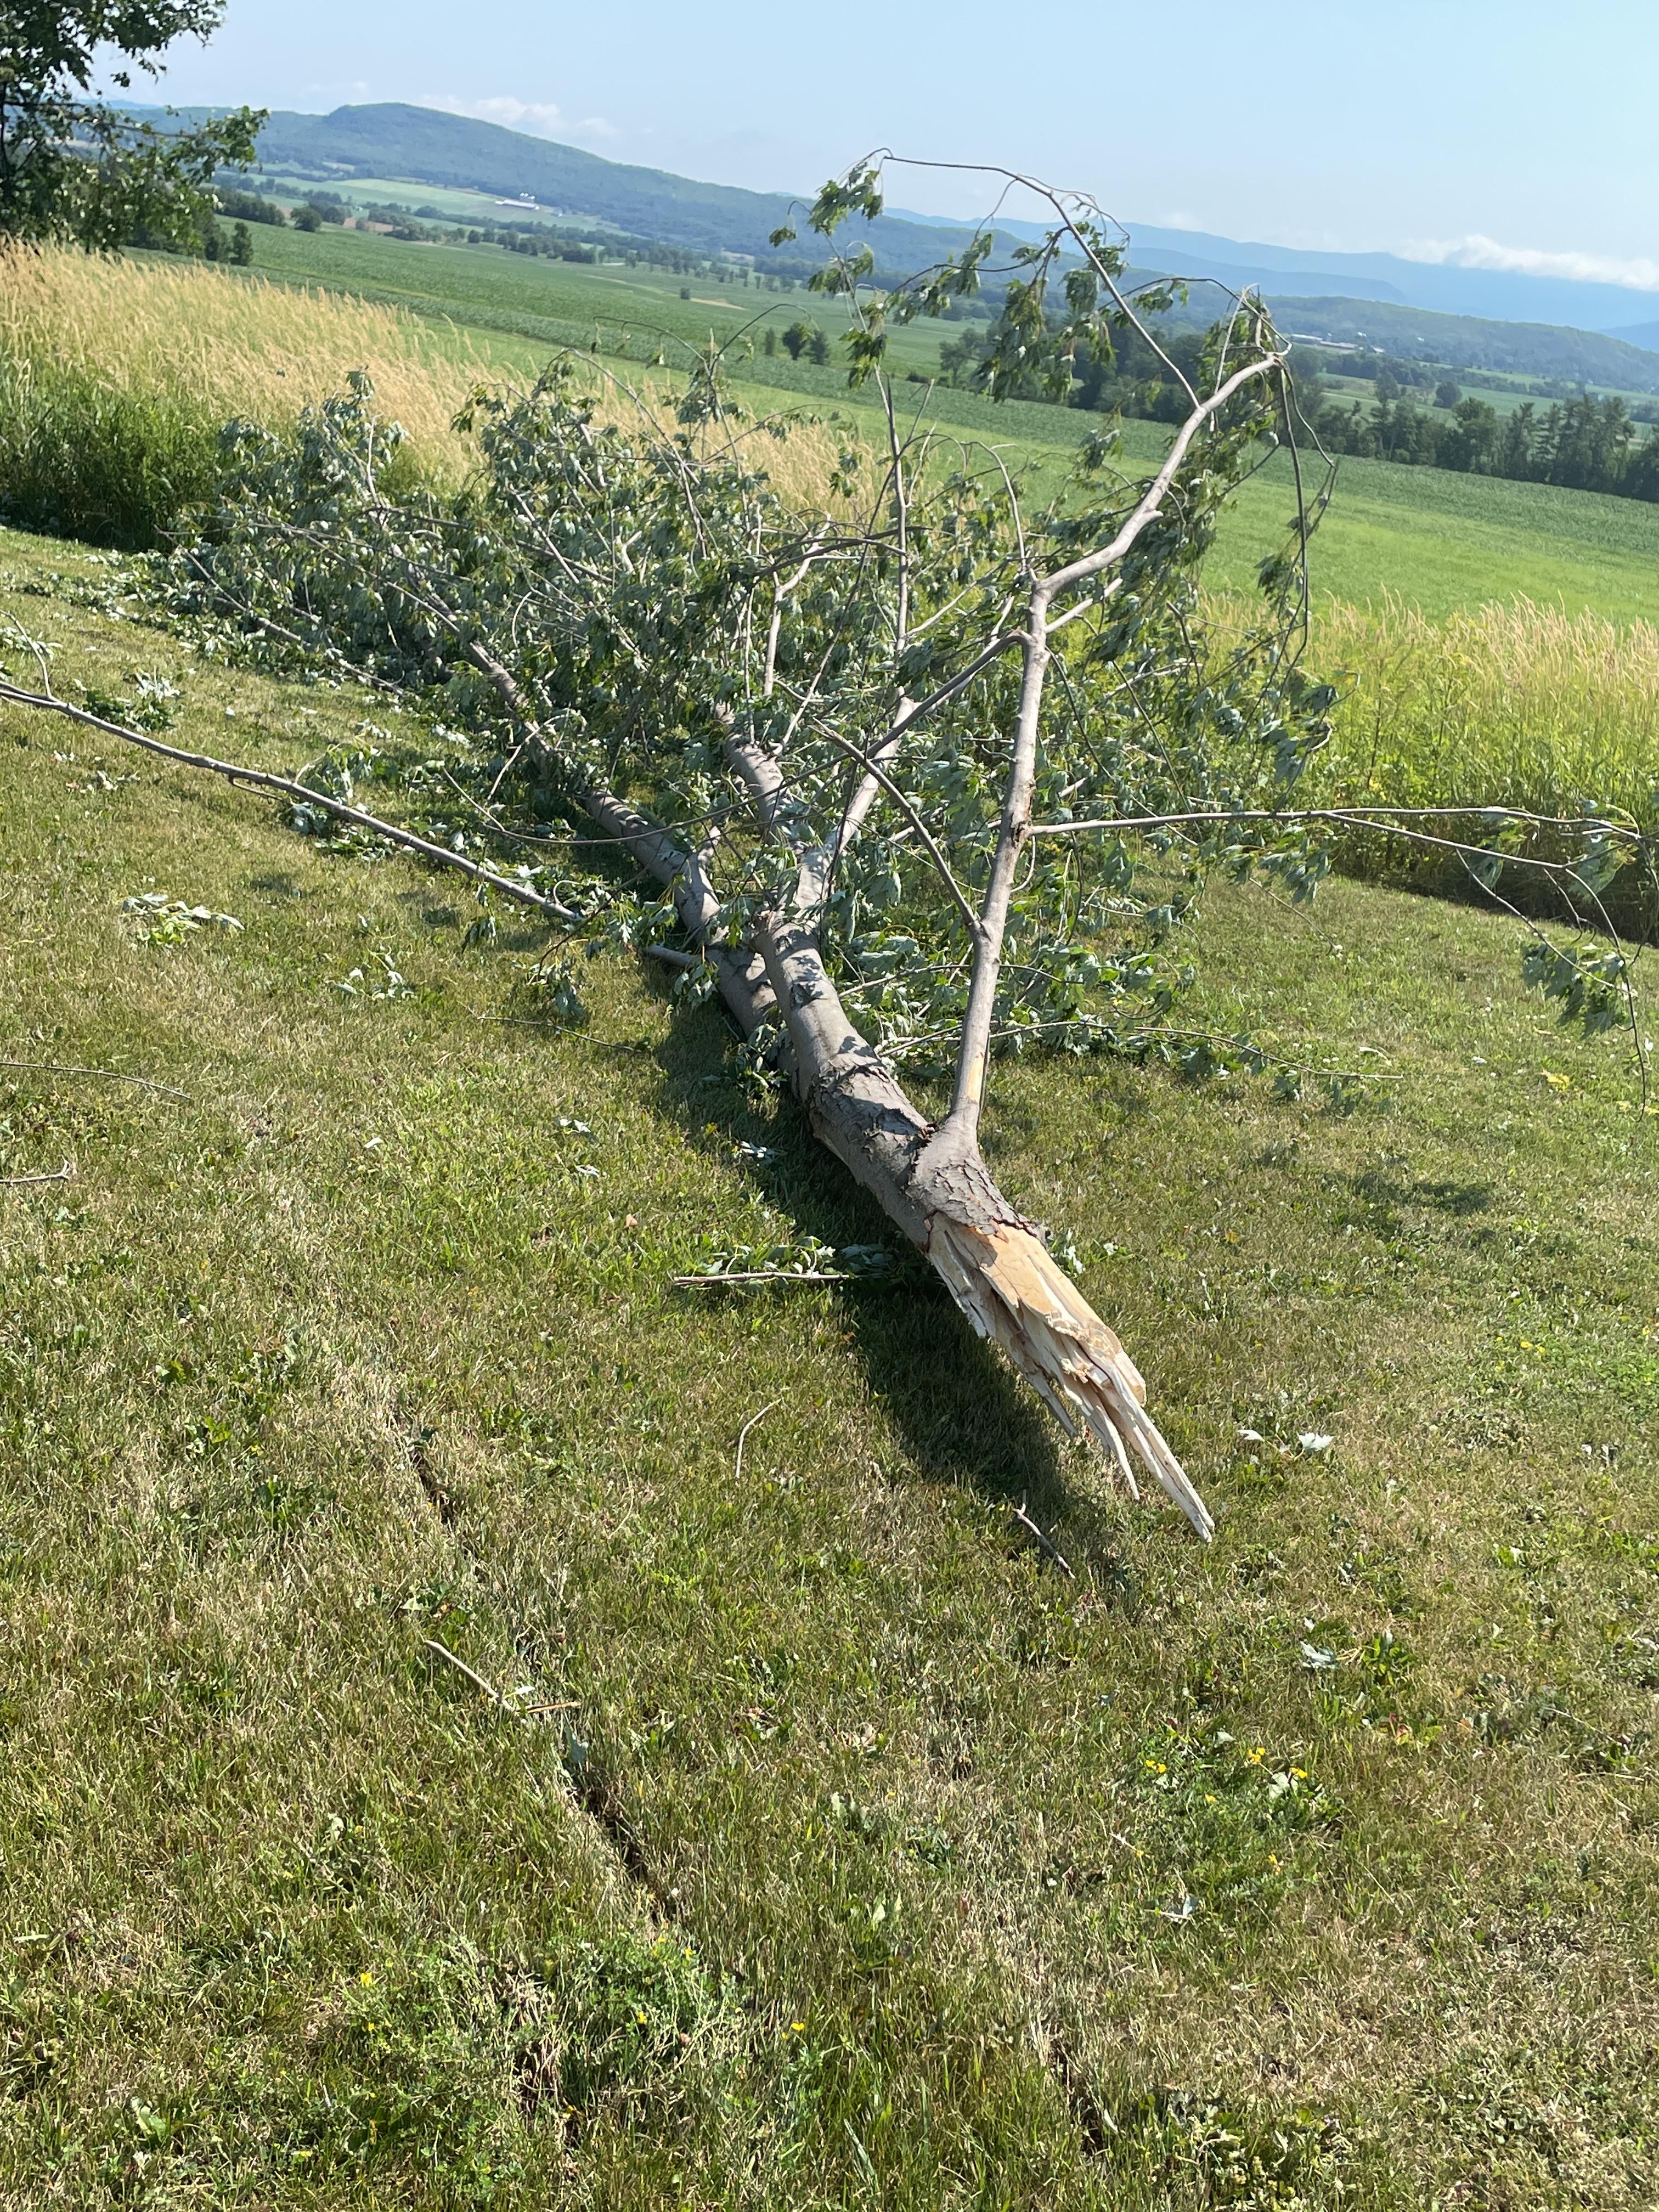
Click here to see an NWS Burlington survey photo of a snapped tree used to help assess tornado intensity.
Warning Decision Training Division Azimuthal Shear: https://vlab.noaa.gov/web/wdtd/-/azimuthal-shear
Storm Prediction Center 0 to 1 km Storm Relative Helicity and Lift Condensation Level references: https://www.spc.noaa.gov/exper/mesoanalysis/help/help_srh1.html
https://www.spc.noaa.gov/exper/mesoanalysis/help/help_lclh.html
Radar imagery for images 6, 7, and 8 was generated using GR2Analyst, Gibson Ridge Software Company http://www.grlevelx.com/gr2analyst_2/
Videos and Images 6 and 8 photos from video provided courtesy of Levi Barrett (image 6) and Chas Eller (image 8).


 Email the author