 Email the author
Widespread wind damage occurred across portions of the Champlain Valley on August 30th, 2022 with areas of northern New York getting hit particularly hard. During this event, we saw a long-lived, microburst-producing storm that produced widespread wind damage beginning in Moriah and Westport in Essex County before crossing Lake Champlain and causing additional damage to Burlington, Milton, Colchester, and St. Albans. Several mesonet sites in Essex County, NY, and at Diamond Island reported measured wind gusts between 52 and 57 mph as the storm began to move over Lake Champlain between 4:45 and 4:55 PM. The net result of this severe storm led to the declaration of a State of Emergency for Essex County. Hundreds of trees were uprooted or snapped from Moriah to Westport to Essex. In addition to the tree damage in Westport, 45 power poles were broken and needed to be replaced with numerous power lines also needing to be replaced. You can view a map of wind damage and wind gusts in Figure 1 below.
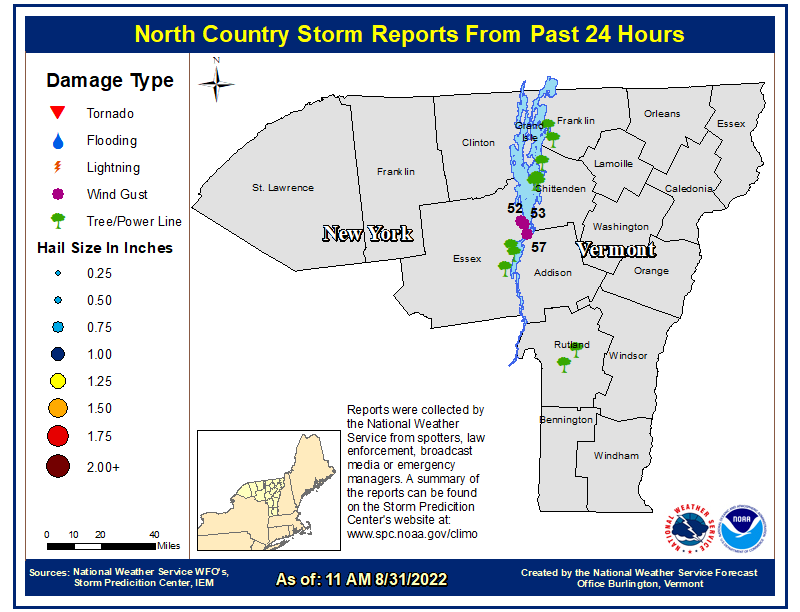
Figure 1: Wind damage and measured wind gust reports received for August 30th, 2022.[click to enlarge]
Part 1: Environmental Analysis
Surface analysis (Figure 2) from just before the severe storm began to develop showed an area of low pressure over James Bay in Canada with a cold front moving across the eastern Great Lakes. Out ahead of the front, temperatures were able to warm into the mid to upper 80s with dew points climbing into the upper 60s to near 70oF degrees. A surface trough (dashed orange line) can be seen moving across the Adirondacks which preceded a broad area of showers across Lake Ontario and the St. Lawrence Valley. The surface trough likely produced just enough surface convergence to allow storms to begin firing across the western Champlain Valley.
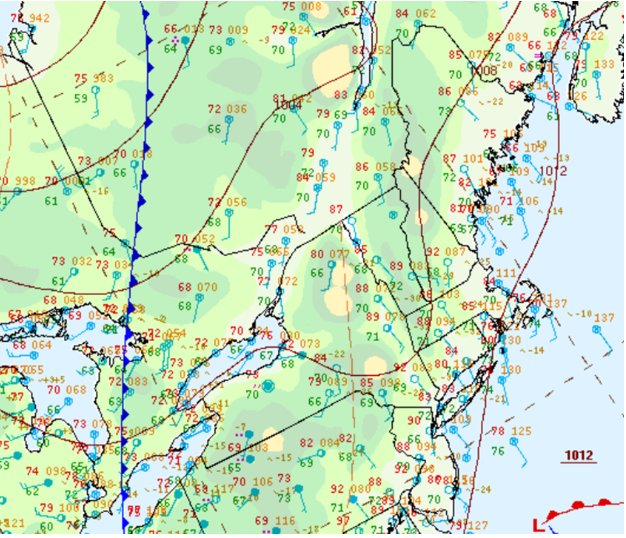
Figure 2: Weather Prediction Center (WPC) Surface Analysis 18 UTC/2 PM EDT on August 30th, 2022.[click to enlarge]
A broad area of instability developed across the Northeast during the early afternoon hours with a localized maximum of instability within the Champlain Valley which is evident in Figure 3 below. Prior to the development of this instability, a broad area of convective inhibition (CIN) was present across the Champlain Valley. The presence of this CIN delayed the onset of convection ahead of the surface trough allowing for destabilization to occur. As we start to see convective available potential energy (CAPE) values approach or exceed 2000 J/kg, this begins to enter the upper echelon for CAPE values typically observed in the Northeast. In addition to this instability, we saw deep layer, surface-6km shear values of 30-35 knots beginning to overspread northeastern New York into the Champlain Valley by 20 UTC/4PM EDT (Figure 4). The presence of 30-35 knots of deep-layer shear likely contributed to convective organization, and the small-scale bow echo producing areas of wind damage over a stretch of over 50 miles.
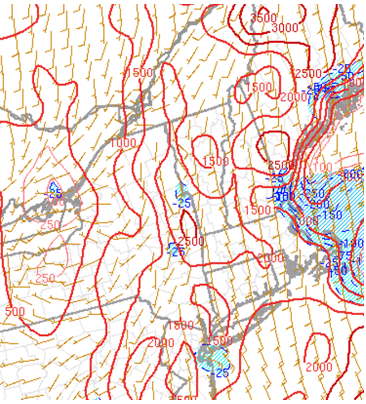
Figure 3: The Storm Prediction Center (SPC) RAP-based analysis of Surface-Based CAPE at 20 UTC/4 PM EDT. A narrow corridor of 2000 J/kg developed just before storms developed. The orange wind bards denote the surface wind speed and direction.[click to enlarge]
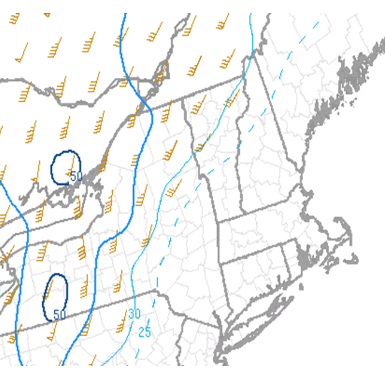
Figure 4: The Storm Prediction Center (SPC) RAP analysis of 0-6 km shear at 20 UTC/4 PM EDT. 30-35 knots of shear developed just prior to storm development.[click to enlarge]
The 12Z/8 AM EDT NAM3 sounding seen in Figure 5 shows the classic tell-tale signs for the potential for wet microbursts. There are two main areas of focus for wet microbursts with the first focus being the low level lapse rates. When looking at the model sounding, you’ll notice very steep low level lapse rates that are near or super adiabatic (temperatures cooling greater than 9.8 degrees C/km) through the first 5,000 ft. The next feature we will look at is the area of drier air between 5,000 and 12,000 ft. As rain and hail fall through this layer, evaporative cooling is likely to occur which will eventually choke off the updraft from a storm. In some cases, as occurred on August 30th, you can get a lot of rain droplets and hail suspended just above the updraft. Once the updraft weakens, the downdraft begins to take place. The density of all this suspended moisture allows for the air to descend rapidly and lead to a wet microburst.
In addition to looking at the model sounding data, another tool meteorologists look at is the potential equivalent temperature (known as theta-e) compared to the pressure level. This can be seen in Figure 6 which shows the 12Z NAM3 data from the 30th which also compares the model sounding data to the conceptual model created by Atkins and Wakimoto (1991). What we are looking at here is for our minimum theta-e value to be below the significant dry layer (in this case around 850 mb). This was found to be a very strong signature for wet microburst days in a paper by Atkins and Wakimoto in 1991. A link to this paper will be provided in the reference section below. In the case of August 30th, we see a max theta-e value of around 345K at the surface with a min theta-e value of near 320K at the 750 mb level. Based on the findings from Atkins and Wakimoto, a theta-e drop of at least 20 degrees K beneath the significant dry layer is a precursor to a high potential for wet microburst events. In the case of August 30th, the models were predicting around a 25 degree K drop in theta-e values from the surface to the 750 mb level. This aided forecasters in getting messages out to our partners in advance and also acted as a good situational awareness tool prior to storm development.
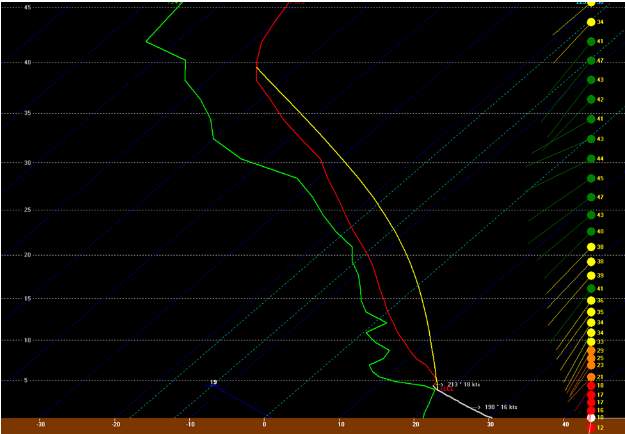
Figure 5: NAM3 model sounding at 18 UTC/2 PM EDT for Burlington, Vermont. You’ll notice the steep surface-based lapse rates and a pronounced dry layer above 800 mb.[click to enlarge]
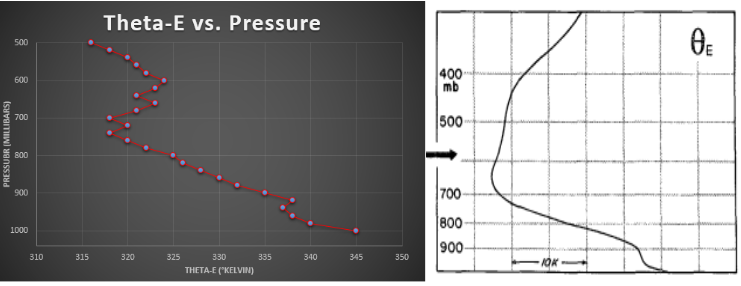
Figure 6: (Left) A Theta-e vs pressure chart created from the NAM3 data for KBTV from the 12 UTC/8 AM EDT run of the NAM3 for the 18 UTC/2 PM EDT time frame. (Right) The conceptual model created by Atkins and Wakimoto, 1991, on wet microbursts.[click to enlarge]
Part 2: Radar Analysis
After a quiet morning and early afternoon period, storms quickly began to develop across central and northern New York as the pre-frontal trough moved across the Adirondacks and into the Champlain and Hudson Valleys. The storm we will be focusing on in this write-up is the storm that tracked over 50 miles across northern New York into northwestern Vermont which led to widespread wind damage in a narrow swath from Moriah, NY all the way to St. Albans in Vermont. A narrow axis of greater instability developed just in the lee of the Adirondacks, and the surface trough provided just enough surface convergence to get storms to develop. As seen in Figure 7, once the storm in northern New York began to develop, it quickly developed a strong inbound velocity signature that can be seen in green. This area of strong winds became increasingly expansive as it moved through the towns of Moriah and Westport in New York where extensive tree damage and some damage to property were observed. As the storm continued to track to the northeast towards Essex, a wet microburst developed and was sampled well by radar. Figure 8 shows a closer look at the winds near Westport with the first of several microbursts compared to a vertical cross-section of the wind signature. Multiple sites in and around Essex measured wind speeds of 52-57 mph as this storm passed by but it looks like the strongest winds missed the measuring sites by just a few miles.
Figure 7: A loop of radar data from the KCXX radar from 3:53 to 4:50PM EDT on August 30th. You can see a storm develop across northern New York and track northeastward. The wind signature we are focused on is highlighted on the right.[click to enlarge]
Figure 8: A loop of the velocity signature as the storm passed through Westport (right) compared to volume rendering of an isosurface of the winds (left). The image on the left has 2 main contours. Light green represents winds of at least 50 knots (58 mph) while the darker green indicates winds in excess of 60 knots (69 mph).[click to enlarge]
This storm continued to show a strong velocity signature as it approached the Burlington area. Given the damage reports and radar signatures that were reported, our office issued a severe thunderstorm warning with a “considerable” tag highlighting that wind gusts up to 70 mph were possible with this storm. As this storm rolled across Lake Champlain, widespread wind damage began coming in across the New North End of Burlington with trees being toppled or uprooted before the storm continued northeastward. Additional damage was reported in Colchester, Milton and St. Albans where trees were toppled of which some fell on power lines causing around 5000 customers to be without power for a brief period of time. Ultimately, this storm fizzled out as it approached the International Border. While this storm only existed for about 2 hours, it left a significant amount of damage in its wake. Figure 9 highlights a loop as the storm crossed Lake Champlain.
Figure 9: A loop of radar data from the KCXX radar from 4:55 to 5:39 EST on August 30th. You can see the storm pass through Burlington and emerge over Milton and St. Albans. Widespread damage was reported from Burlington to Colchester to Milton to St. Albans.[click to enlarge]
Part 3: What is a Microburst?
A microburst is a localized column of sinking air (downdraft) within a thunderstorm and is usually less than or equal to 2.5 miles in diameter. Microbursts can cause extensive damage at the surface, and in some instances, can be life-threatening. It all starts with the development of a thunderstorm and the water droplets/hailstones being suspended within the updraft. Sometimes an updraft is so strong it suspends large amounts of these droplets and hailstones in the upper portions of the thunderstorm. There are many factors that can lead to evaporational cooling (sinking air) and therefore weakening of the updraft. Once this occurs, it is no longer capable of holding the large core of rain/hail up in the thunderstorm. As a result, the core plummets to the ground. As it hits the ground it spreads out in all directions. The location in which the microburst first hits the ground experiences the highest winds and greatest damage. Check out figures 10 and 11 to get a visual idea of how a microburst develops and what one looks like.
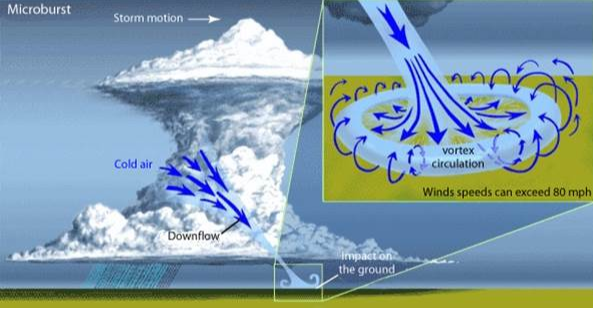
Figure 10: This image shows what a microburst conceptually looks like. Rapidly descending air, driven by a higher density air mass, crashes into the ground and can create significant damage in a relatively small area. Image courtesy of NOAA.[click to enlarge]

Figure 11: This is a timelapse of a microburst but not the one that impacted Westport and Moriah in northern New York. Image courtesy of NOAA.[click to enlarge]
Part 4: Damage Photos
We would like to extend our sympathy to those impacted by damaging winds on August 30th. We reached out to multiple people to get permission to share some of the damage that was observed to share how impactful non-tornadic storms in the North Country can be.

Figure 12: This image taken by Marilyn Schmich shows a large tree that fell on an outhouse causing significant damage to the structure.[click to enlarge]

Figure 13: This image taken by Arleen Phillips shows several large trees down on a structure causing significant damage.[click to enlarge]

Figure 14: This image taken by Larry Carroll shows what many people saw with widespread tree damage across roads leading to impossible travel following the storm.[click to enlarge]
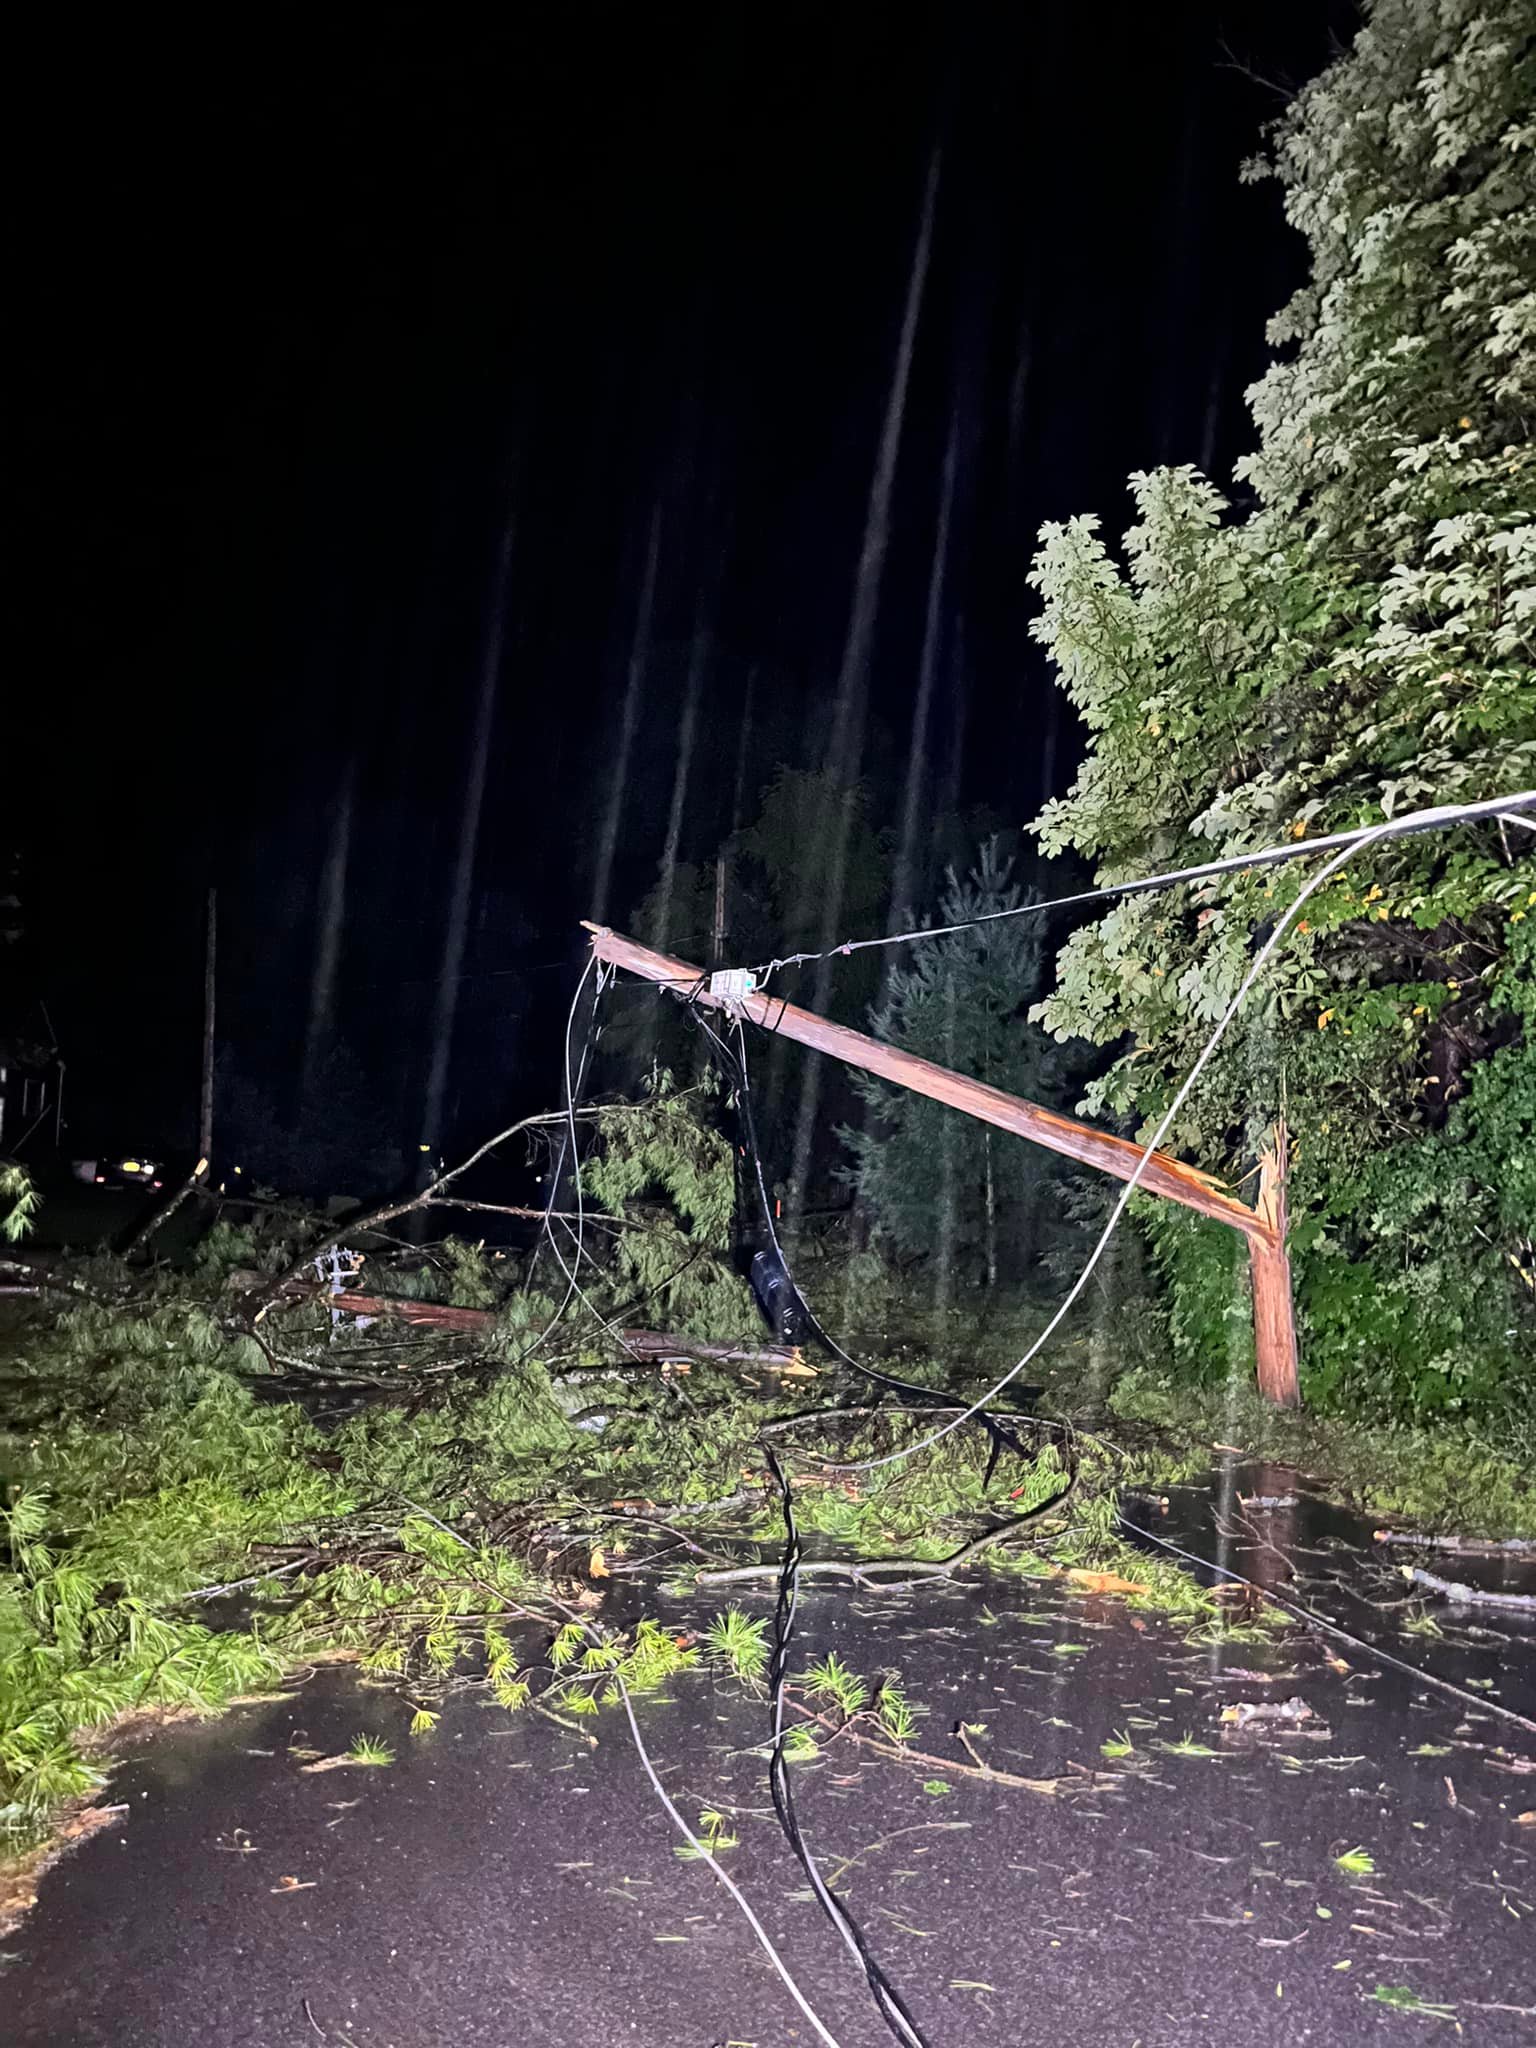
Figure 15: This image taken by Steven Smith shows just one of many power lines and power poles damaged by the storm. At one point, over 80% of Westport was without power for upwards of 36 hours.[click to enlarge]

This aerial image taken by John Wilson with the Region III New York State Office of Emergency Management shows just how narrow the corridor of stronger winds was. You can see numerous trees which have been downed which are all facing in the northeast direction. This is a classic example of straight-line wind damage caused by a microburst.[click to enlarge]
Part 5: Summary
While severe storms were not widespread, extensive damage was observed across a very narrow corridor of the Champlain Valley in northern New York and northwestern Vermont. A narrow corridor of 2000 to 2500 J/kg of CAPE developed locally within the Champlain Valley which allowed for strong enough updrafts to support hydrometeors in the air. As these updrafts weakened, the precipitation rushed to the surface which caused several cores of strong winds aloft to impact the ground leading to widespread damage. Microbursts aren’t too uncommon in the North Country, with several seen throughout the severe season, but the amount of damage and long track of said damage is quite rare. While our office did not officially conduct a storm survey given the clear signs a wet microburst occurred, peak wind gusts up to 80 mph look possible near Westport and Moriah based on the damage to hardwood trees and utility infrastructure.
References
Figure 6 - Wet Microburst Activity over the Southeastern United States: Implications for Forecasting Nolan T. Atkins1 and Roger M. Wakimoto1.: https://journals.ametsoc.org/view/journals/wefo/6/4/1520-0434_1991_006_0470_wmaots_2_0_co_2.xml
Radar imagery for images 7, 8, and 9 was generated using GR2Analyst, Gibson Ridge Software Company http://www.grlevelx.com/gr2analyst_2/
Figures 10 and 11 were taken from https://training.weather.gov/
Figure 12 is courtesy of Marilyn Schmich from Facebook
Figure 13 is courtesy of Arleen Phillips from Facebook
Figure 14 is courtesy of Larry Carroll from Facebook
Figure 15 is courtesy of Steven Smith from Facebook
Figure 16 is courtesy of J.D. Wilson with the Region III New York State Office of Emergency Management

