
A Winter Storm Watch is in effect for southeastern St. Lawrence County in New York. Lake effect snow is expected to develop, with total snow accumulations between 4 and 10 inches possible. Travel could be very hazardous, especially for anyone traveling for the Thanksgiving holiday. Continue to monitor the latest forecasts for updates. Read More >
 Email the author
On 10 July 2025, multiple rounds of slow-moving thunderstorms produced localized flash flooding across Vermont. The environment had weak low to mid-level flow much of the day, which favored thunderstorms with erratic motions or backbuilding features. Weak impulses periodically lifted into the region with renewed surges of instability that aided new thunderstorm development. Considerable flash flooding occurred in the towns of Sutton, West Burke, and East Haven, Vermont where swiftwater rescues were performed and significant washouts occurred. Additional localized road washouts took place near Orleans and New Haven, Vermont. The event pales in comparison to the flooding on the same day in 2023 and 2024, but the timing could not be worse for those reflecting on the devastation from the previous two years. In addition to producing heavy rainfall, a few thunderstorms also produced damaging winds and hail. A supercell managed to develop and produced hail over Orleans, and a few other storms produced downbursts that downed trees, powerlines, and partially peeled a roof (Figure 1).
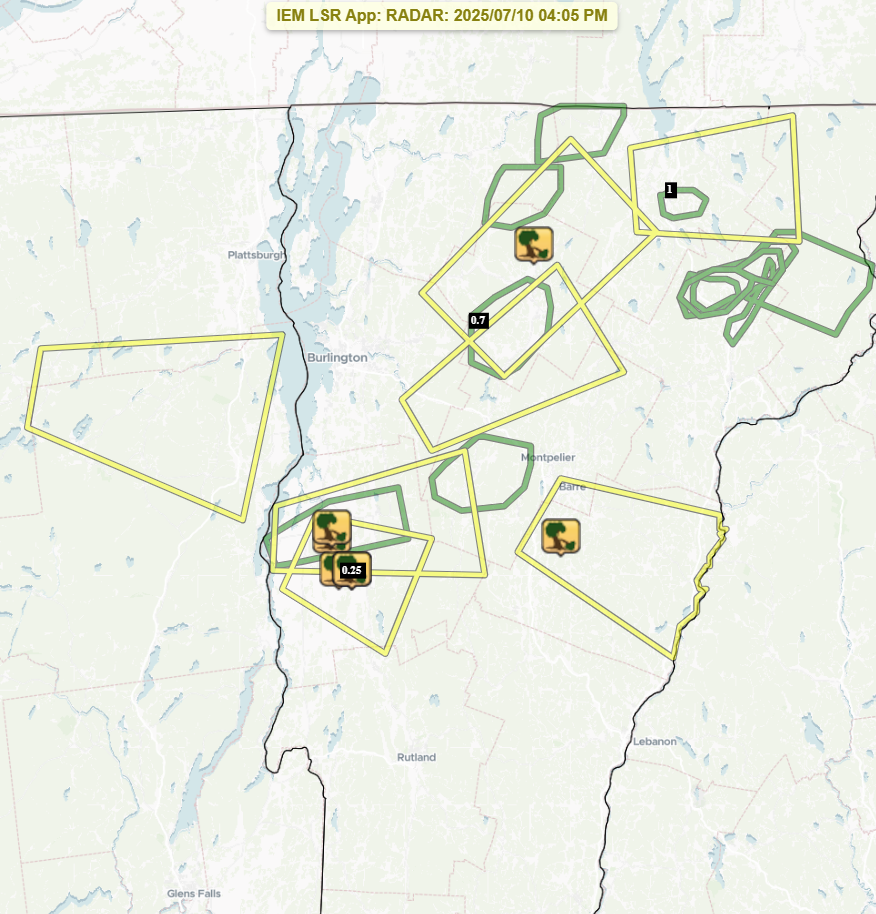
Figure 1: Summary of warnings and reports for 10 July, 2025 mapped using Iowa Environmental Mesonet across northern Vermont and parts of far northeastern New York. Thunderstorm wind damage is depicted with a broken tree limb in a yellow icon. Hail is depicted with small black squares with their size in inches. Flooding is depicted with water in a green icon. The yellow boxes were Severe Thunderstorm Warnings. The green boxes were either Flood or Flash Flood Warnings.[click to enlarge]
This review will assess the environment that allowed multiple rounds of thunderstorms and serve as a comparison piece. Radar analysis of the most significant storms that produced flash flooding and severe weather will be conducted as well. We will also discuss the antecedent conditions and how that prevented more significant flooding on this occasion.
The primary features that triggered multiple rounds of thunderstorms were a weak surface trough located near Montreal and a strengthening thermal boundary over Vermont. On the morning of 10 July 2025, a remnant boundary lifted north and stalled over New England, which served as a focal point for the initial round of thunderstorms across eastern Vermont. Lingering cloud cover in eastern Vermont and building high pressure across the Canadian Maritimes enhanced a thermal gradient between the eastern and western halves of Vermont as solar heating warmed up the Champlain Valley (Figure 2).
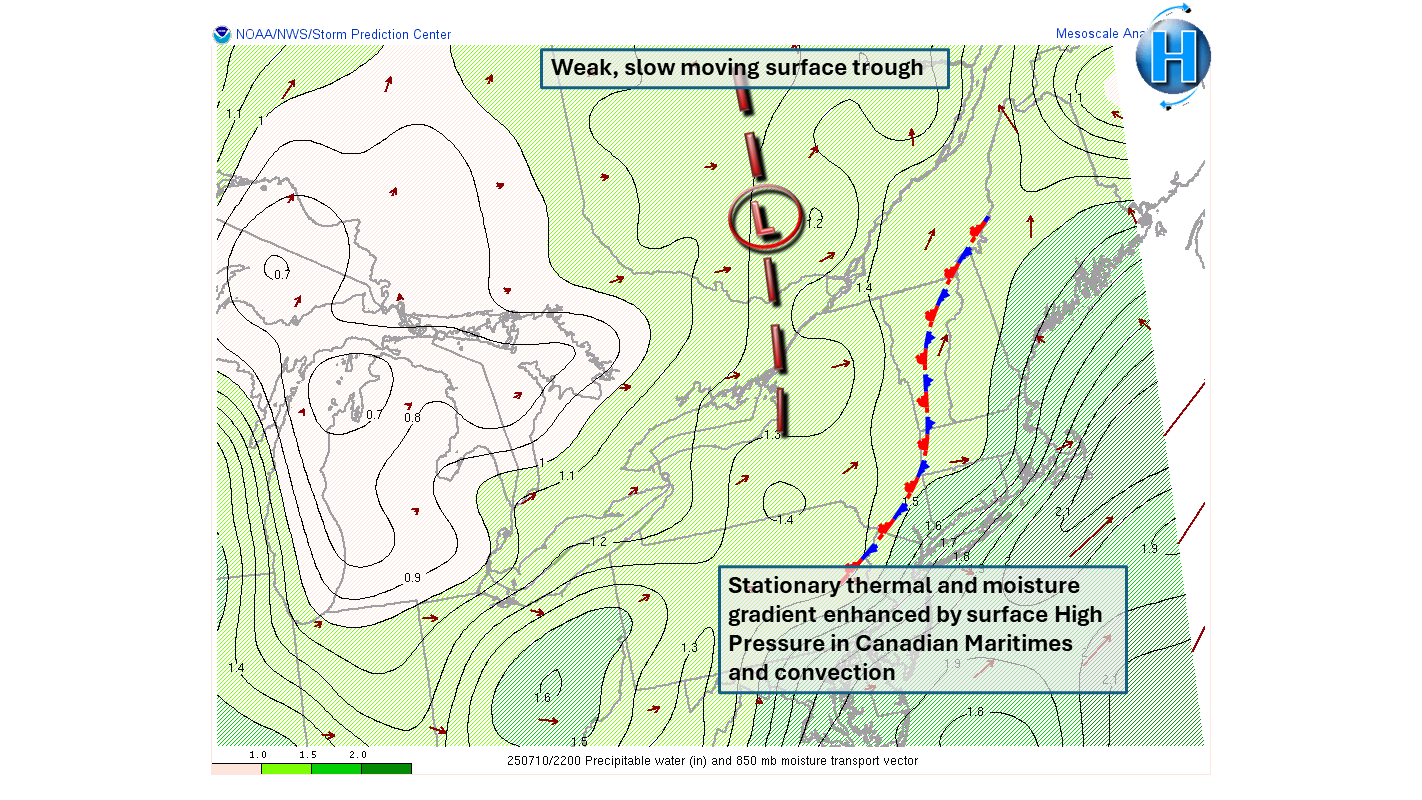
Figure 2: NOAA/NWS/Storm Prediction Center surface observations with precipitable water values (PWAT, shaded, in inches), 850mb moisture transport (red arrows) and annotated weather features at 22 UTC on 10 July 2025. PWATs ranged between 1.3” and 1.5” at this time with moisture transport vectors displaying some confluence into New England.[click to enlarge]
Although low level winds were weak, the proximity of the surface high and the weak trough resulted in increased low-level convergence across the region. Local enhancement of convergence occurred at the onset of a lake breeze from Lake Champlain, which combined with daytime heating, initiated the second round of thunderstorms (Figure 3). Finally, the incoming upper trough produced the final round of thunderstorms.
Figure 3: Looped NOAA/NWS/Storm Prediction Center deep moist convergence (red contour) and 100-mb mean mixing ratio (g/kg, green contour where favorably high and dotted blue where dry air is present) from 15 UTC on 10 July 2025 to 00 UTC on 11 July 2025.[click to enlarge]
Looking at these ingredients, this year’s 10 July lacked the focus of a remnant tropical cyclone like Hurricane Beryl in 2024 or the unseasonable phasing of an upper level low and coastal cyclone in 2023. Additionally, the precipitable waters for the event were only in the range of 1.25” to 1.50”, which are not extraordinarily high values. Though moisture and large scale forcing were marginal, the main cause for sustained precipitation was a persistent ridge in the equivalent potential temperatures. This is a meteorological term that communicates the amount of heat and moisture if all the water vapor were saturated and condensed back to 1000 mb, which is usually near sea level. Higher values indicate greater atmospheric instability and available moisture. In the absence of other features, this technical term can be important in distinguishing the potential for excessive rainfall. When flow is sufficiently light and with adequate forcing, backbuilding and training become more likely in the presence of an equivalent potential temperature ridge, and this feature was present across Vermont notated below in Figure 4. This feature remained present for much of the day with light flow across the low to mid levels of the atmospheric column that was generally 15 knots or less, which also featured mean flow that was favorable for slow, erratic motion (not shown).
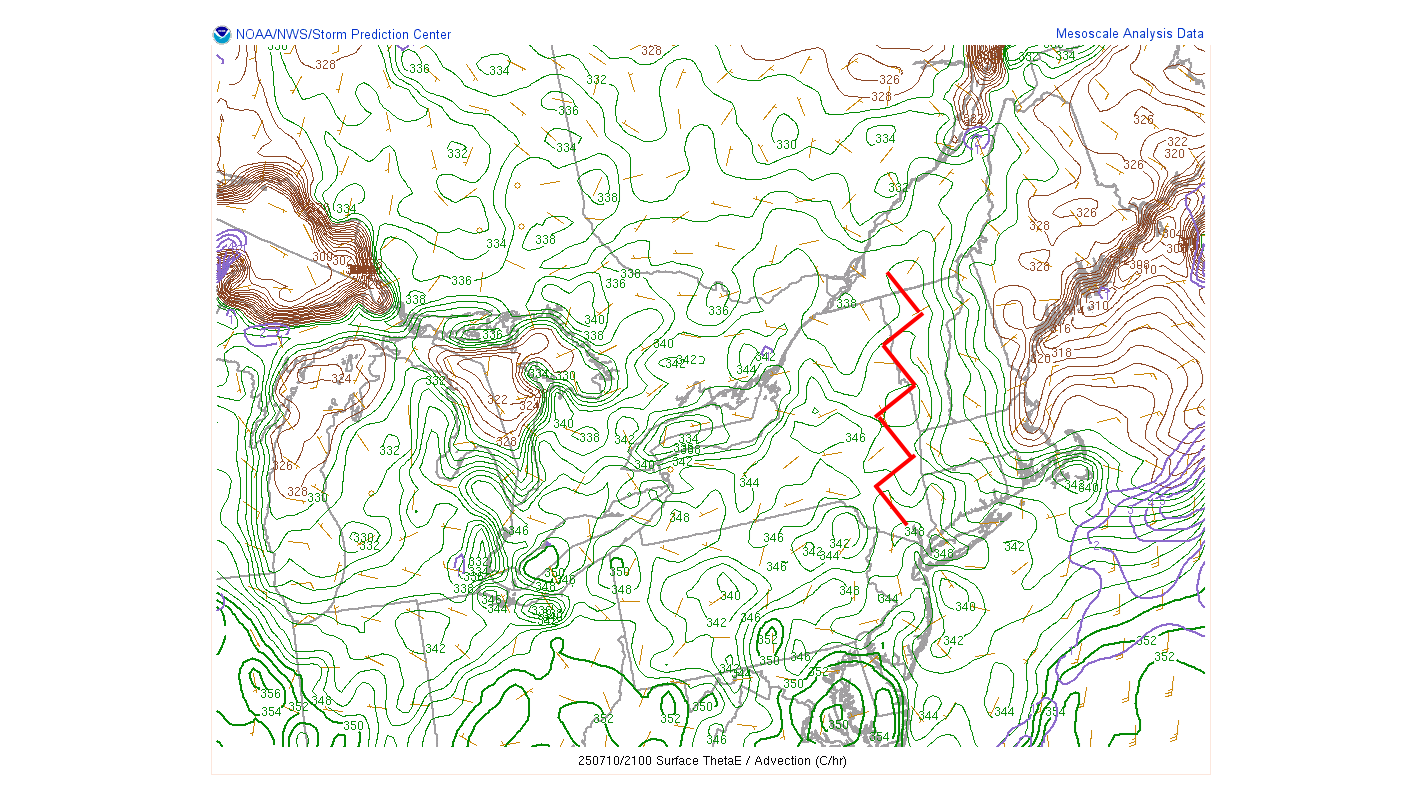
Figure 4: NOAA/NWS/Storm Prediction Center equivalent potential temperature (Theta E, degrees K) at 21 UTC on 10 July, 2025. Green contours indicate higher values while brown contours indicate dry, stable air. Wind barbs depict RAP analyzed near surface winds (in knots. The Theta-E ridge axis is annotated with the twisted red line.[click to enlarge]
About 21 UTC (5 PM EDT) 10 July 2025, a sharp upper trough began to dig towards northern Vermont. Faster winds ahead of the trough increased wind shear and caused faster storm motions later in the evening. Higher shear and increased synoptic forcing resulted in a few strong to severe thunderstorms across Vermont that produced damaging winds and hail. We will detail the more notable thunderstorms and the heavy rainfall in the following segment. After sunset instability began to decrease. Although a few brief resurgences of showers occurred in association with the upper trough, weaker upward motions minimized additional heavy rainfall during the evening. The radar loop below depicts the entirety of the event in 30 minute intervals (Figure 5).
Figure 5: NSSL's Multi-Radar, Multi-Sensor (MRMS) mosaic composite reflectivity (dBZ) loop in 30-minute increments for the period 0746 UTC 10 July 2025 through 0346 UTC on 11 July 2025. [click to enlarge]
One of the notable storms included a supercell in Orleans County, pictured in Figure 6. Despite the hot conditions present across the region, it was able to produce hail. Supercells, characterized by persistent mid-level rotation, allow the updraft to remain removed from a thunderstorm’s downdraft, resulting in large hail falling just west of Orleans, Vermont. The storm had a deep mesocyclone. Correlation coefficients even fell below 0.9, which tends to be a threshold for more significant, 2” diameter hail. However, the -20 °C layer was present around 21000-22000 ft elevation, which was higher than the observed 68 dBZ core located just under 19940 ft elevation. Hail is more likely when higher reflectivity reaches above the -20 °C layer, and the MESH (Maximum Estimated Hail Size) algorithm was about 1.50”.
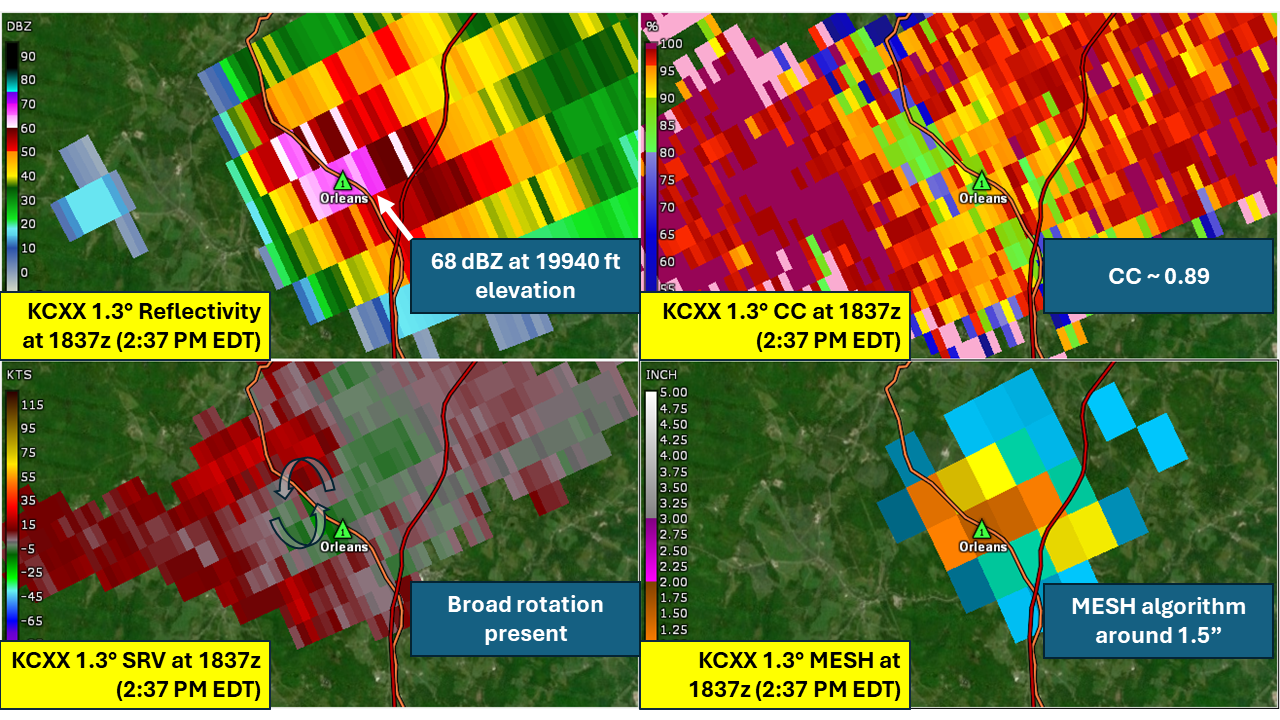
Figure 6: Images for Colchester, Vermont (KCXX) radar at 1.3° for base reflectivity (top left), correlation coefficient (top right), storm relative velocity (bottom left), and maximum estimated hail size algorithm (bottom right) at 1837 UTC 10 July 2025. Each image is annotated with the feature of interest for severe weather.[click to enlarge]
The damaging storm we will examine occurred near Middlebury, Vermont from about 2015 to 2040 UTC (4:15 to 4:40 PM EDT), 10 July 2025. This storm produced a severe downburst that resulted in downed trees and a roof partially torn off Middlebury High School. Atmospheric conditions for strong thunderstorms were most favorable in the Champlain Valley, where heat and humidity were already positioned. The advancing upper trough previously mentioned also had mid-level dry air associated with it (not shown). Dry air entrainment driven into the thunderstorm likely enhanced the downburst of this storm. Base radar velocities away from the radar indicated about 45 knots around 2000 foot elevation, and with a motion at an angle to the radar beam suggesting undersampled velocities (not shown). The collapsing core visualized by reflectivities falling from about 15000 ft to the ground likely produced the strongest winds that took place near Middlebury High School (Figure 7).
Figure 7: Looped KCXX base reflectivity cross section that cuts through Middlebury, Vermont from 2019 UTC through 2039 UTC on 10 July 2025. The vertical axis indicates height. As high reflectivity moves down the vertical, this indicates the collapse of a thunderstorm core at the ground.[click to enlarge]
Assessing the hydrologic aspect of the event, the thunderstorm cluster that developed over Sheffield, Sutton, and Burke produced the most intense rainfall rates of the event. This region had been primed by rain in the morning hours that produced about 0.25-1.25”, locally near 1.75” across Caledonia County. Slow storm motions were present across much of the Northeast Kingdom while low-level convergence combined with increasing atmospheric instability provided enough forcing for sustained thunderstorms. A weather station in West Burke, Vermont observed an impressive 3.61” of precipitation in an hour (Figure 8) between 1904 and 2004 UTC. Several stations nearby reported around 5” rainfall for the day. For additional rainfall reports, visit this link to the Iowa Environment Mesonet with our Public Information Statement for totals during the 10 July 2025 event. This resulted in a sharp 4.5 ft increase at the East Branch of the Passumpsic at East Haven. The localized nature of thunderstorms prevented sustained rises. The East Branch of the Passumpsic crested at minor flood stage and only remained in flood for roughly 30 minutes (not shown).
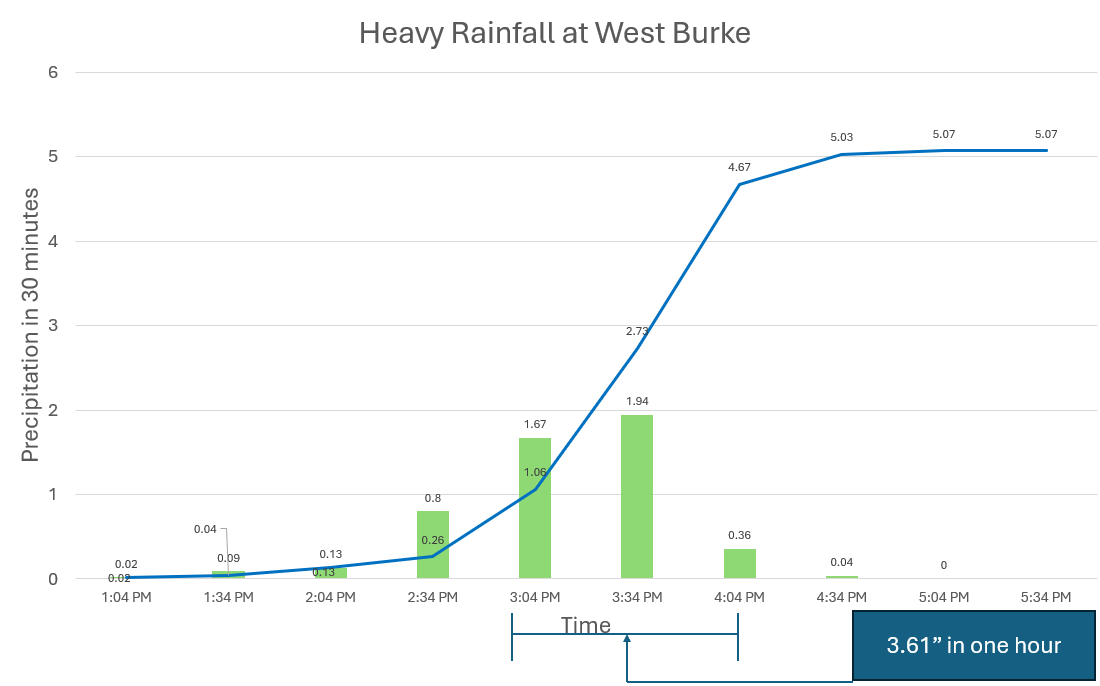
Figure 8: Accumulated precipitation amounts (blue line) and 30 minute precipitation rates (green bars) depicting heavy rain over West Burke, Vermont between 1:04 PM and 6:04 PM EDT. The 3.61” in one hour between 1904 and 2004 UTC is bracketed in the image.[click to enlarge]
The other region with very heavy rainfall rates that we’ll draw attention to were a cluster of cells that developed over Addison that briefly displayed backbuilding until deep-layer flow increased with the trough. They developed about the same time as the most intense rainfall rates across the Northeast Kingdom. Being positioned closer to KCXX, the radar had a nearly unobstructed view. Like West Burke, a personal weather station just north of Weybridge was beneath these thunderstorms. 3.50” of rain was recorded in an hour. MRMS estimated precipitation in the hour between 1916Z and 2016Z was 2.92” in an hour for this region (Figure 9).
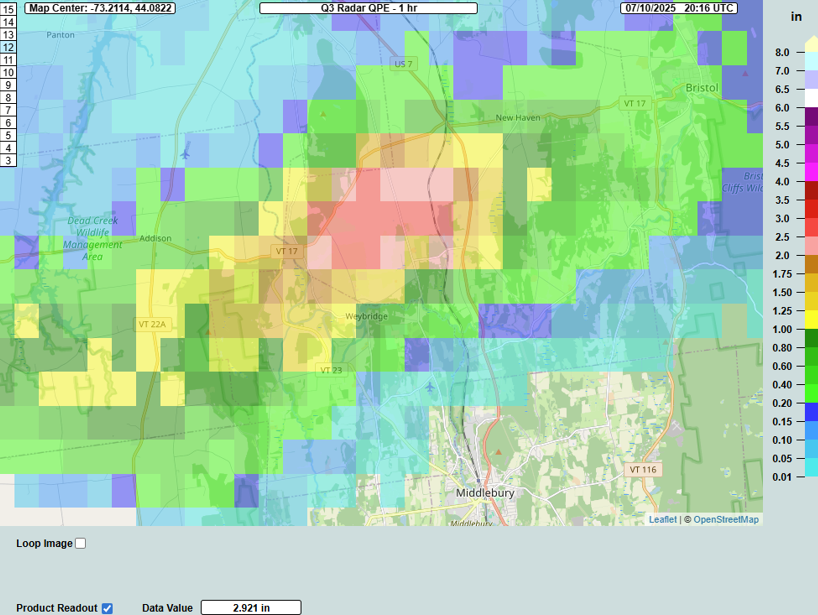
Figure 9: NSSL's Multi-Radar, Multi-Sensor (MRMS) radar quantitative precipitation estimate for 1 hour between 1916 and 2016 UTC 10 July 2025. The data value of 2.921 inches would indicate the MRMS estimated rainfall in one hour for the maximum value read out north of Weybridge, Vermont.[click to enlarge]
Compared to the previous 10 July flood days, this event was much closer to standard summertime flash flooding than the more significant flash flood events the prior years. Flooding is most common during the summer months, with July having the highest number of flash flood reports. Slow-moving thunderstorms capable of torrential rainfall rates are most common in July because this month features the highest heat and humidity essential to warm rain processes. Eight flash flood reports were submitted for 10 July 2025, which does not reach into the Top 10 for daily reports over the last 20 years. Where rainfall did occur, significant impacts occurred, but the 10 July 2025 event was closer to a typical flash flood event (Figure 10).
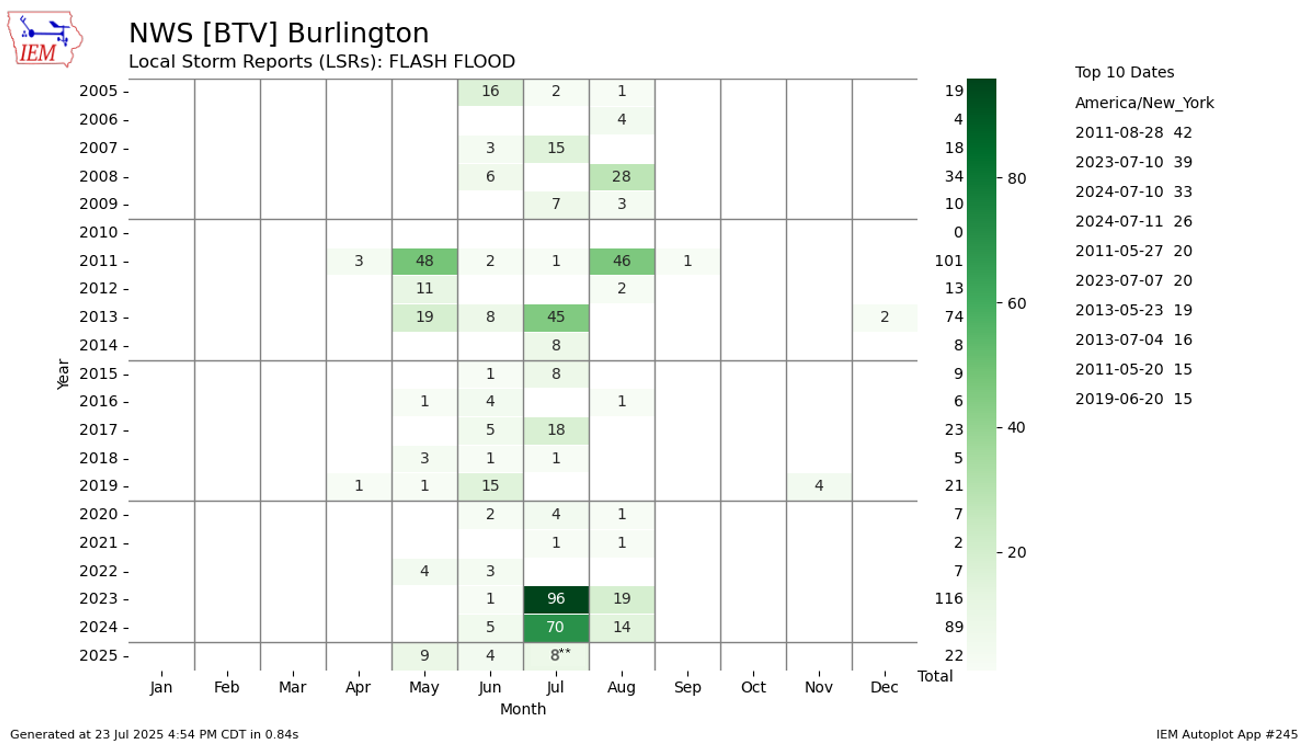
Figure 10: Iowa Environmental Mesonet Autoplotter #245 that shows Flash Flood reports by year and calendar month with the highest daily reports ranked on the right. The ** indicates an error due to a duplicate report and highlights that July 2025 is not done at this time of writing.[click to enlarge]
The potential for significant impacts on 10 July 2025 were limited due to antecedent dry conditions. Although May had above normal precipitation across much of the region, this reversed during June. Many locations reported monthly precipitation amounts 30-75 percent of normal across the region (Figure 11). At www.weather.gov/btv/climate, the other monthly climate maps for June 2023 and 2024 are also available. Both prior years featured above normal precipitation above much of the region. Overall, Vermont was not as primed for more widespread flooding on 10 July 2025.
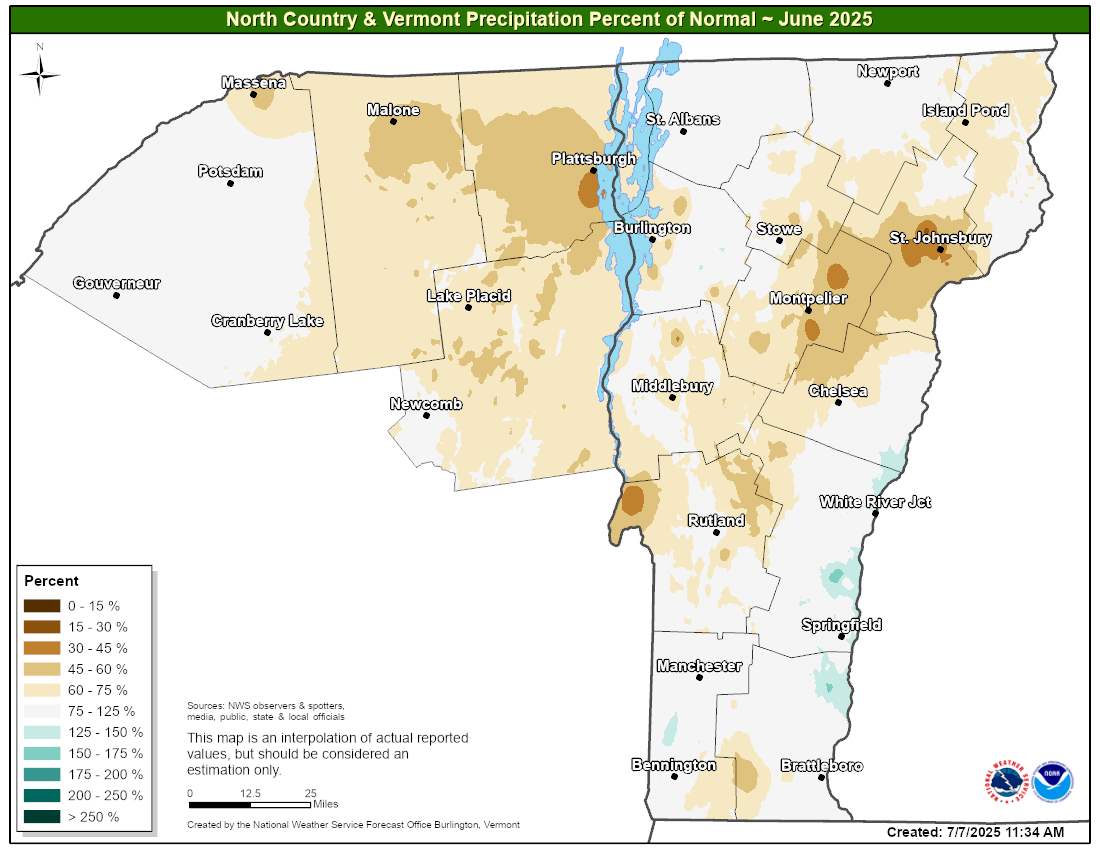
Figure 11: National Weather Service Burlington, Vermont map of precipitation percent of normal for climate sites, COOP, and CoCoRaHS for June 2025.[click to enlarge]
When comparing the synoptic weather features, 10 July 2025 lacked a large scale focus for heavy precipitation, instead relying on subtle features within weak to moderate low-level flow. The July 2023 Flood was the result of deep-moisture funneled between an unseasonably strong upper low in Canada and another blocking high that channeled moisture while a slow coastal cyclone lifted north into New England. The July 2024 Flood had strong moisture transport and frontal forcing along the remnants of Hurricane Beryl. The 850mb fields in 10 July 2025 bear some resemblance to the Great Vermont Flood of 2023, but the Canadian trough-ridge pair were weaker and the channeled moisture into Vermont was short-lived without a better focus for heavy rainfall overall (Figure 12).

Figure 12: NOAA/NWS/Storm Prediction Center 850mb analysis for 00 UTC 11 July 2023 (Left), 00 UTC 12 July 2024 (Middle), and 00 UTC 11 July 2025 (Right). Green contours indicate dewpoint, red dashed lines indicate temperature, black contours indicate heights at 850mb, and the wind barbs and observations are plotted at each RAOB site that released weather balloons. Key weather features to each event is annotated.[click to enlarge]
The July 2023 Flood had two days of heavy rain focused across the center line of Vermont where 5 to 8 inches fell across two days, with values locally up to 9 inches. The July 2024 Flood had a sharp gradient between the northern and southern half of our area with a swath of 3 to 6 inches of precipitation, with values locally up to 7 inches. For 10 July 2025, amounts were highly variable, but there was a focus along the northern Green Mountains and in the Northeast Kingdom, where 1 to 3 inches fell with values locally up to 5 inches (Figure 13).
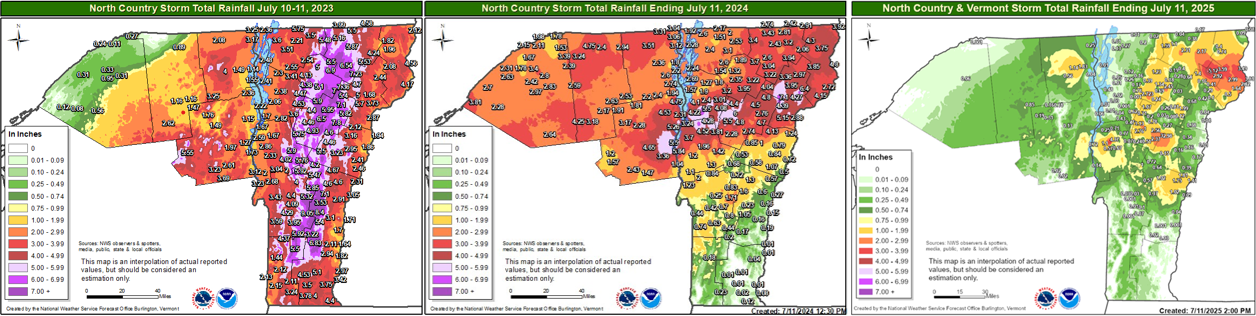
Figure 13: National Weather Service Burlington storm total precipitation for the 2023 Great Vermont Flood (Left), Remnants of Beryl (Middle), and the localized flash flood for 10 July 2025 (Right).[click to enlarge]
Quick references and credits:
Figure images 1 and 8 were created using the resources available through the Iowa Environmental Mesonet page.
The link for the rainfall Public Information Statement is stored through the Iowa Environmental Mesonet text archive.
Radar imagery for figure images 6 and 7 were generated using GR2Analyst, Gibson Ridge Software Company http://www.grlevelx.com/gr2analyst_2/
July 10th data for West Burke and New Haven, Vermont were accessed using Wunderground and may be found at: https://www.wunderground.com/dashboard/pws/KVTWESTB3/graph/2025-07-10/2025-07-10/daily and https://www.wunderground.com/dashboard/pws/KVTNEWHA9/graph/2025-07-10/2025-07-10/daily

