Grand Forks, ND
Weather Forecast Office
Surface Charts
Series of surface maps from 12 PM CST until 5PM CST(about 1 1/2 hr before the tornado)showing the fronts, temperatures, winds and dewpoints associated with the tornado.
Note how a well defined warm front extended into Fargo, where surface winds became east right before the tornado approached Fargo. Dewpoints pooled into the upper 60s to near 70 along the warm front, and provided the needed moisture near the surface for a major tornado. This was a classic setup at the surface for a major tornado.
The station plots on the surface maps display the following values. Surface air temperature (in degrees F) is in the upper left hand corner. Surface dewpoint (in degrees F) is in the lower left hand corner. The surface pressure (in millibars) is in the upper right hand corner. Wind speed and direction are denoted by the wind barbs. The barbs indicate the direction the wind is coming from. Small flags indicate wind speeds of around 5 knots. Large flags indicate wind speeds of around 10 knots. As an example, a wind barb which has both a large and small flag indicates a wind speed of approximately 15 knots.
|
|
||
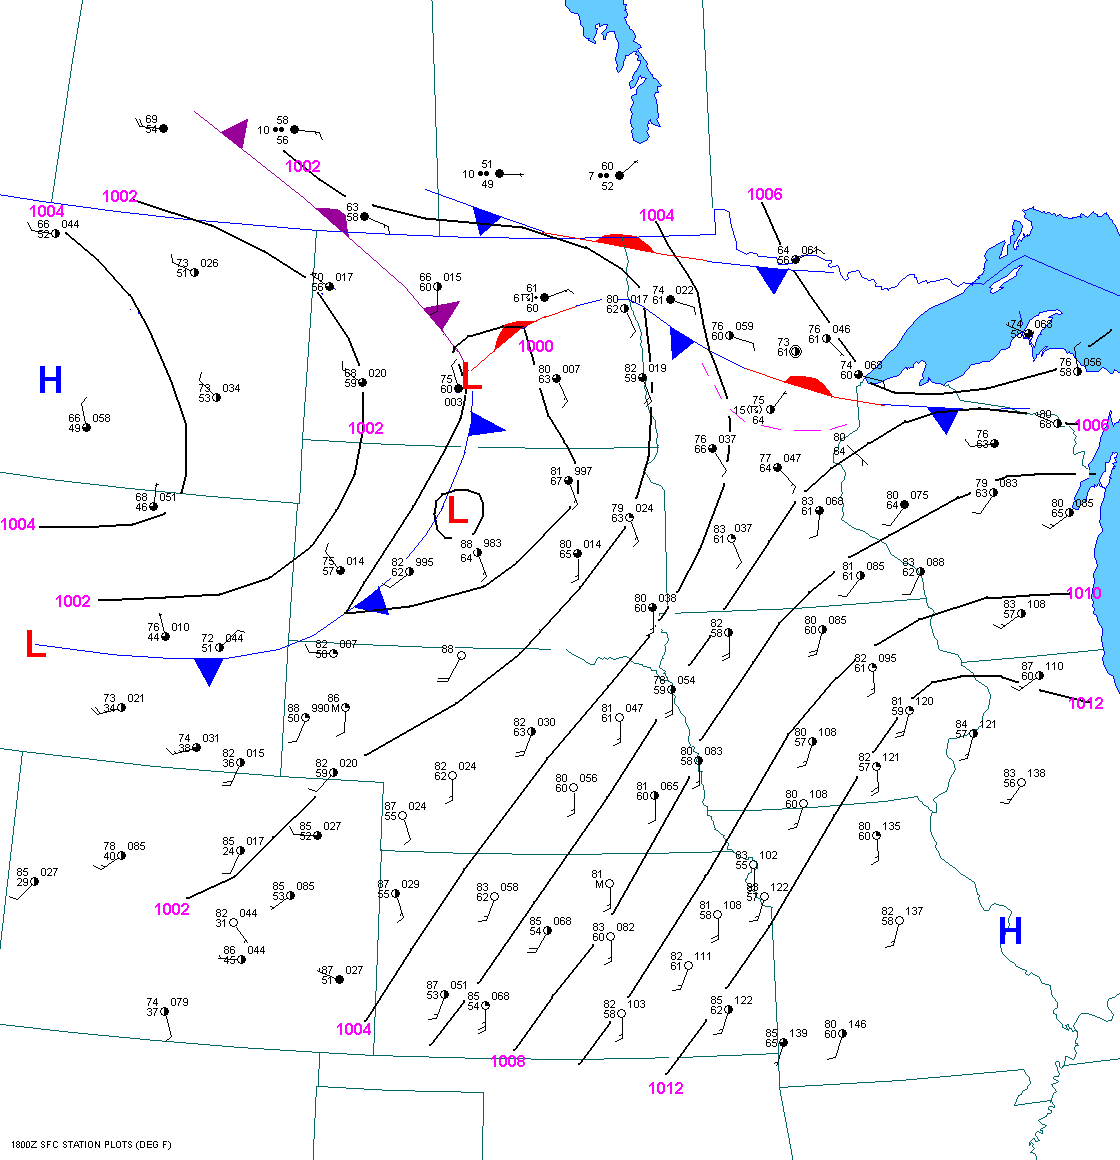 12 PM CST |
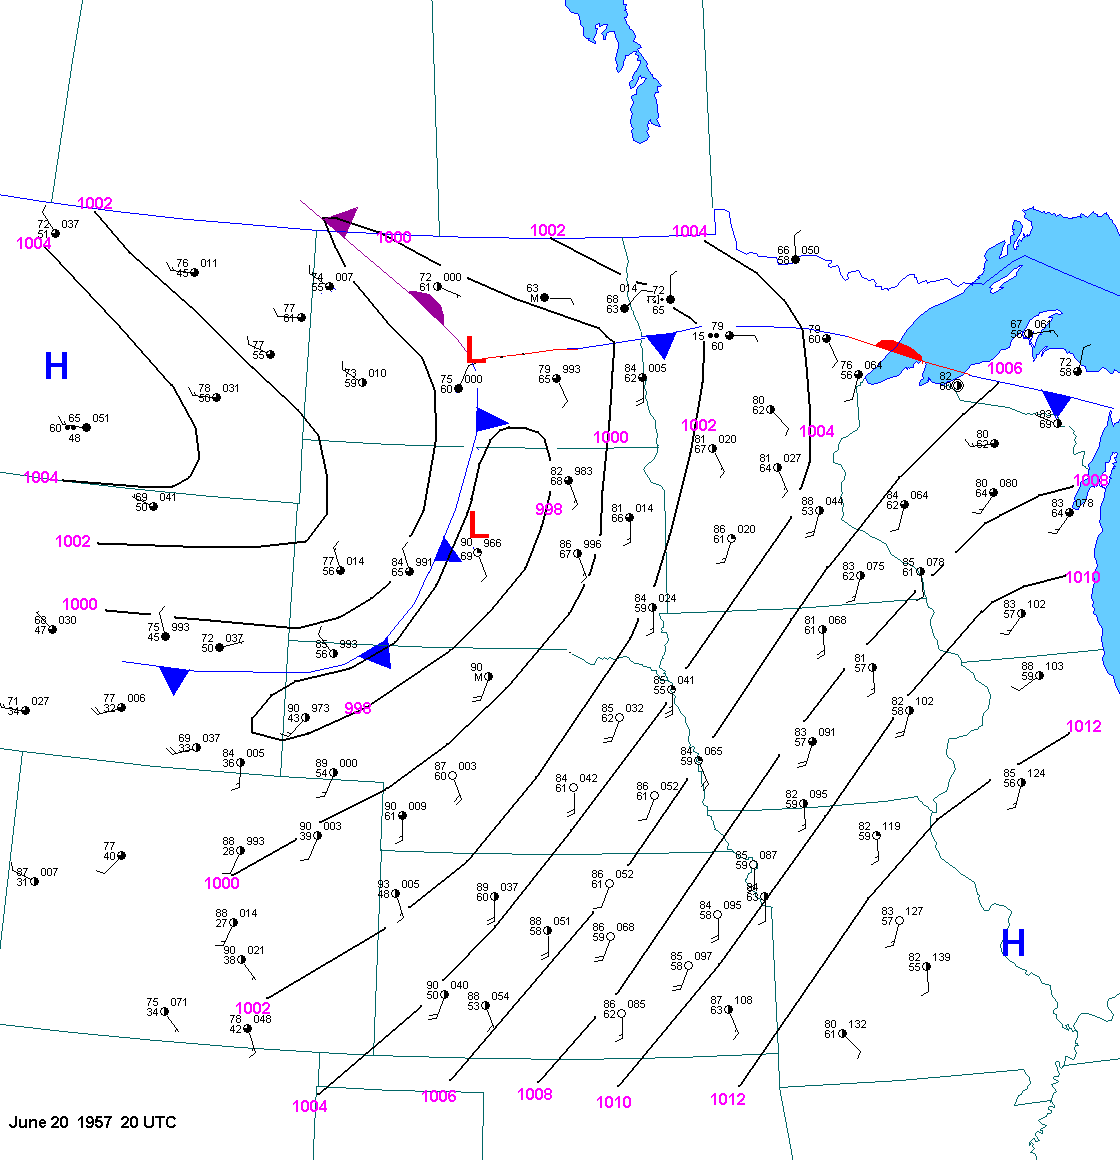 2 PM CST |
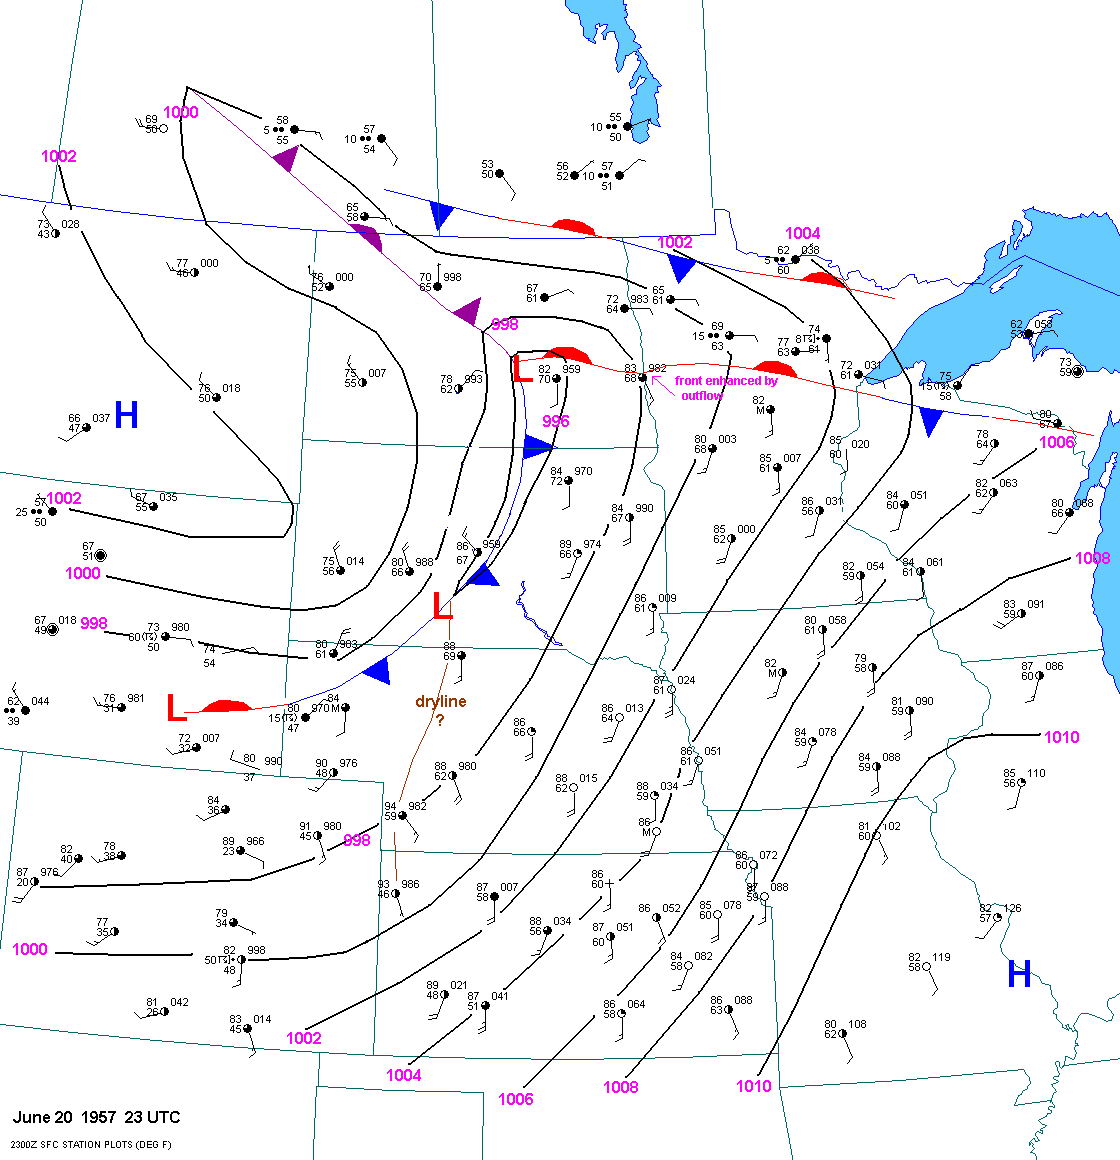 5 PM CST |
US Dept of Commerce
National Oceanic and Atmospheric Administration
National Weather Service
Grand Forks, ND
4797 Technology Circle
Grand Forks, ND 58203-0600
701-772-0720
Comments? Questions? Please Contact Us.

