Temperature and precipitation outlooks for the 6-10 day and 8-14 day periods. Issued daily by the NOAA/NWS Climate Prediction Center. The outlooks express forecast probability that temperatures or total precipitation in the 6-10 or 8-14 day period will tend to be similar to the 10-highest ("above-normal"), middle-10 ("near-normal"), or 10-lowest ("below-normal") observed in the 1981-2010 normals period. Color shading on the outlook maps follows standard convention for warmer/colder or wetter/drier, with near-normal in white. Darker shades of red or blue (or green and brown) indicate a higher forecast probability.
6-10 Day Outlook
8-14 Day Outlook
Temperature
Precipitation
Temperature
Precipitation
One Month and Three-Month temperature and precipitation outlooks. The outlooks are issued by the Climate Prediction Center on the last day of each month (valid for the following month), with an update to the outlook on the third Thursday of the following month. The monthly and seasonal outlooks are similar to the 6-10 and 8-14 day outlooks. However, in areas where "Equal Chances" (EC) is shown, it means that climate signals do not favor either above- or below-normal, and above-, near-, or below-normal forecast categories are equally likely to occur. A forecast of Equal Chances does NOT necessarily mean forecast conditions are expected to be near-normal.
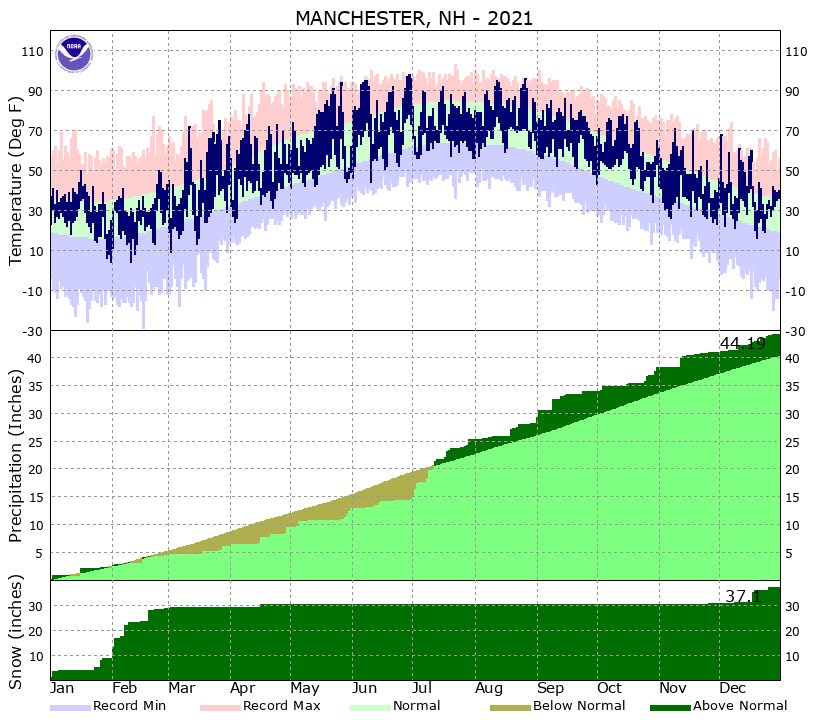
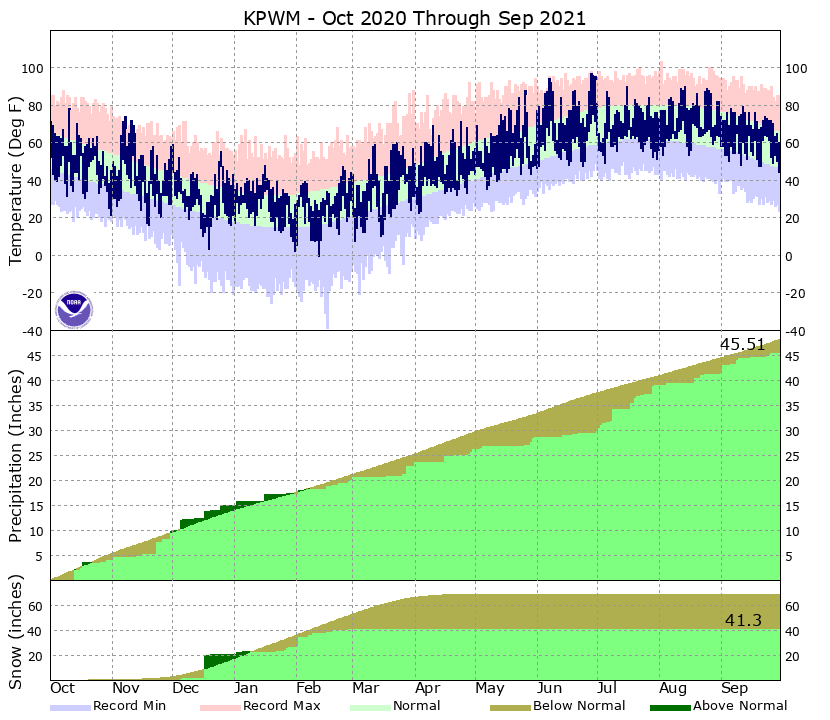
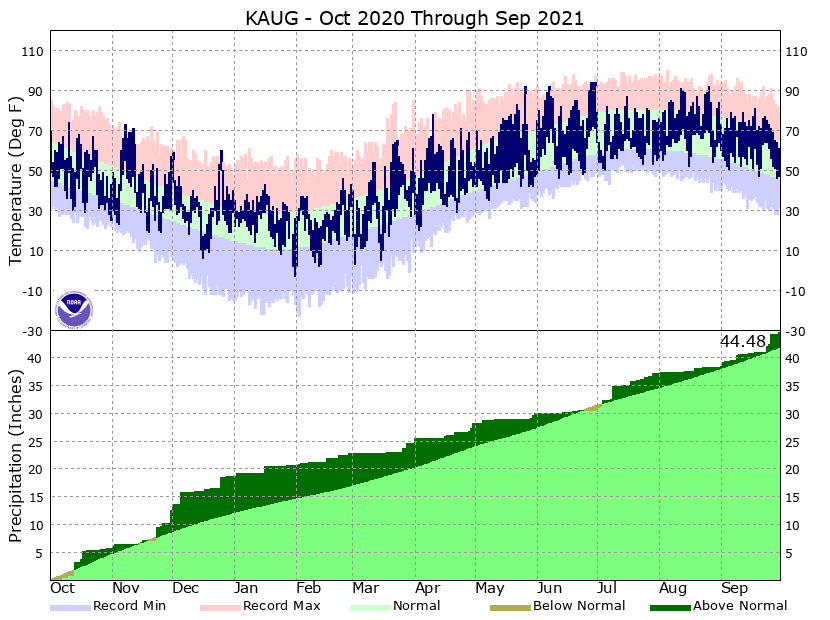
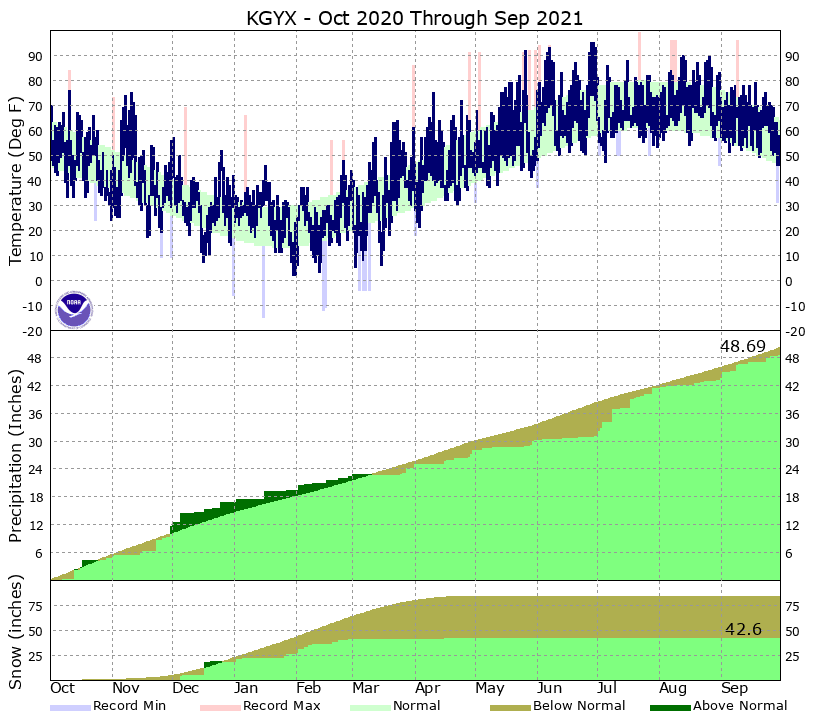
NOWData (NOAA Online Weather Data) is a user interface available to access a variety of location-based climate information and records for NWS Gray's area of responsibility.
Here are some step-by-step instructions for using NOWData:
Location >>
Select a location by simply clicking on a location name in the list, or press the "View Map" button to bring up a map of locations.
Product >>
Select one of nine available climate products using the radio buttons. A description of each product can be found in the yellow "Product Description" section.
Options >>
Select from a host of options that will be available to you. Options will vary depending on which product you chose in Step 2.
For products which have a "Year Range:", typing in the phrase "por" for a starting range will return information across that location's period of record.
View >>
Press the "Go" button, and a seperate window will pop open to view your specified climate product, location and options.


