
Note: The map above represents the expected average accumulation. Some locations will receive less snow, while others will receive more. In addition, the "Event Total" time range may differ from the time range of the "Expected Snowfall" on our winter page, which covers a 72-hour period. Reference the subtitle on the "Event Total" graphic for the time period covered.
| Selected City Charts | |
Expected Snowfall - Box and Whisker Plot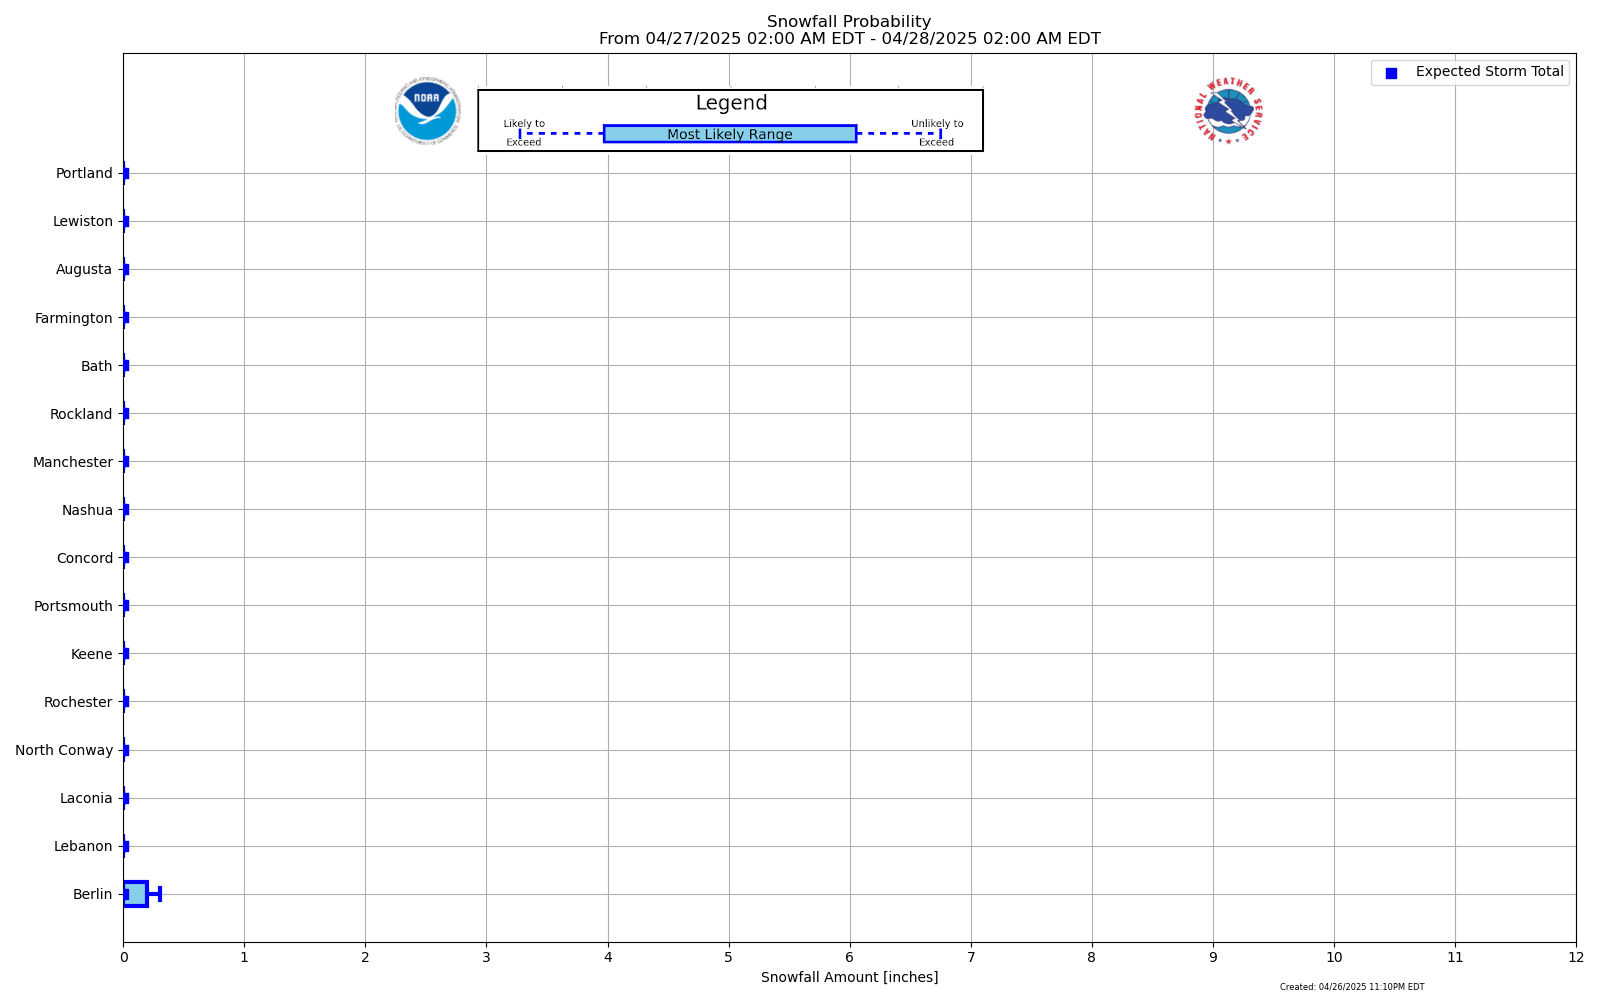 |
Expected Snowfall - Exceedance Bar Plot |

