Welcome To Our Introduction Into The New "Climate Normals" & What They Mean For Our Area!
Click through the tabs below for information about how the new normals were calculated, what the changes were, and what that means for climate data for Cincinnati, Columbus, and Dayton!
|
Updated once every 10 years, U.S. Climate Normals are one of NOAA's most anticipated and popular products! |
|
|
|
|
|
Who Produces Normals? |
Normal values are produced by the National Centers for Environmental Information (NCEI) |
|
|
|
|
What Are Normals? |
Climate normals are three-decade averages of climatological variables, such as temperature and precipitation. However, they are not just simply 30-year averages of monthly or daily observations. Many stations do not have complete observations for the full 30-year period. For daily and monthly normals in particular, complex estimation and scaling procedures are used with temperature and precipitation to ensure they are representing the full 30-year period and are internally consistent. Normals serve two purposes: a reference period for monitoring current weather and climate, and a good description of the expected climate at a location over the seasons. Normals provide a basis for determining whether today’s weather is warmer or colder, wetter or drier. They also can be used to plan for conditions beyond the time span of reliable weather forecasts. |
|
|
|
|
Have The Calculations Of Normals Changed? |
The science begins the normals is essentially the same as for the 1981-2010 calculations, with only minor calculation technique updates (to follow technical changes in accordance with the World Meteorological Organization (WMO) Normals Calculation Guidelines) and a change in output formats to .csv files. |
|
|
|
|
Why Are Normals Calculated For A 30-Year Period? |
A 30-year time period was chosen by the governing body of international meteorology in the 1930s, so the first normals were for 1901-1930, the longest period for which most countries had reliable climate records. International normals were called for in 1931-1960 and 1961-1990, but many countries updated normals more frequently, every 10 years, so as to keep them up to date. In 2015 this was made the WMO standard, so all countries will be creating normals for 1991-2020. |
|
|
|
|
Other Useful Resources |
|
|
|
|
 |
 |
|
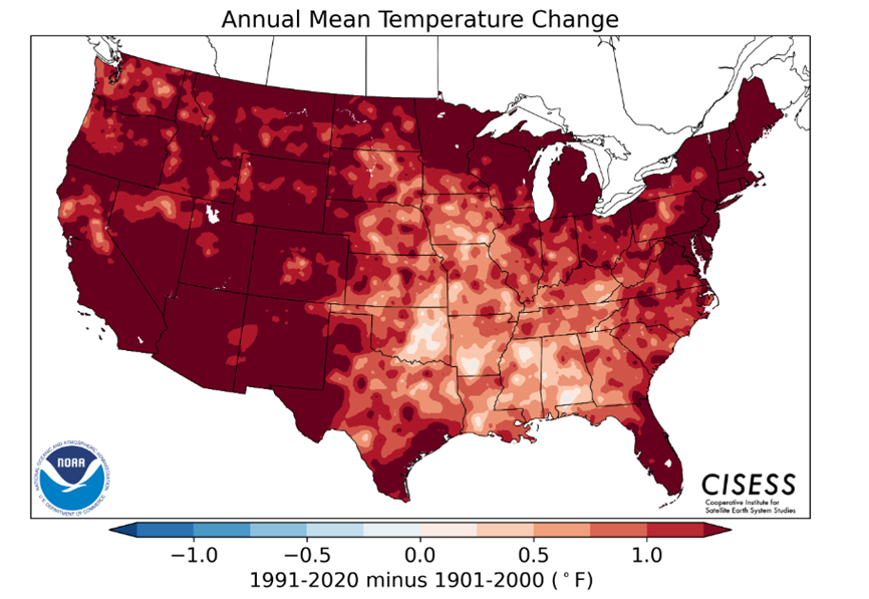
Map shows the spatial change (degrees Fahrenheit) in temperature between the most recent/current "normal" period of 1991-2020 compared to the period of 1901-2000. |
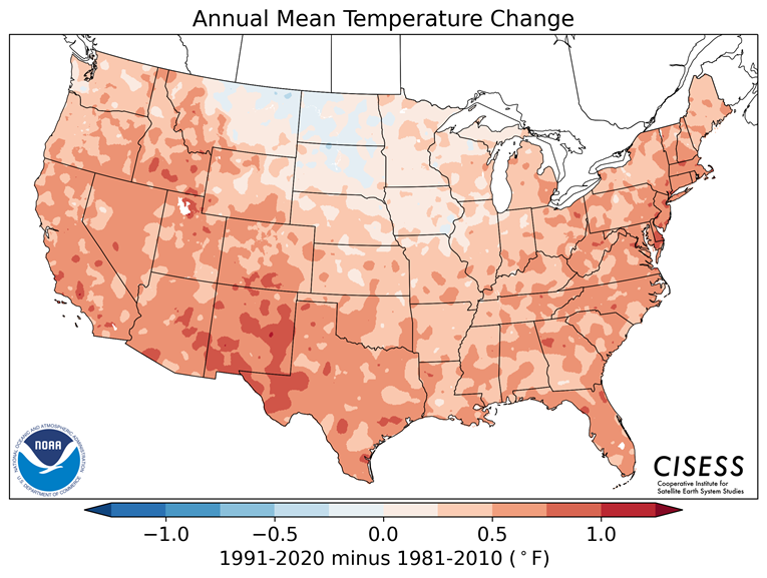
Map shows the spatial change (degrees Fahrenheit) in temperature between the most recent/current "normal" period of 1991-2020 and the 1981-2010 normals. |
|
|
|
 |
 |
|
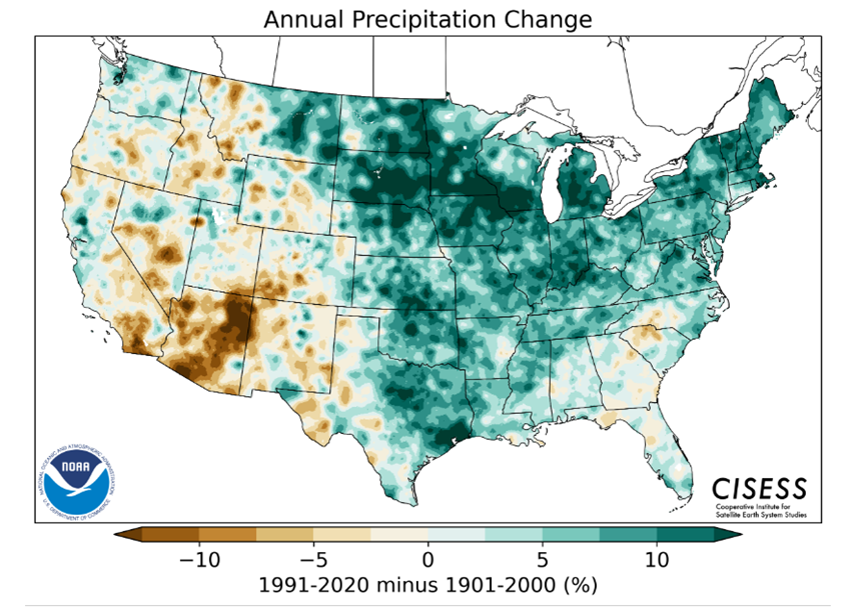
Map shows the spatial percent (%) difference in precipitation between the most recent/current "normal" period of 1991-2020 compared to the period of 1901-2000. |
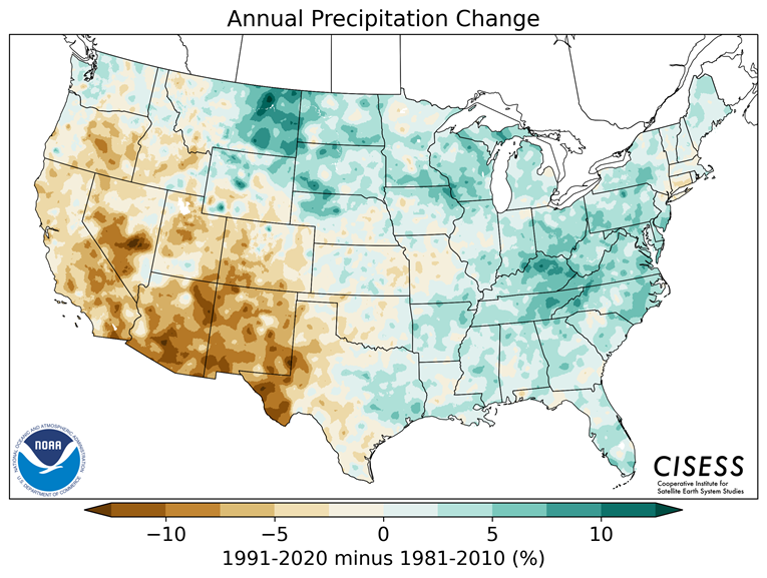
Map shows the spatial percent (%) difference in precipitation between the most recent/current "normal" period of 1991-2020 and the 1981-2010 normals. |
|
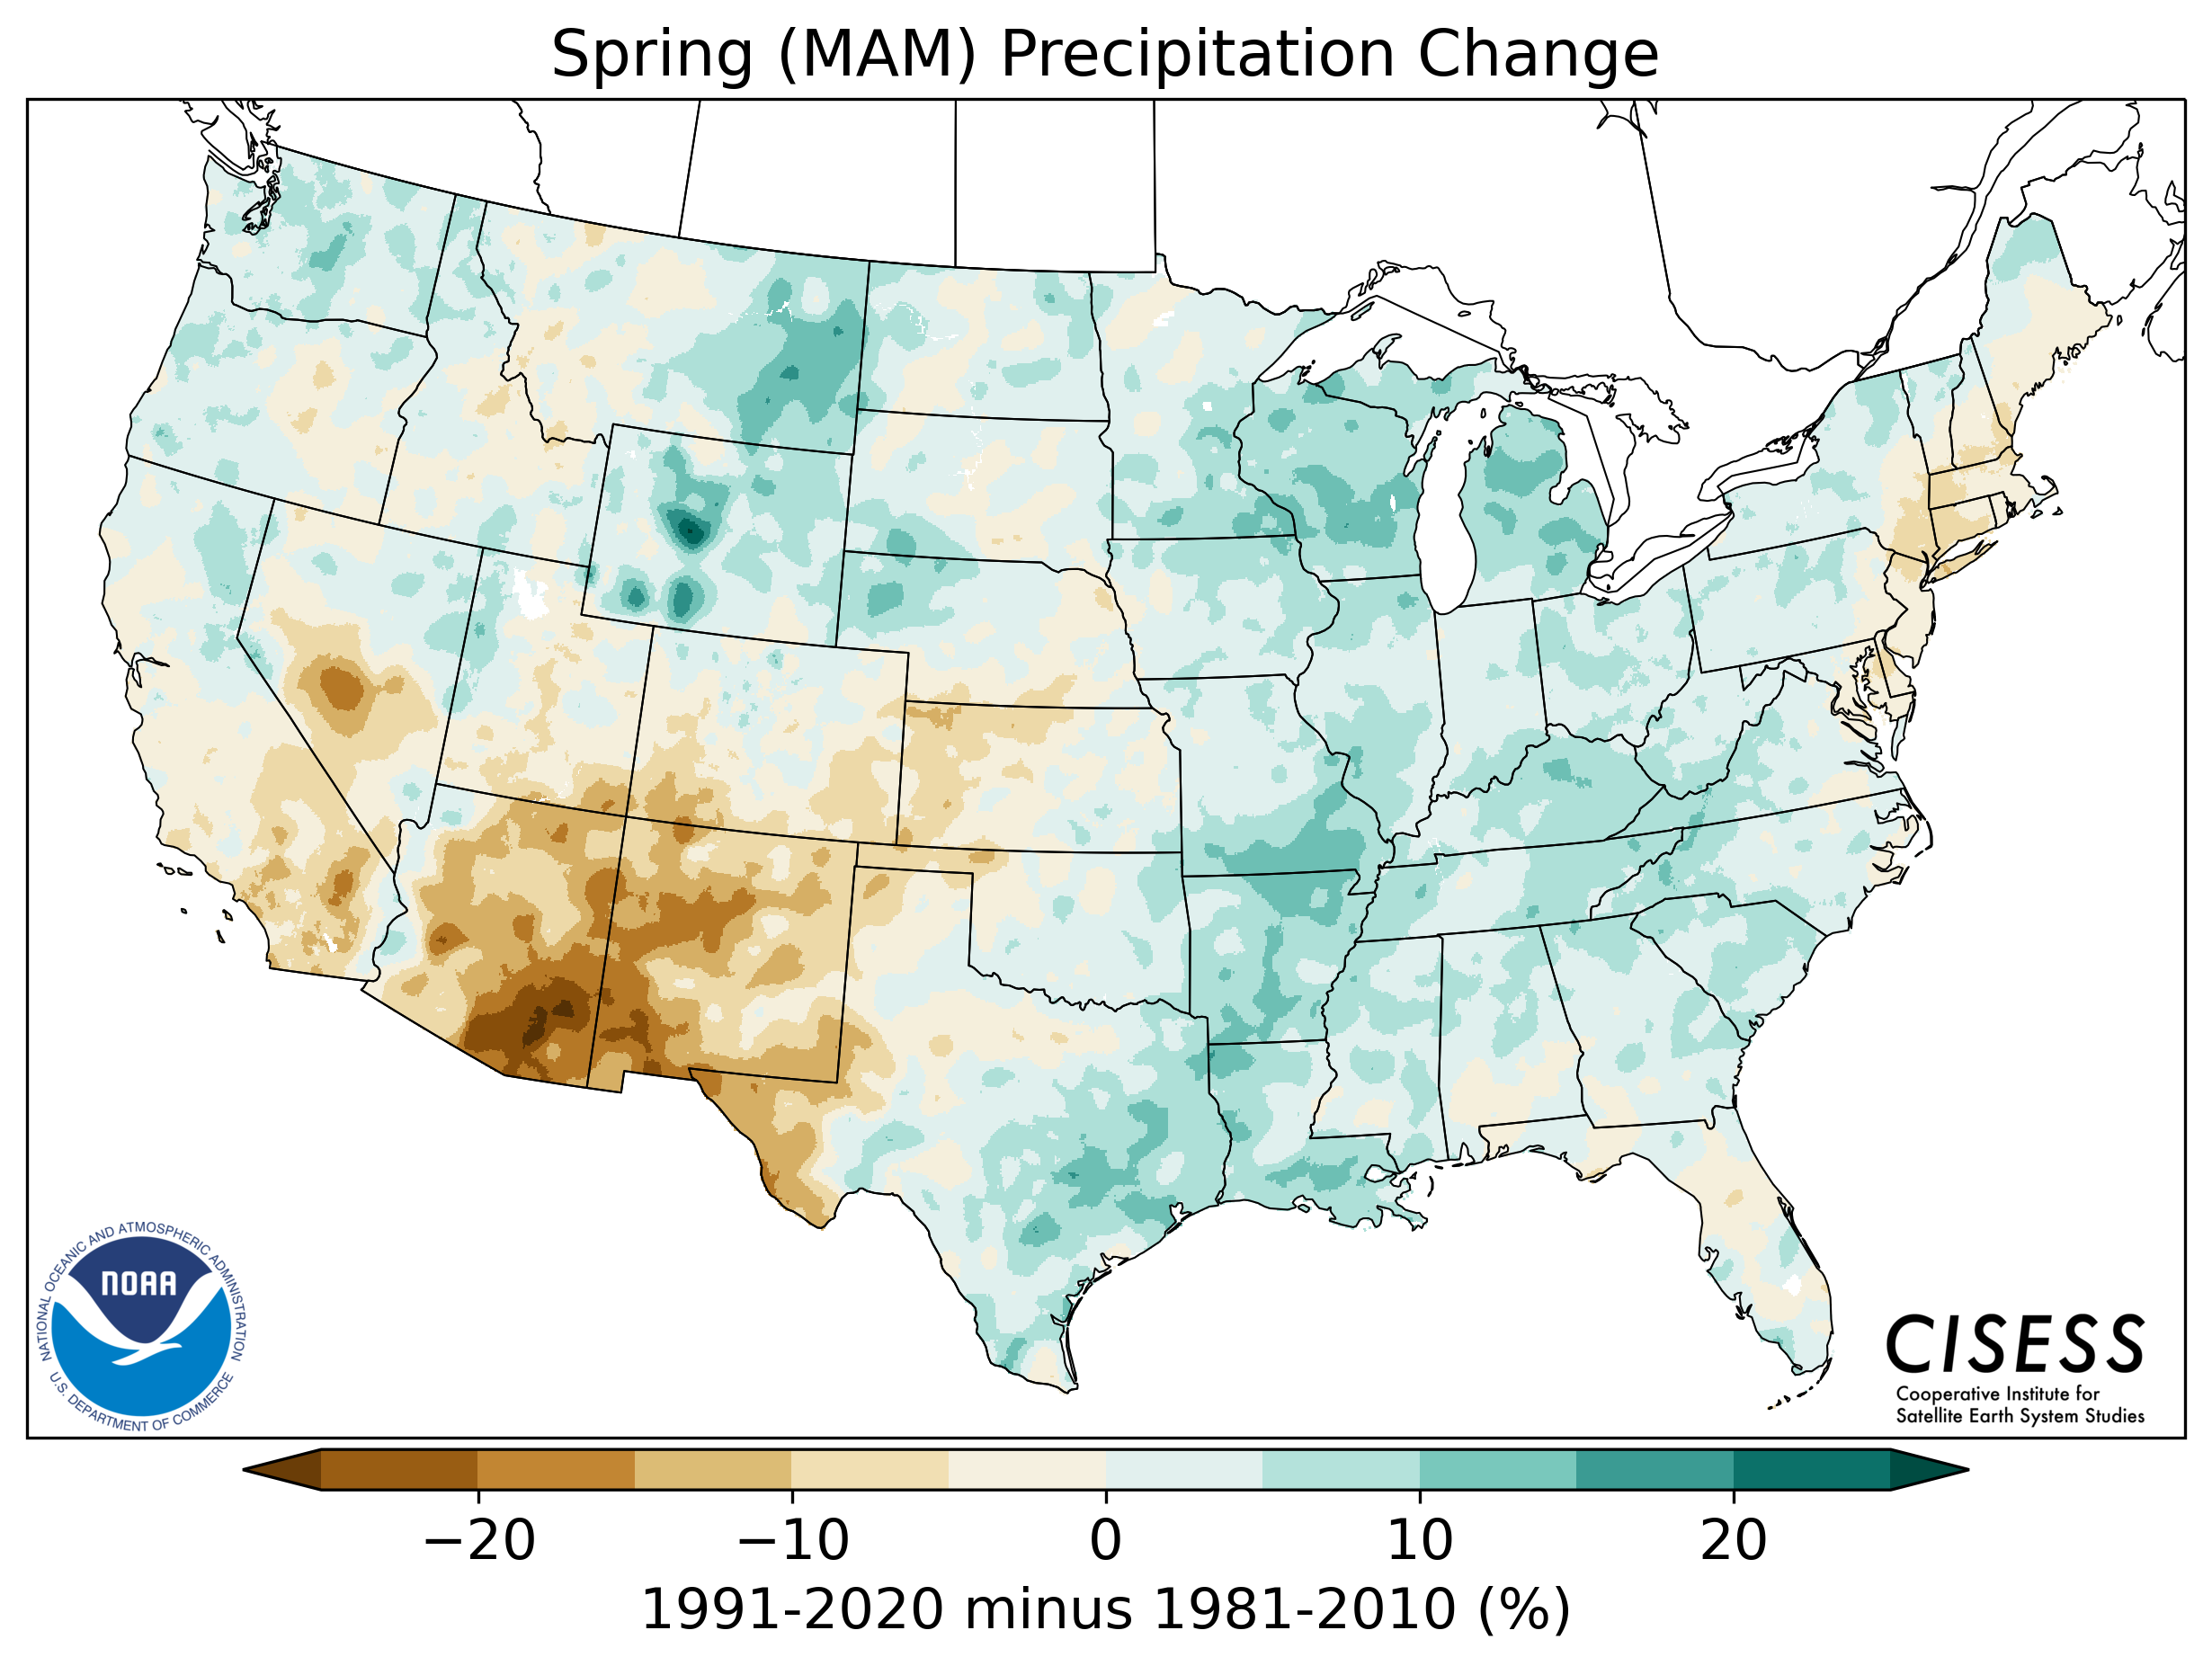
Spring (March-April-May) |
||
|
|
||
 |
||
|
Map shows the spatial percent (%) difference in precipitation between the most recent/current "normal" period of 1991-2020 compared to the "normal" period of 1981-2010 during the spring months. |
||
|
|
||
 |
 |
 |
|
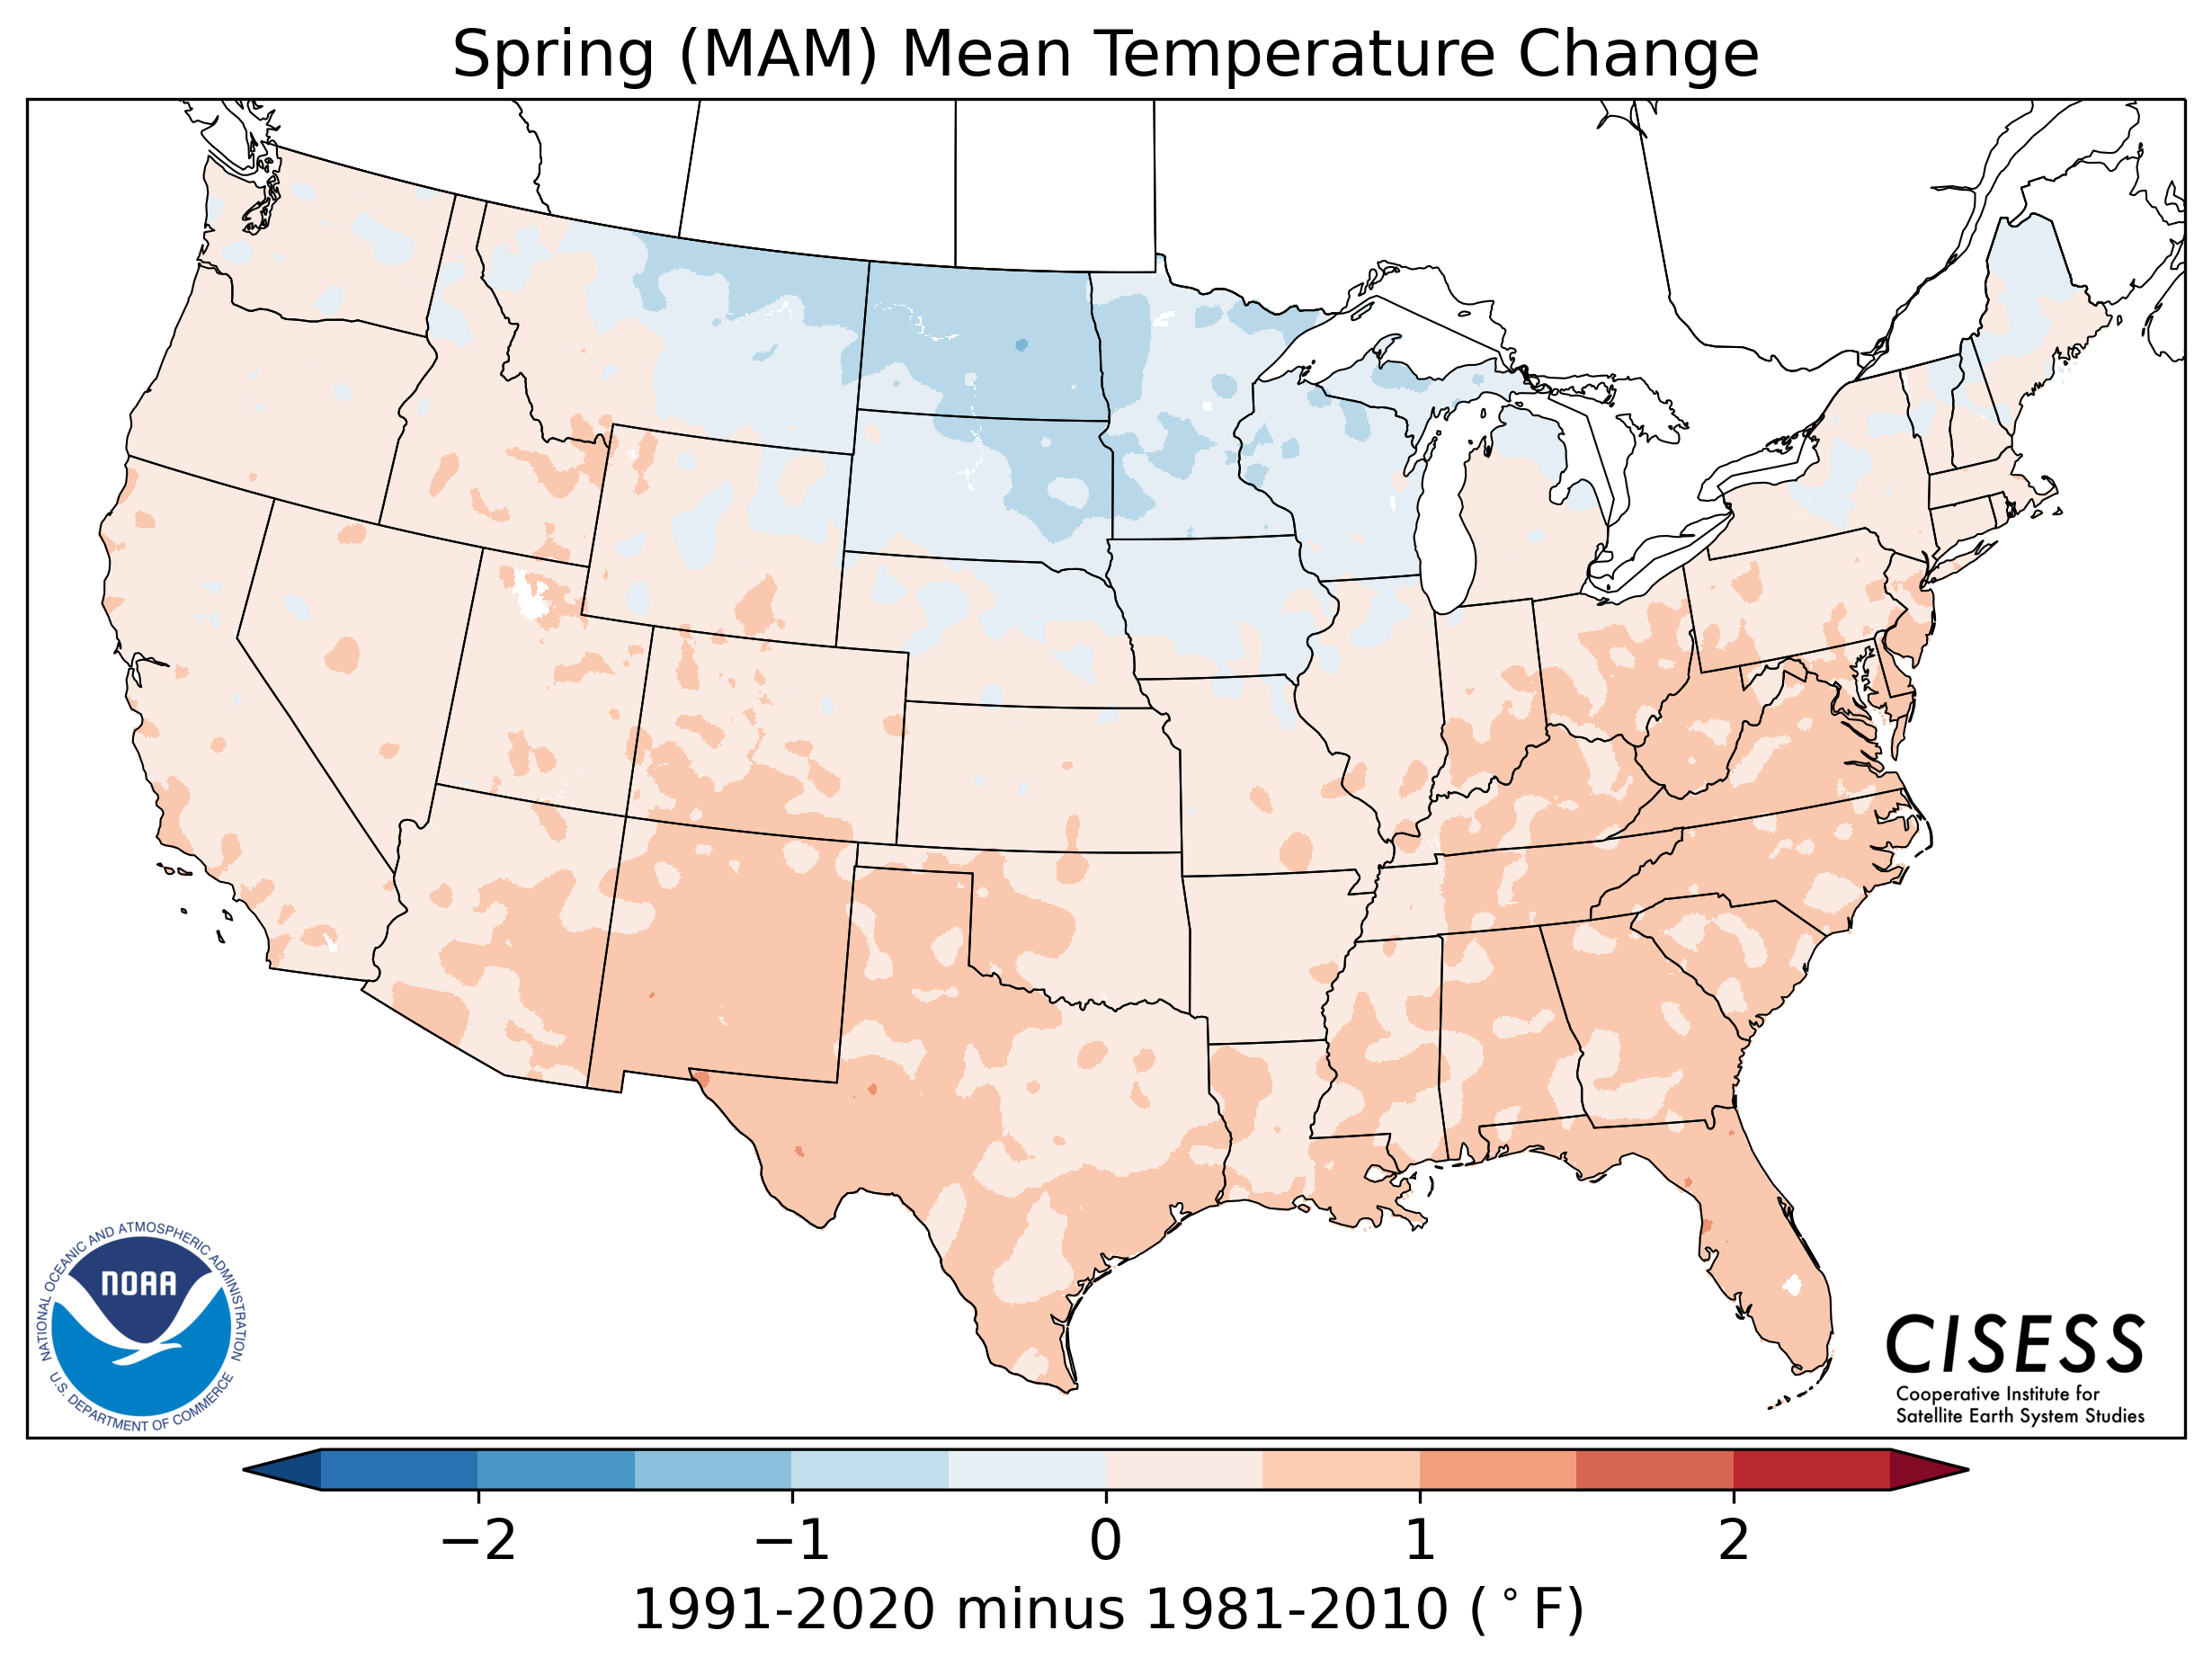
Map shows the spatial change (degrees Fahrenheit) in daily average temperature between the most recent/current "normal" period of 1991-2020 and the 1981-2010 normals during the spring months. |
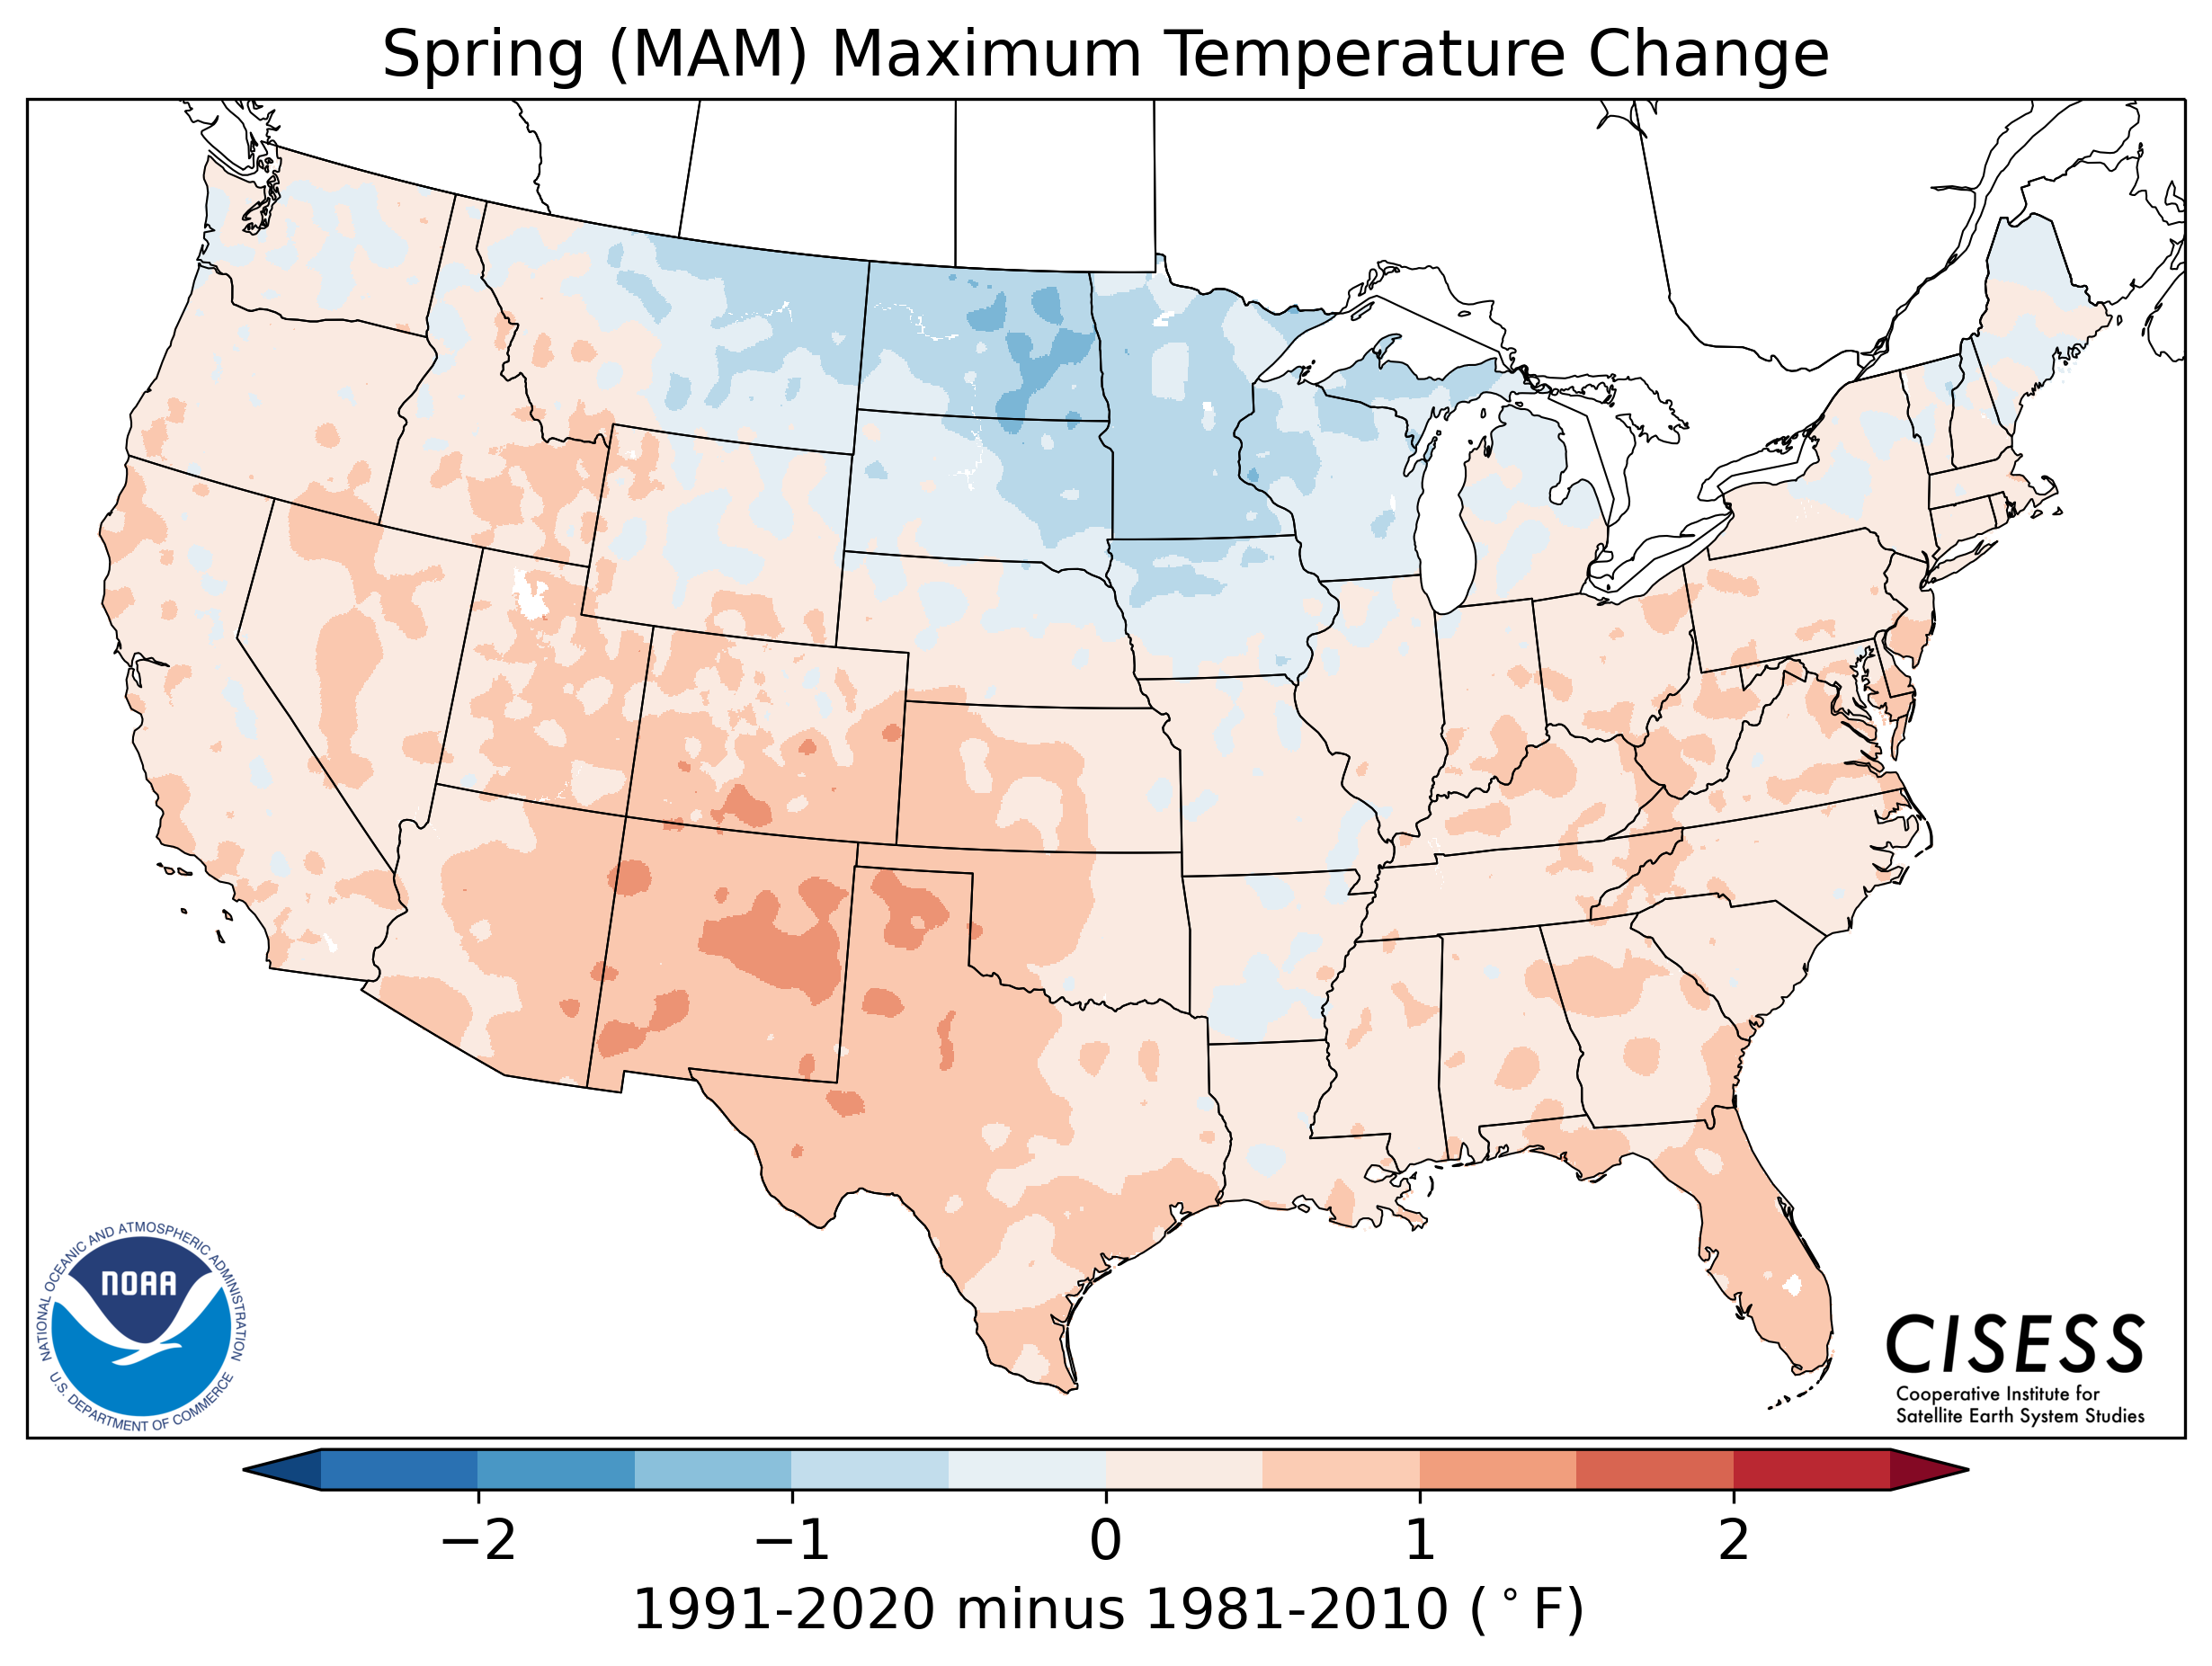
Map shows the spatial change (degrees Fahrenheit) in daily maximum temperature between the most recent/current "normal" period of 1991-2020 and the 1981-2010 normals during the spring months. |
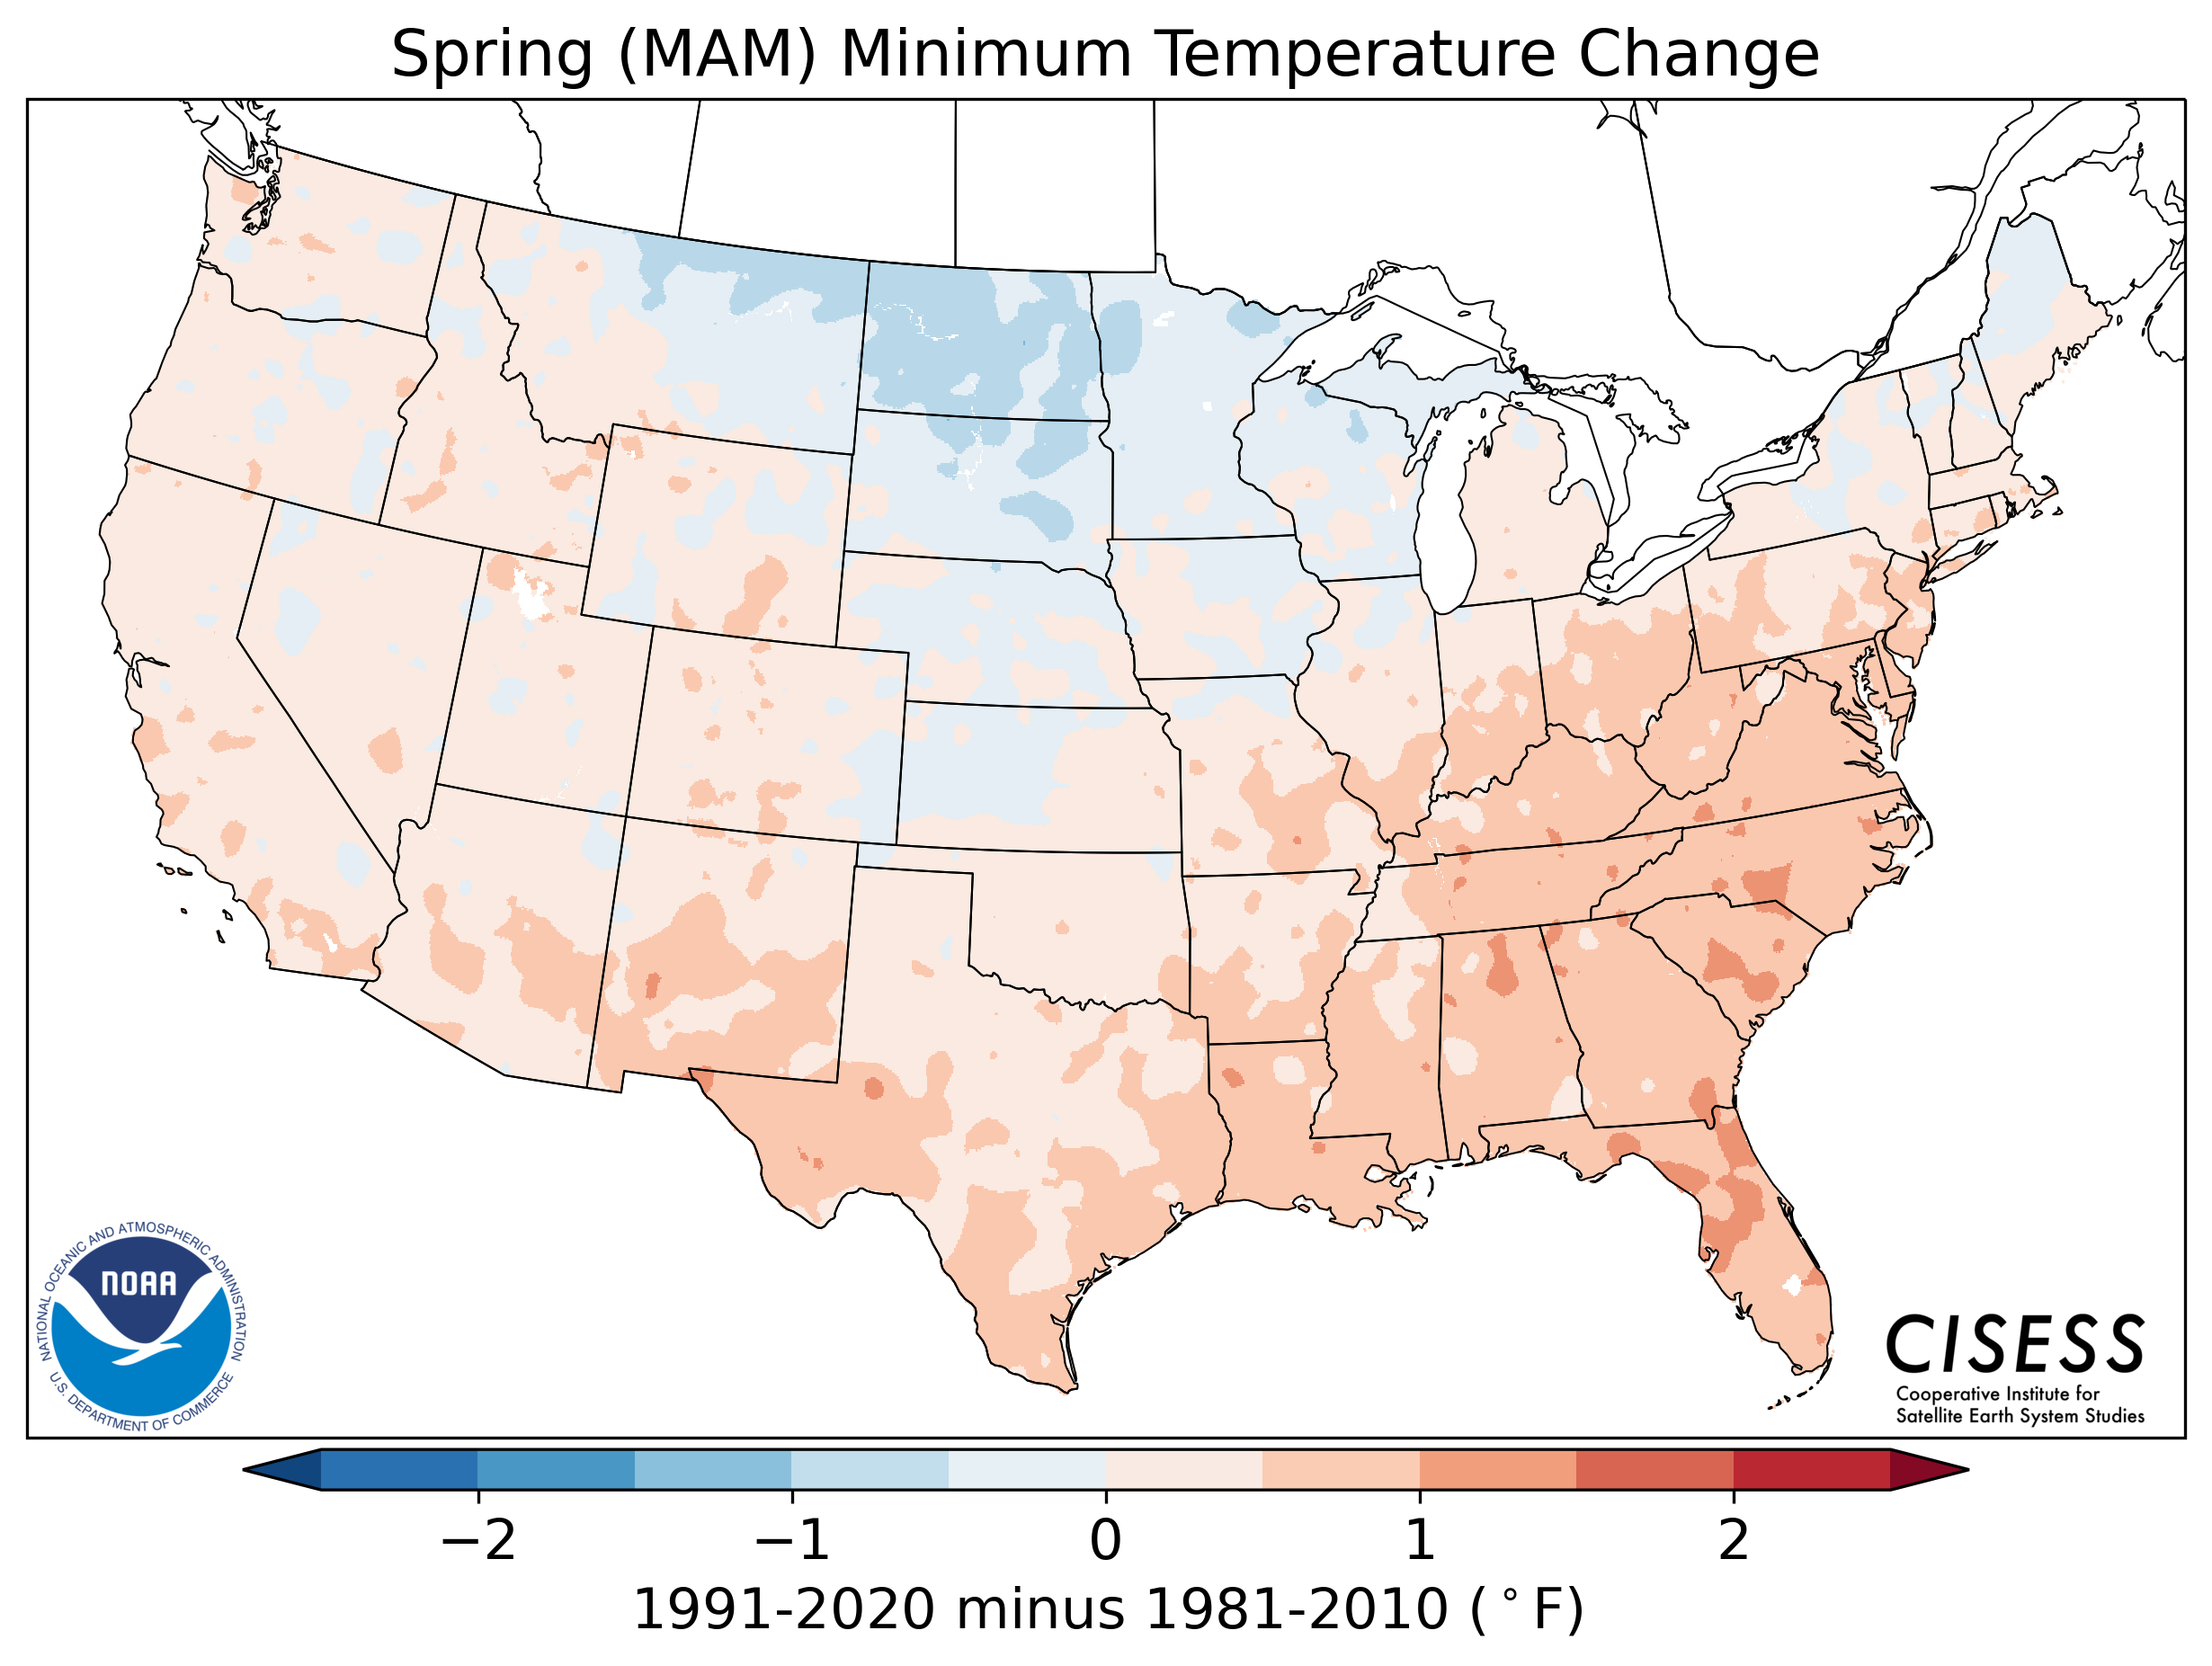
Map shows the spatial change (degrees Fahrenheit) in daily minimum temperature between the most recent/current "normal" period of 1991-2020 and the 1981-2010 normals during the spring months. |
|
|
||
|
Summer (June-July-August) |
||
|
|
||
 |
||
|
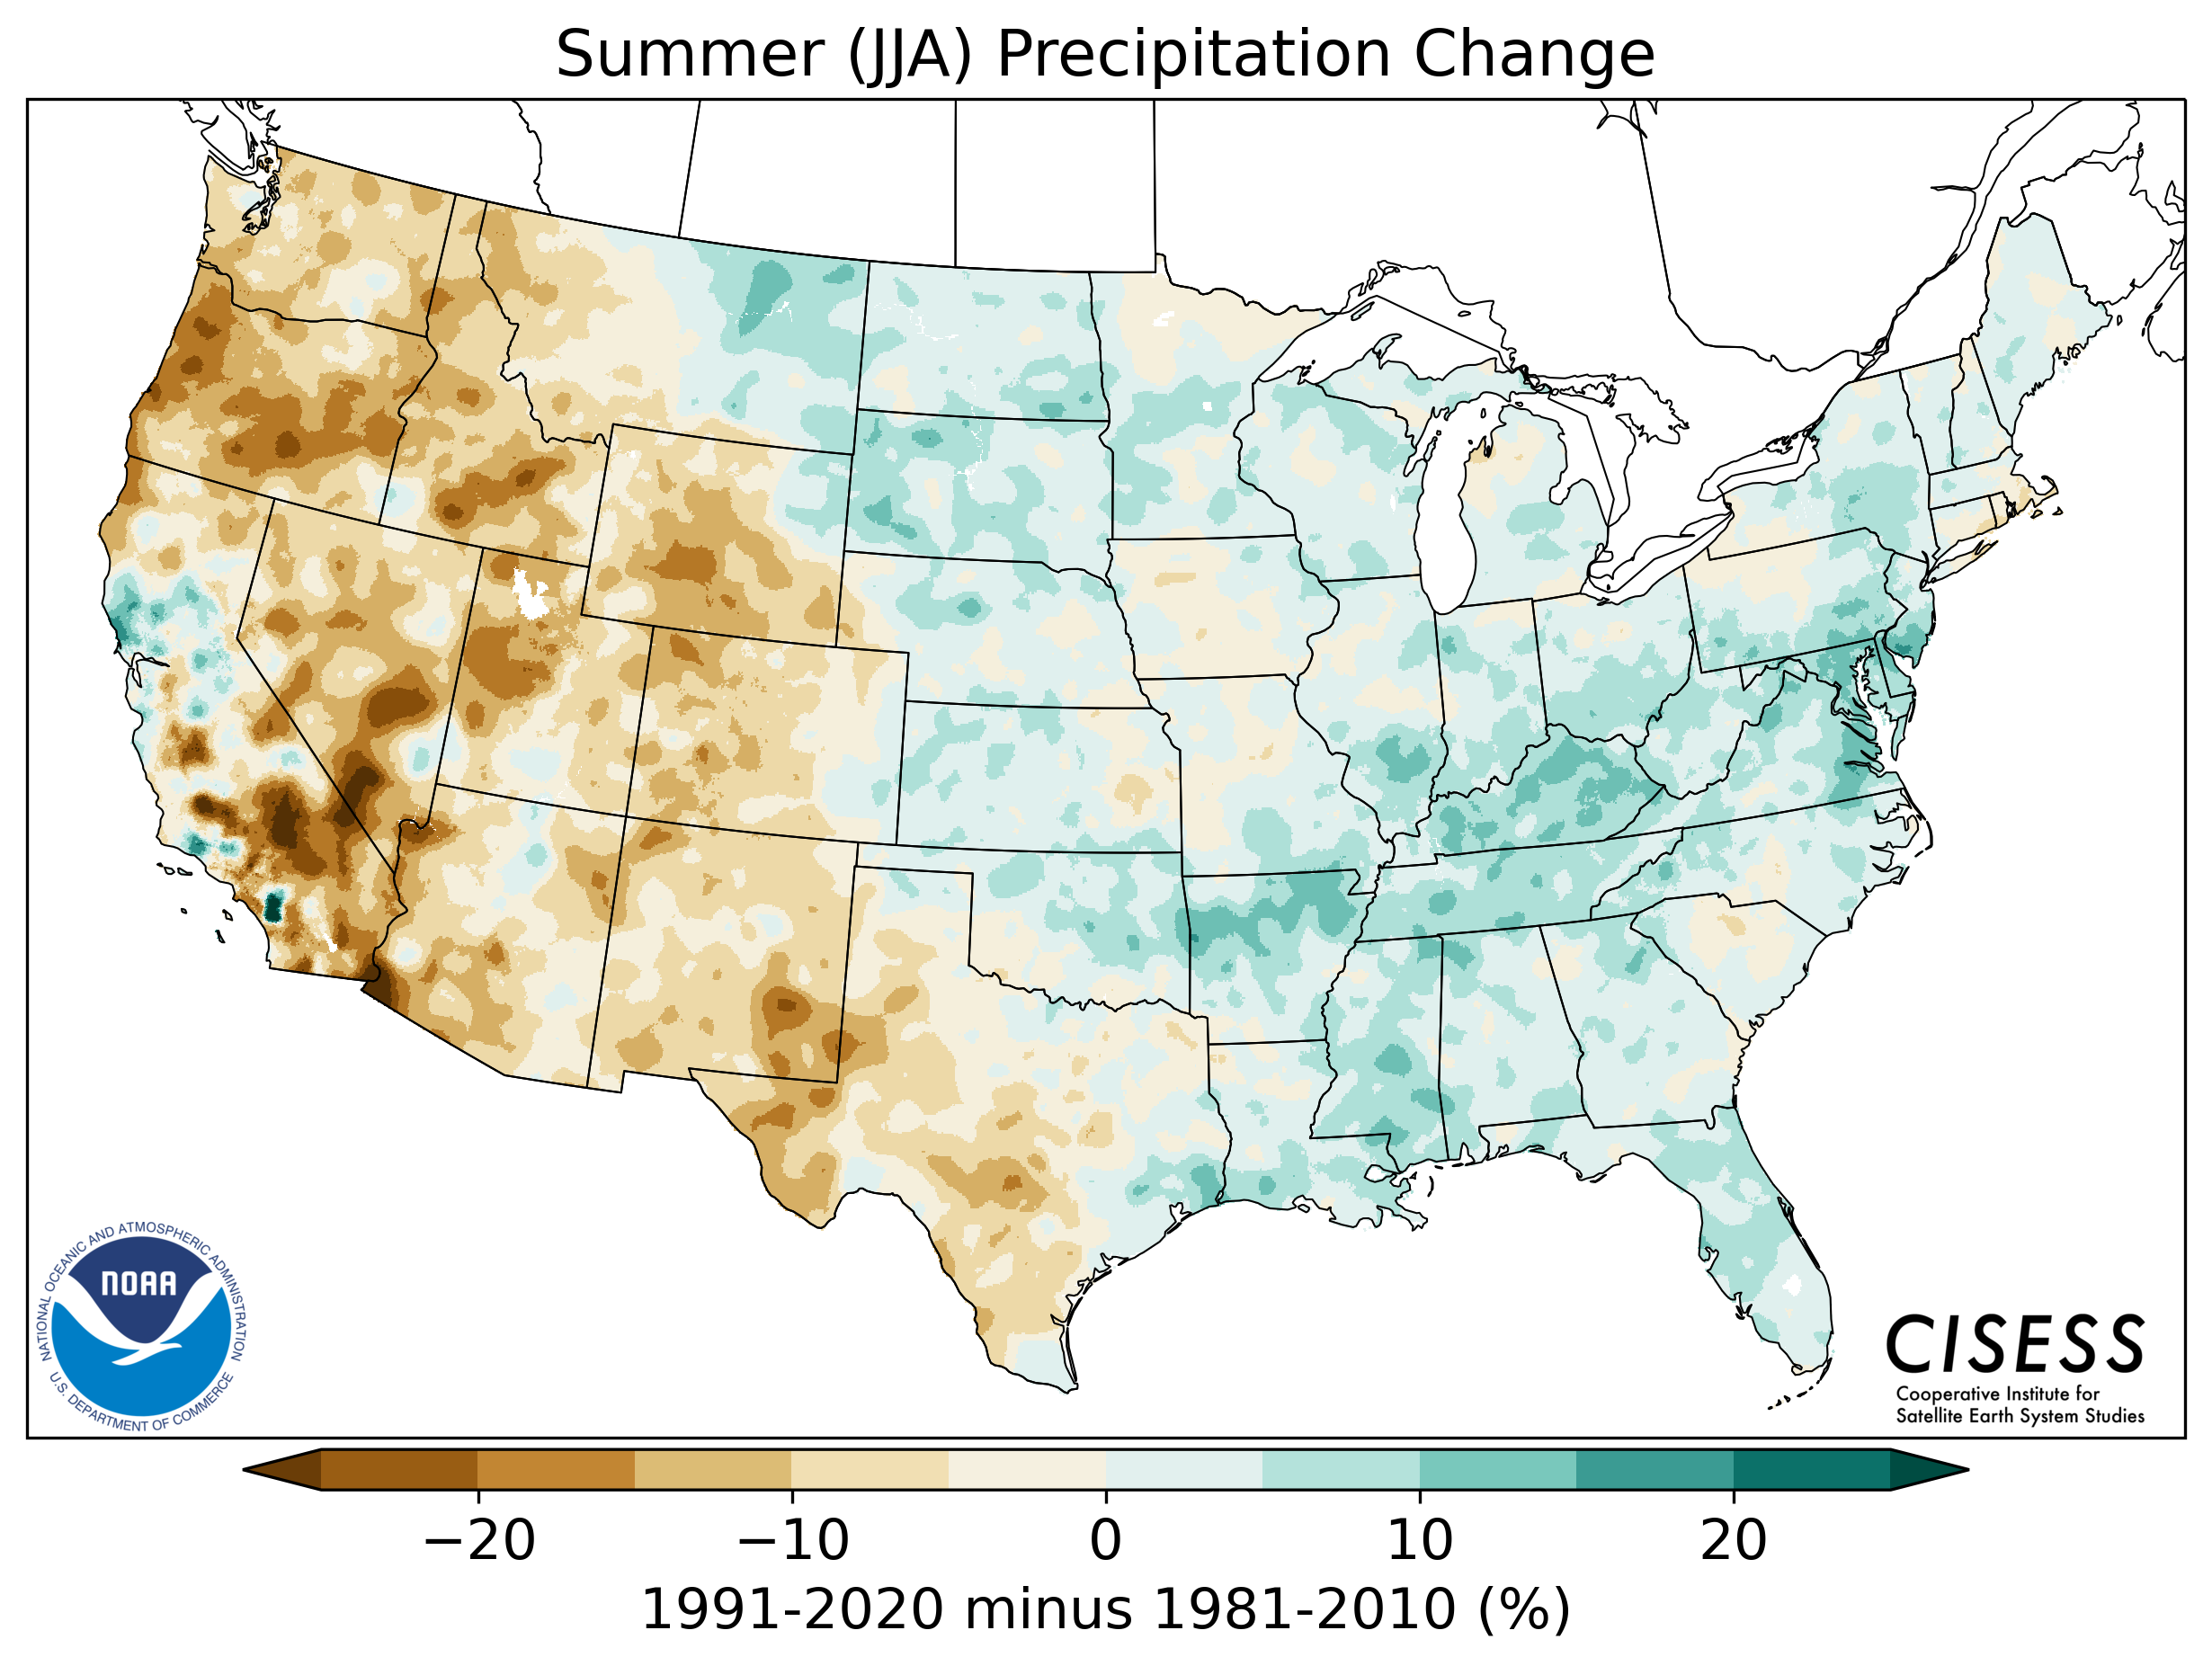
Map shows the spatial percent (%) difference in precipitation between the most recent/current "normal" period of 1991-2020 compared to the "normal" period of 1981-2010 during the summer months. |
||
|
|
||
 |
 |
 |
|
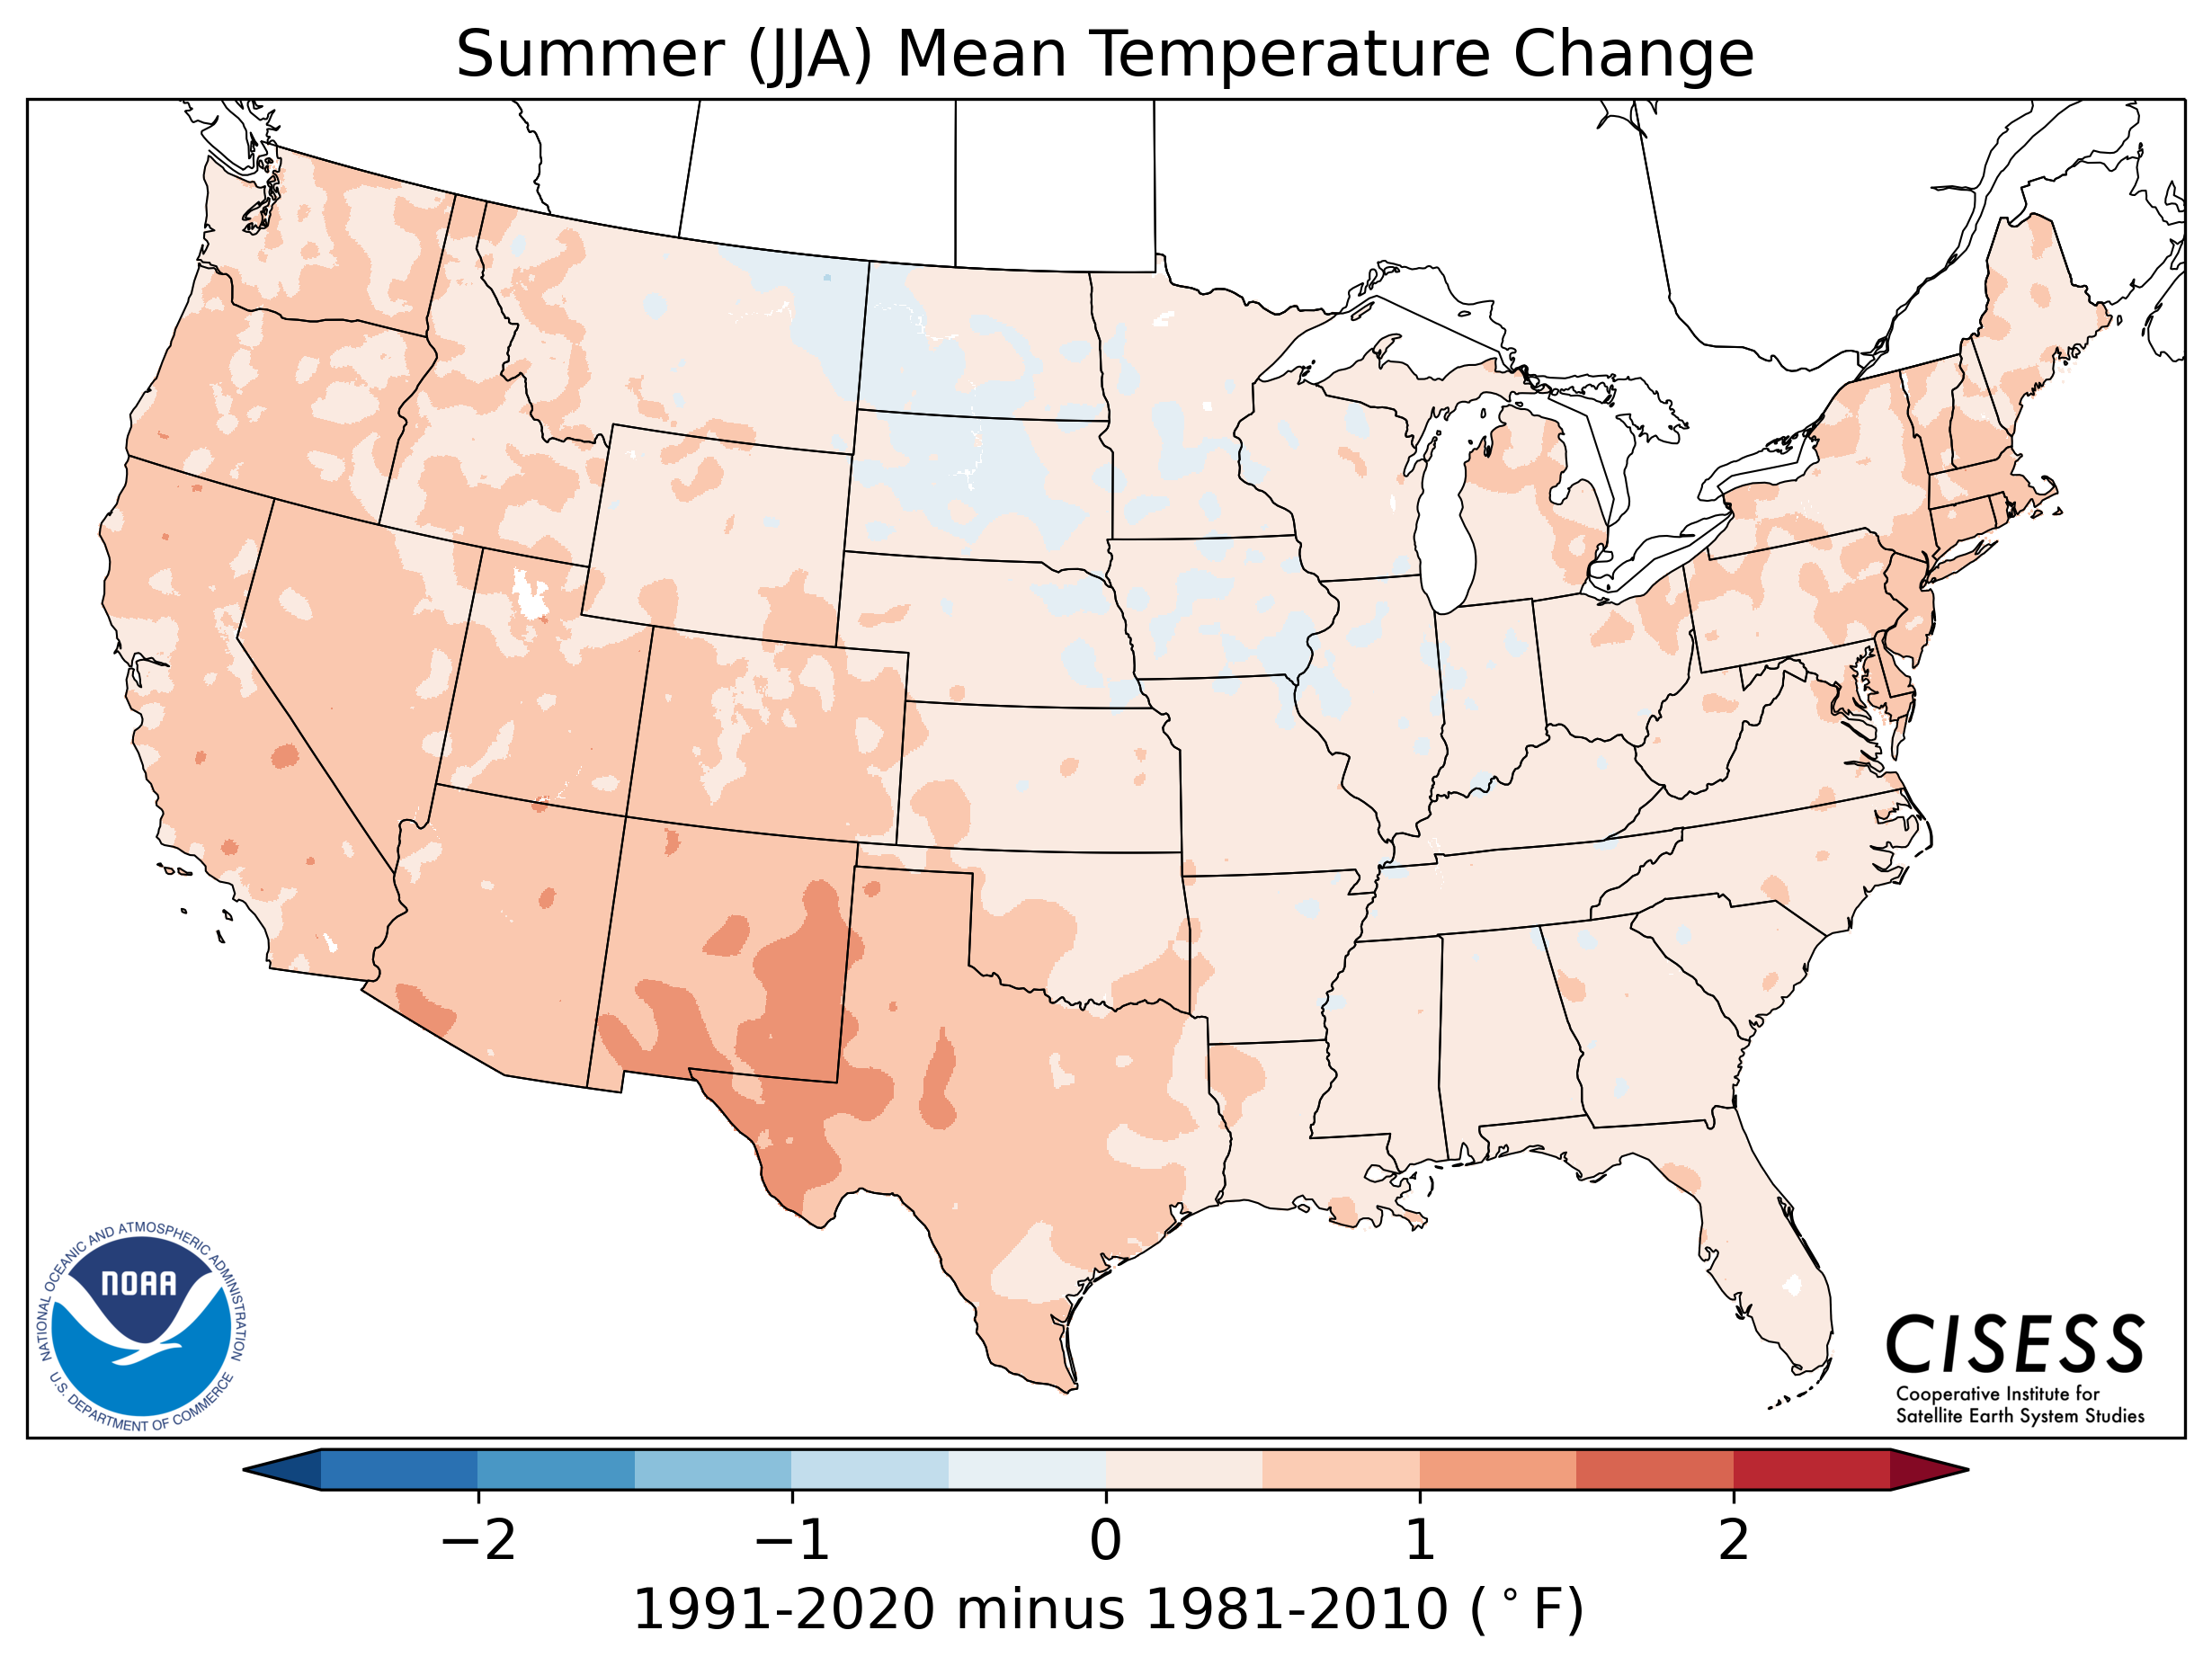
Map shows the spatial change (degrees Fahrenheit) in daily average temperature between the most recent/current "normal" period of 1991-2020 and the 1981-2010 normals during the summer months. |
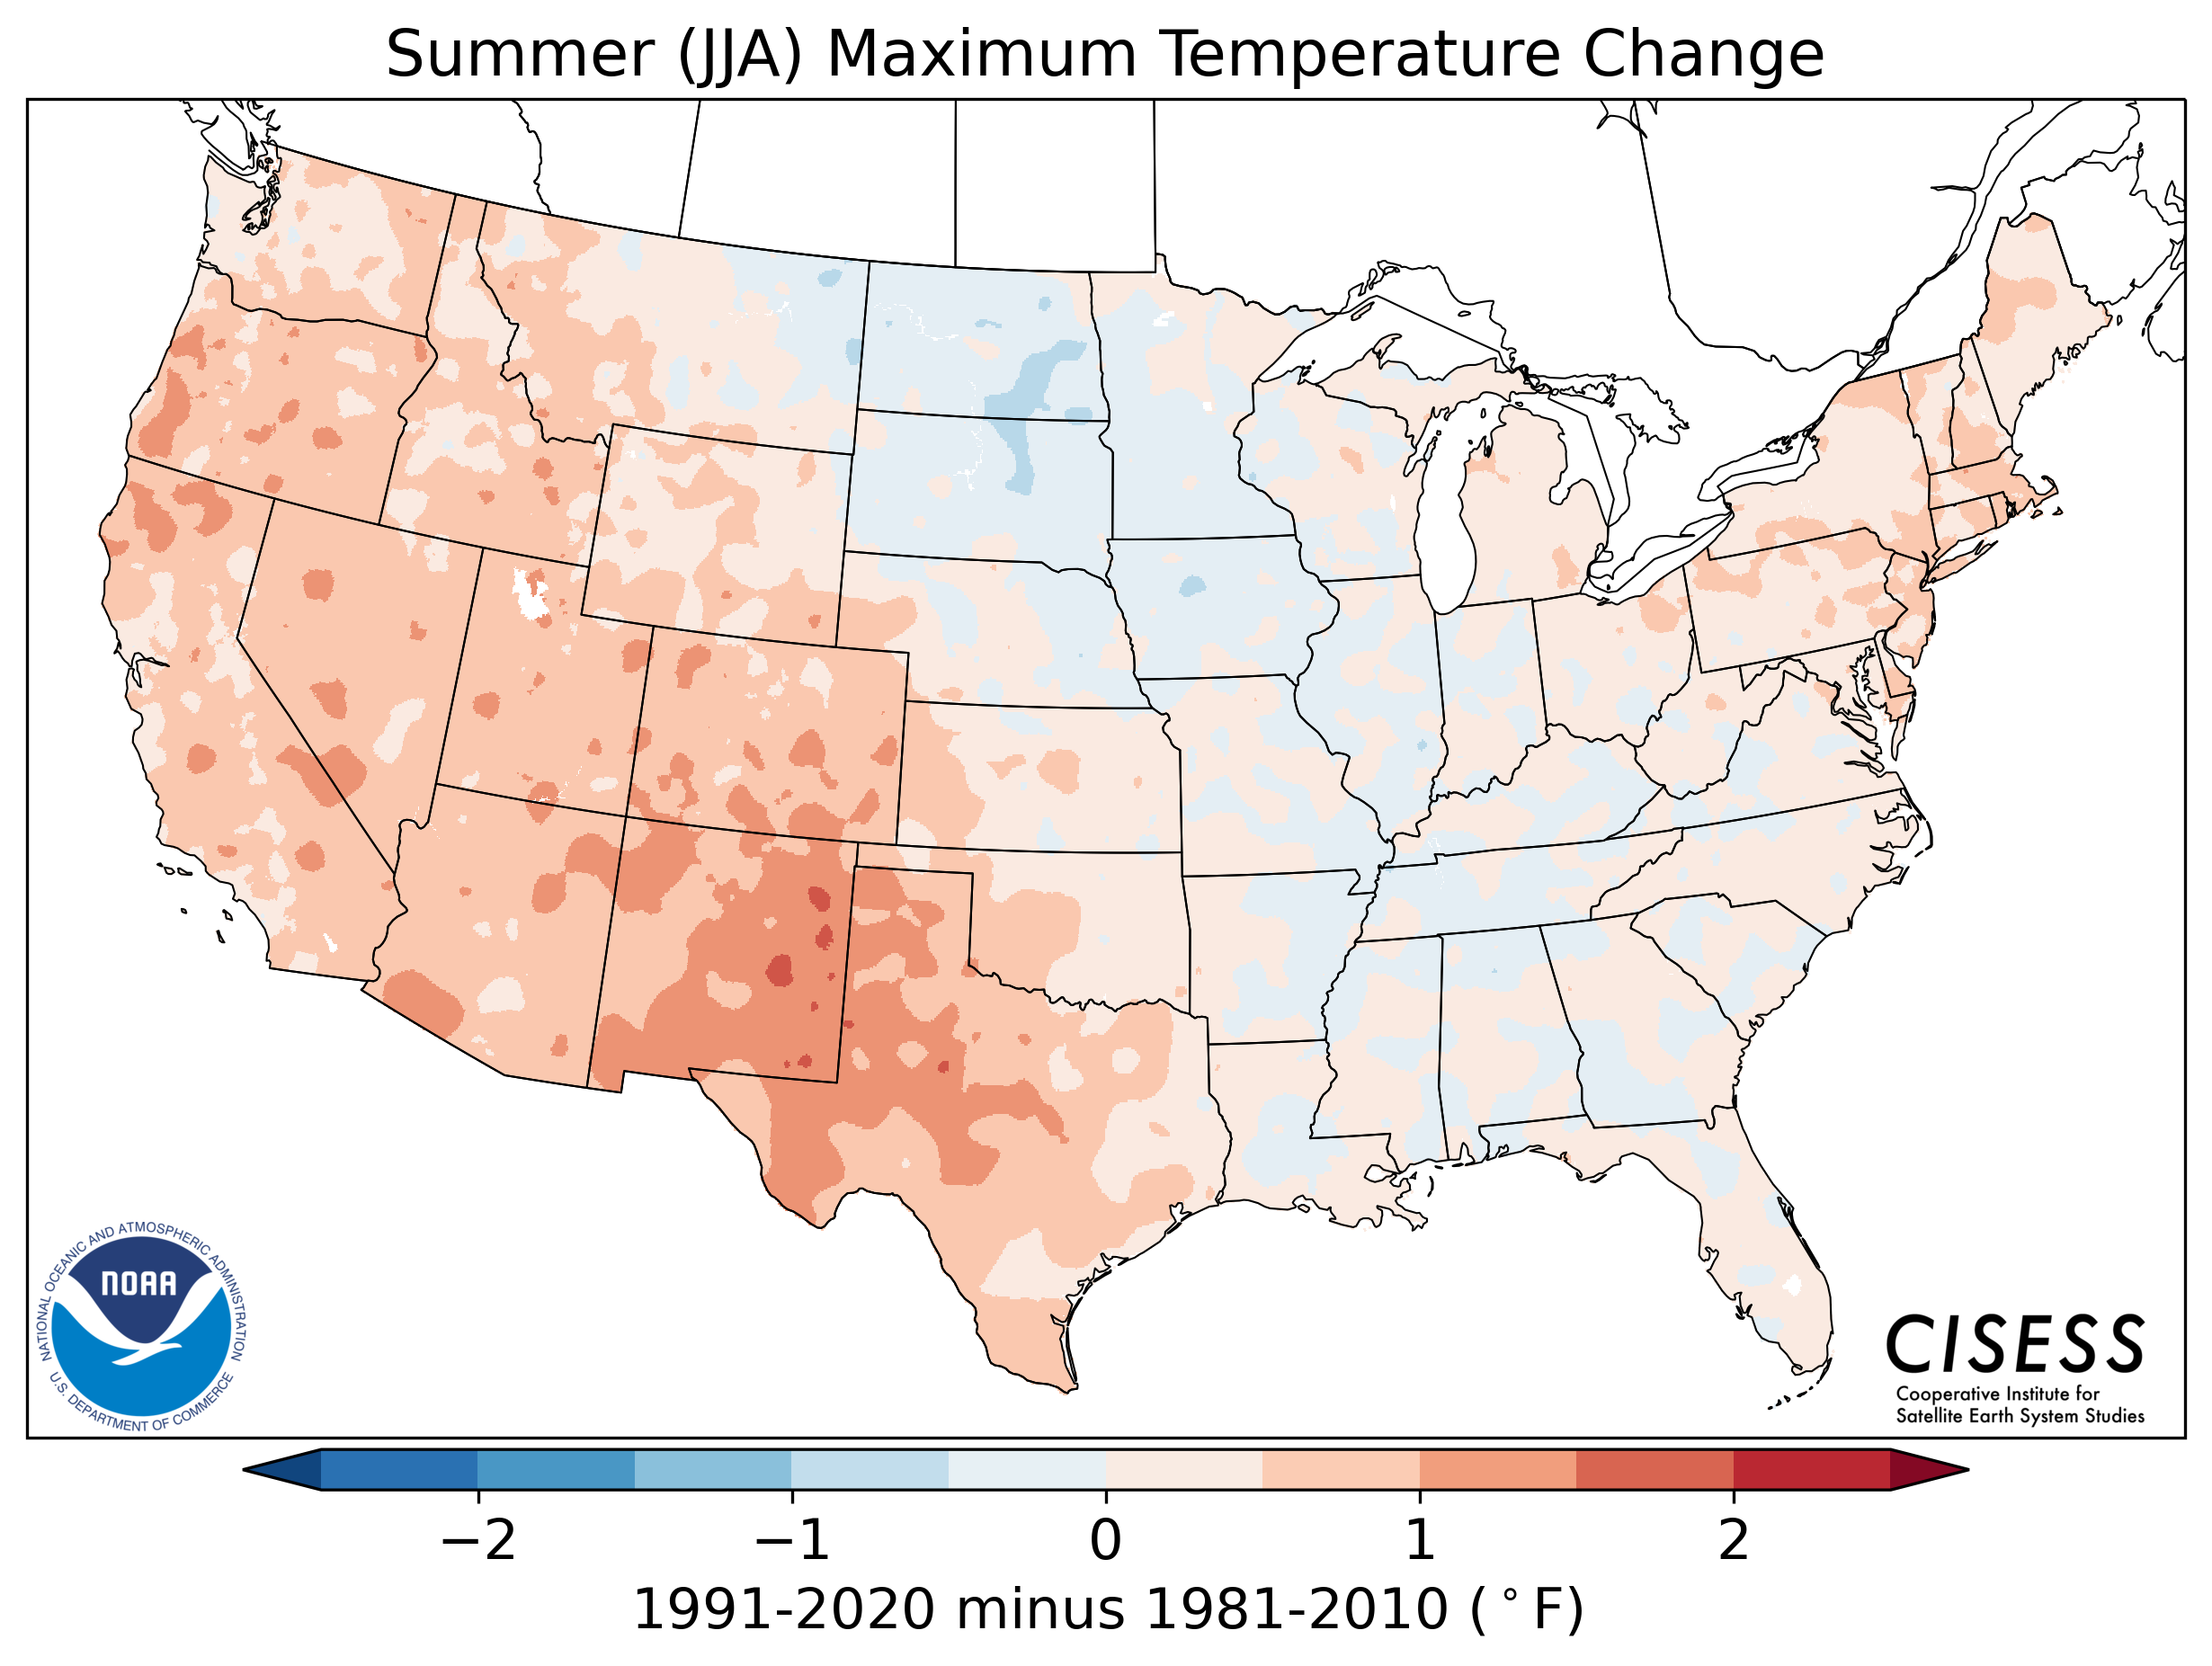
Map shows the spatial change (degrees Fahrenheit) in daily maximum temperature between the most recent/current "normal" period of 1991-2020 and the 1981-2010 normals during the summer months. |
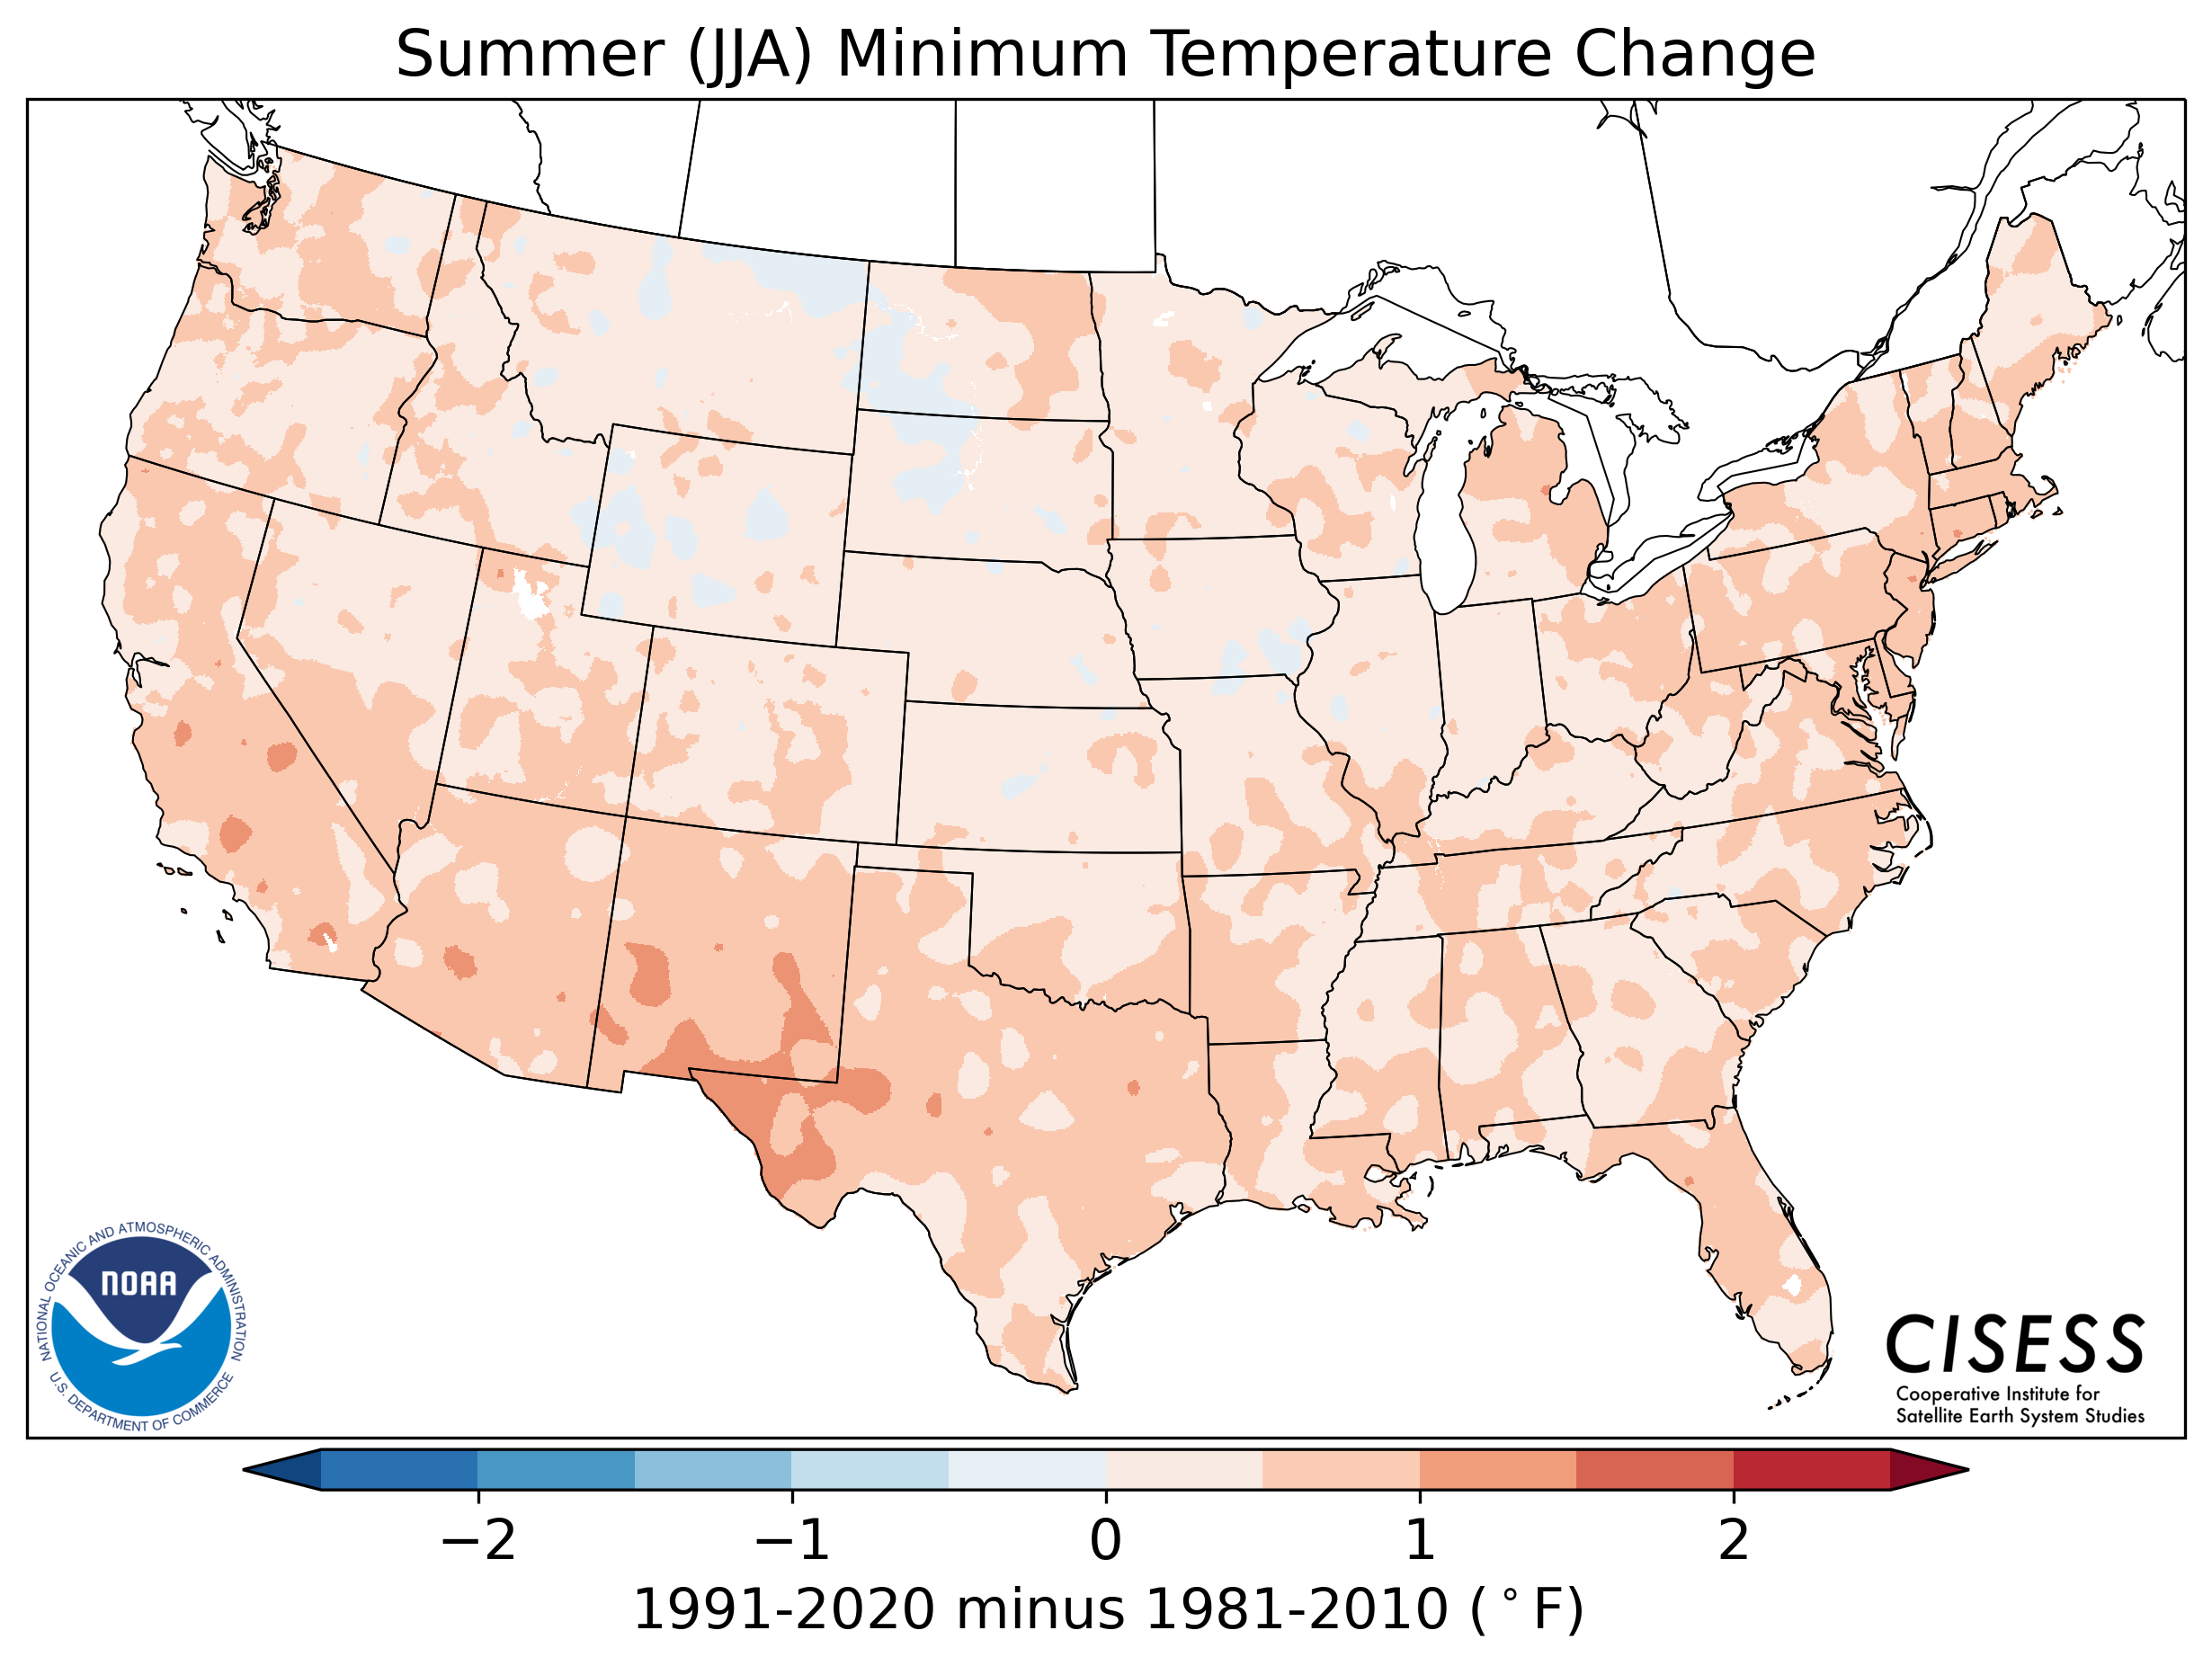
Map shows the spatial change (degrees Fahrenheit) in daily minimum temperature between the most recent/current "normal" period of 1991-2020 and the 1981-2010 normals during the summer months. |
|
|
||
|
Autumn (September-October-November) |
||
|
|
||
 |
||
|
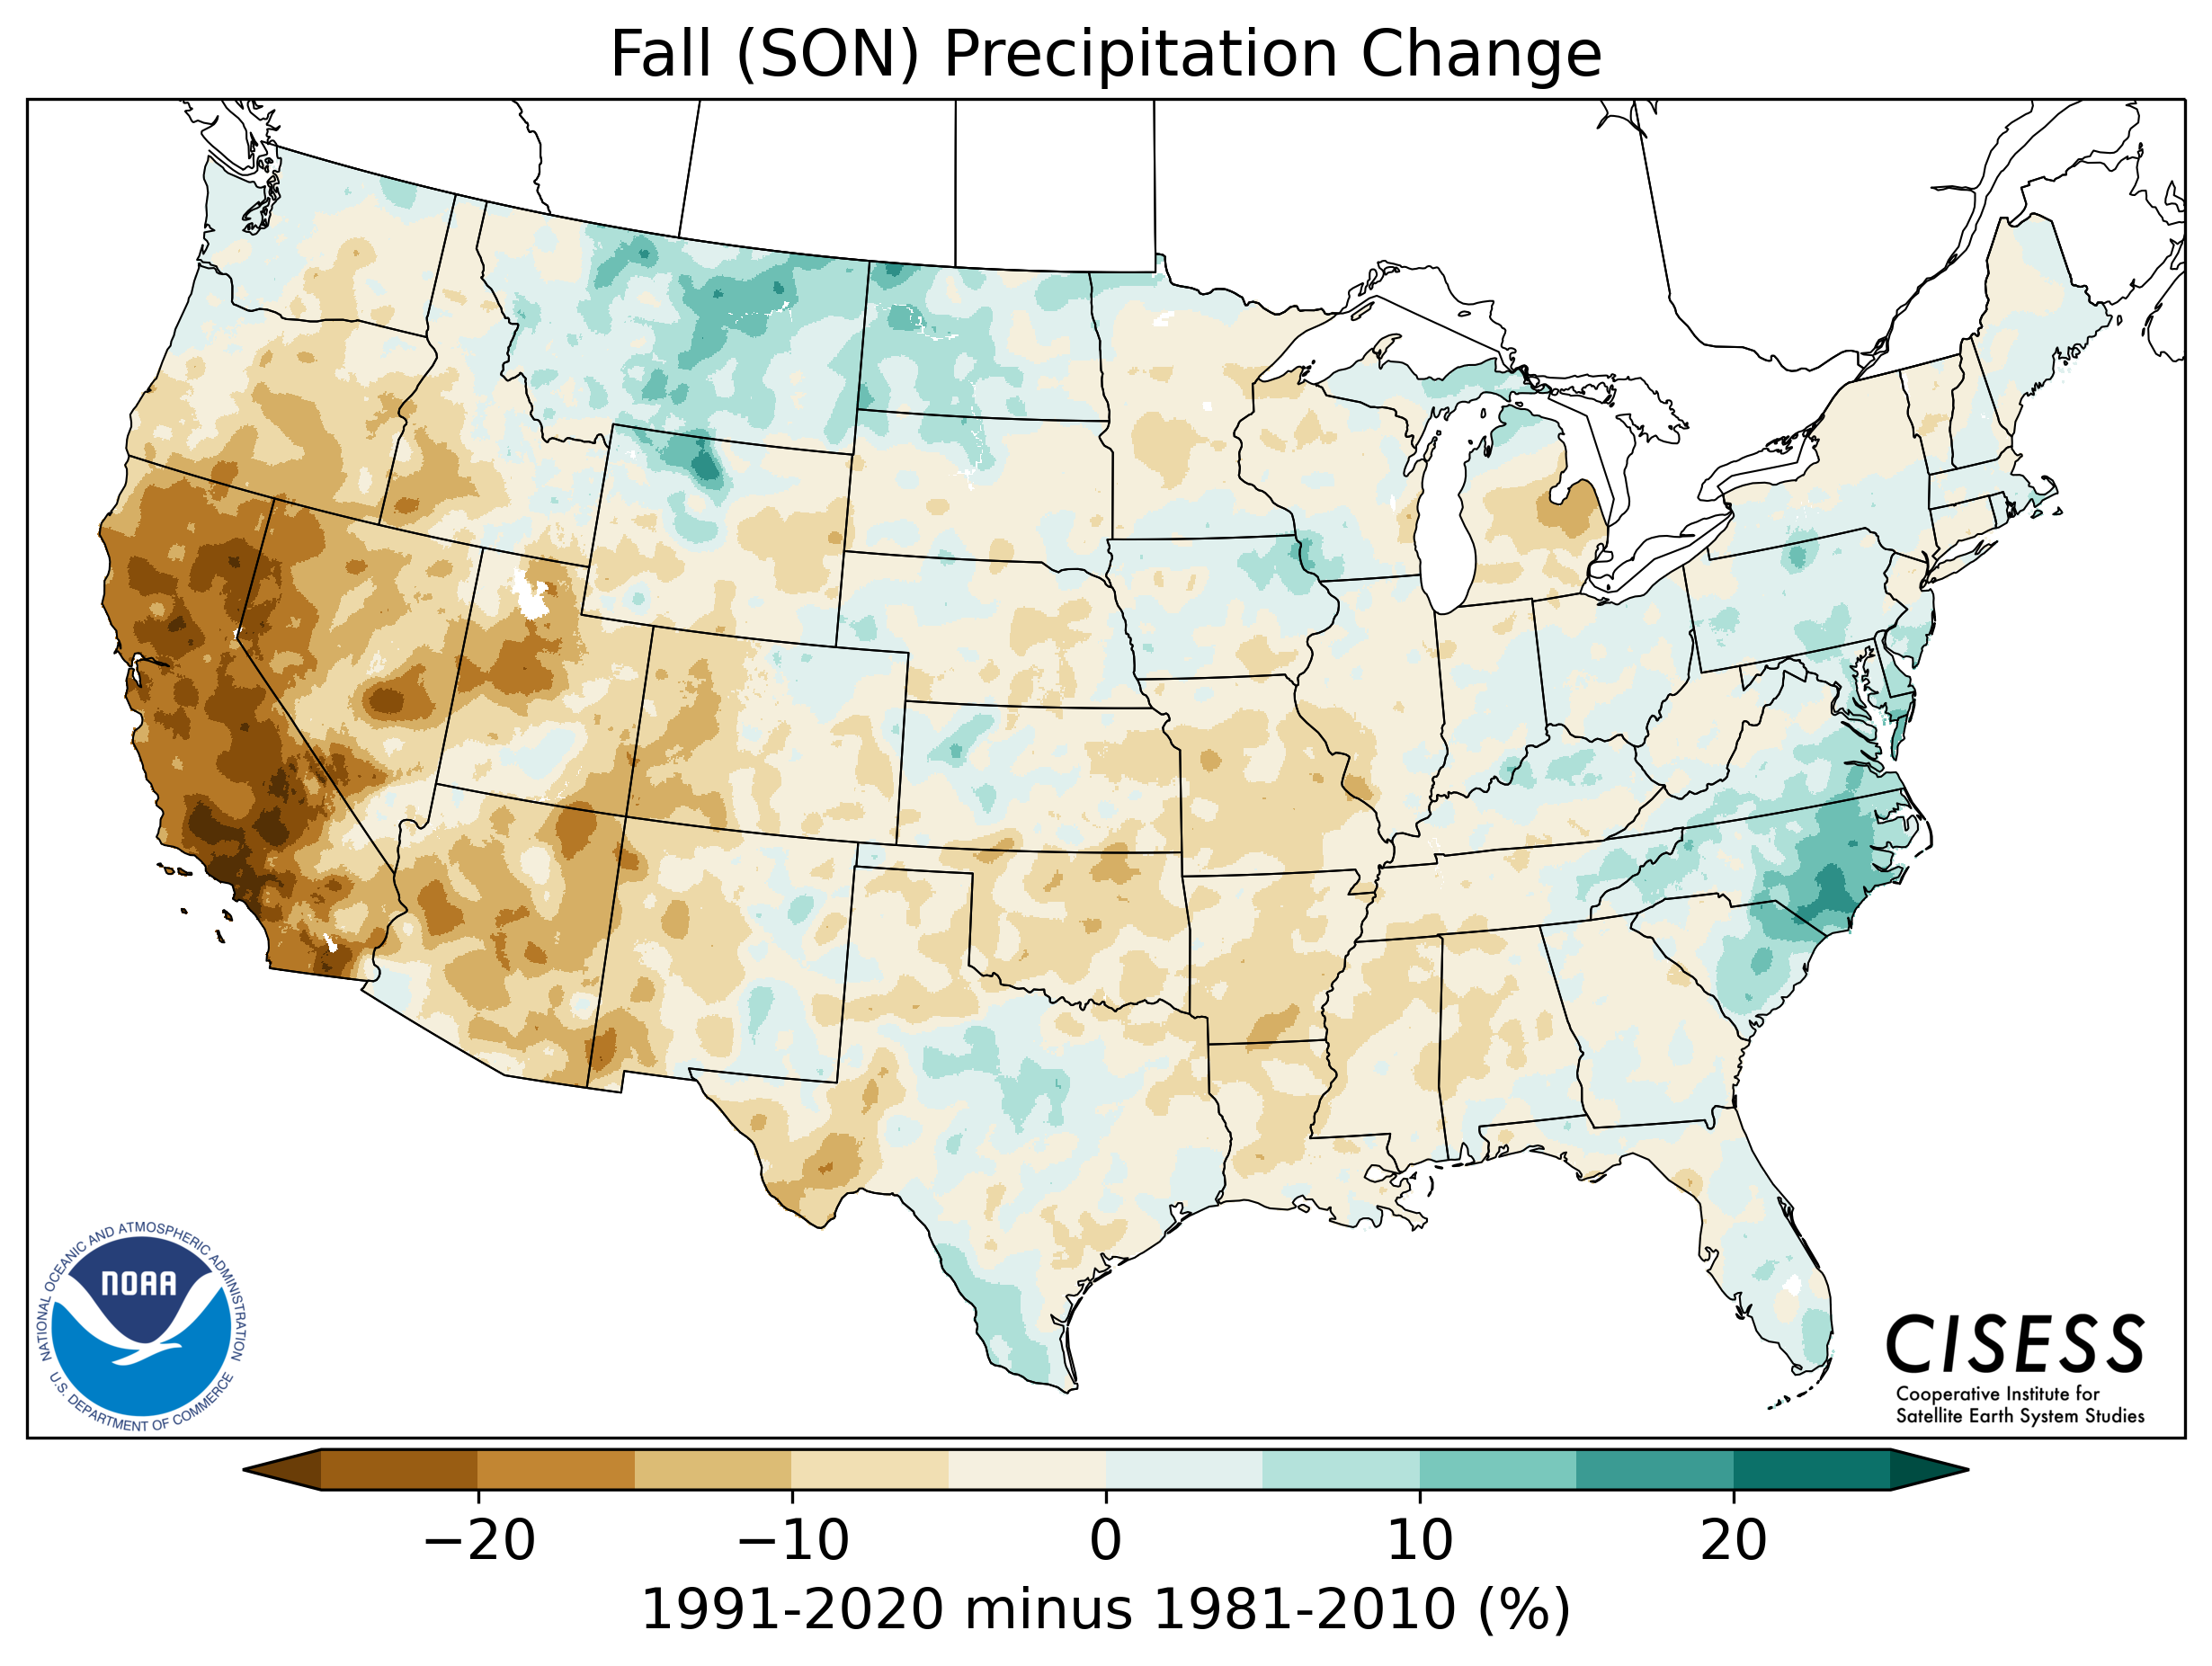
Map shows the spatial percent (%) difference in precipitation between the most recent/current "normal" period of 1991-2020 compared to the "normal" period of 1981-2010 during the autumn months. |
||
|
|
||
 |
 |
 |
|
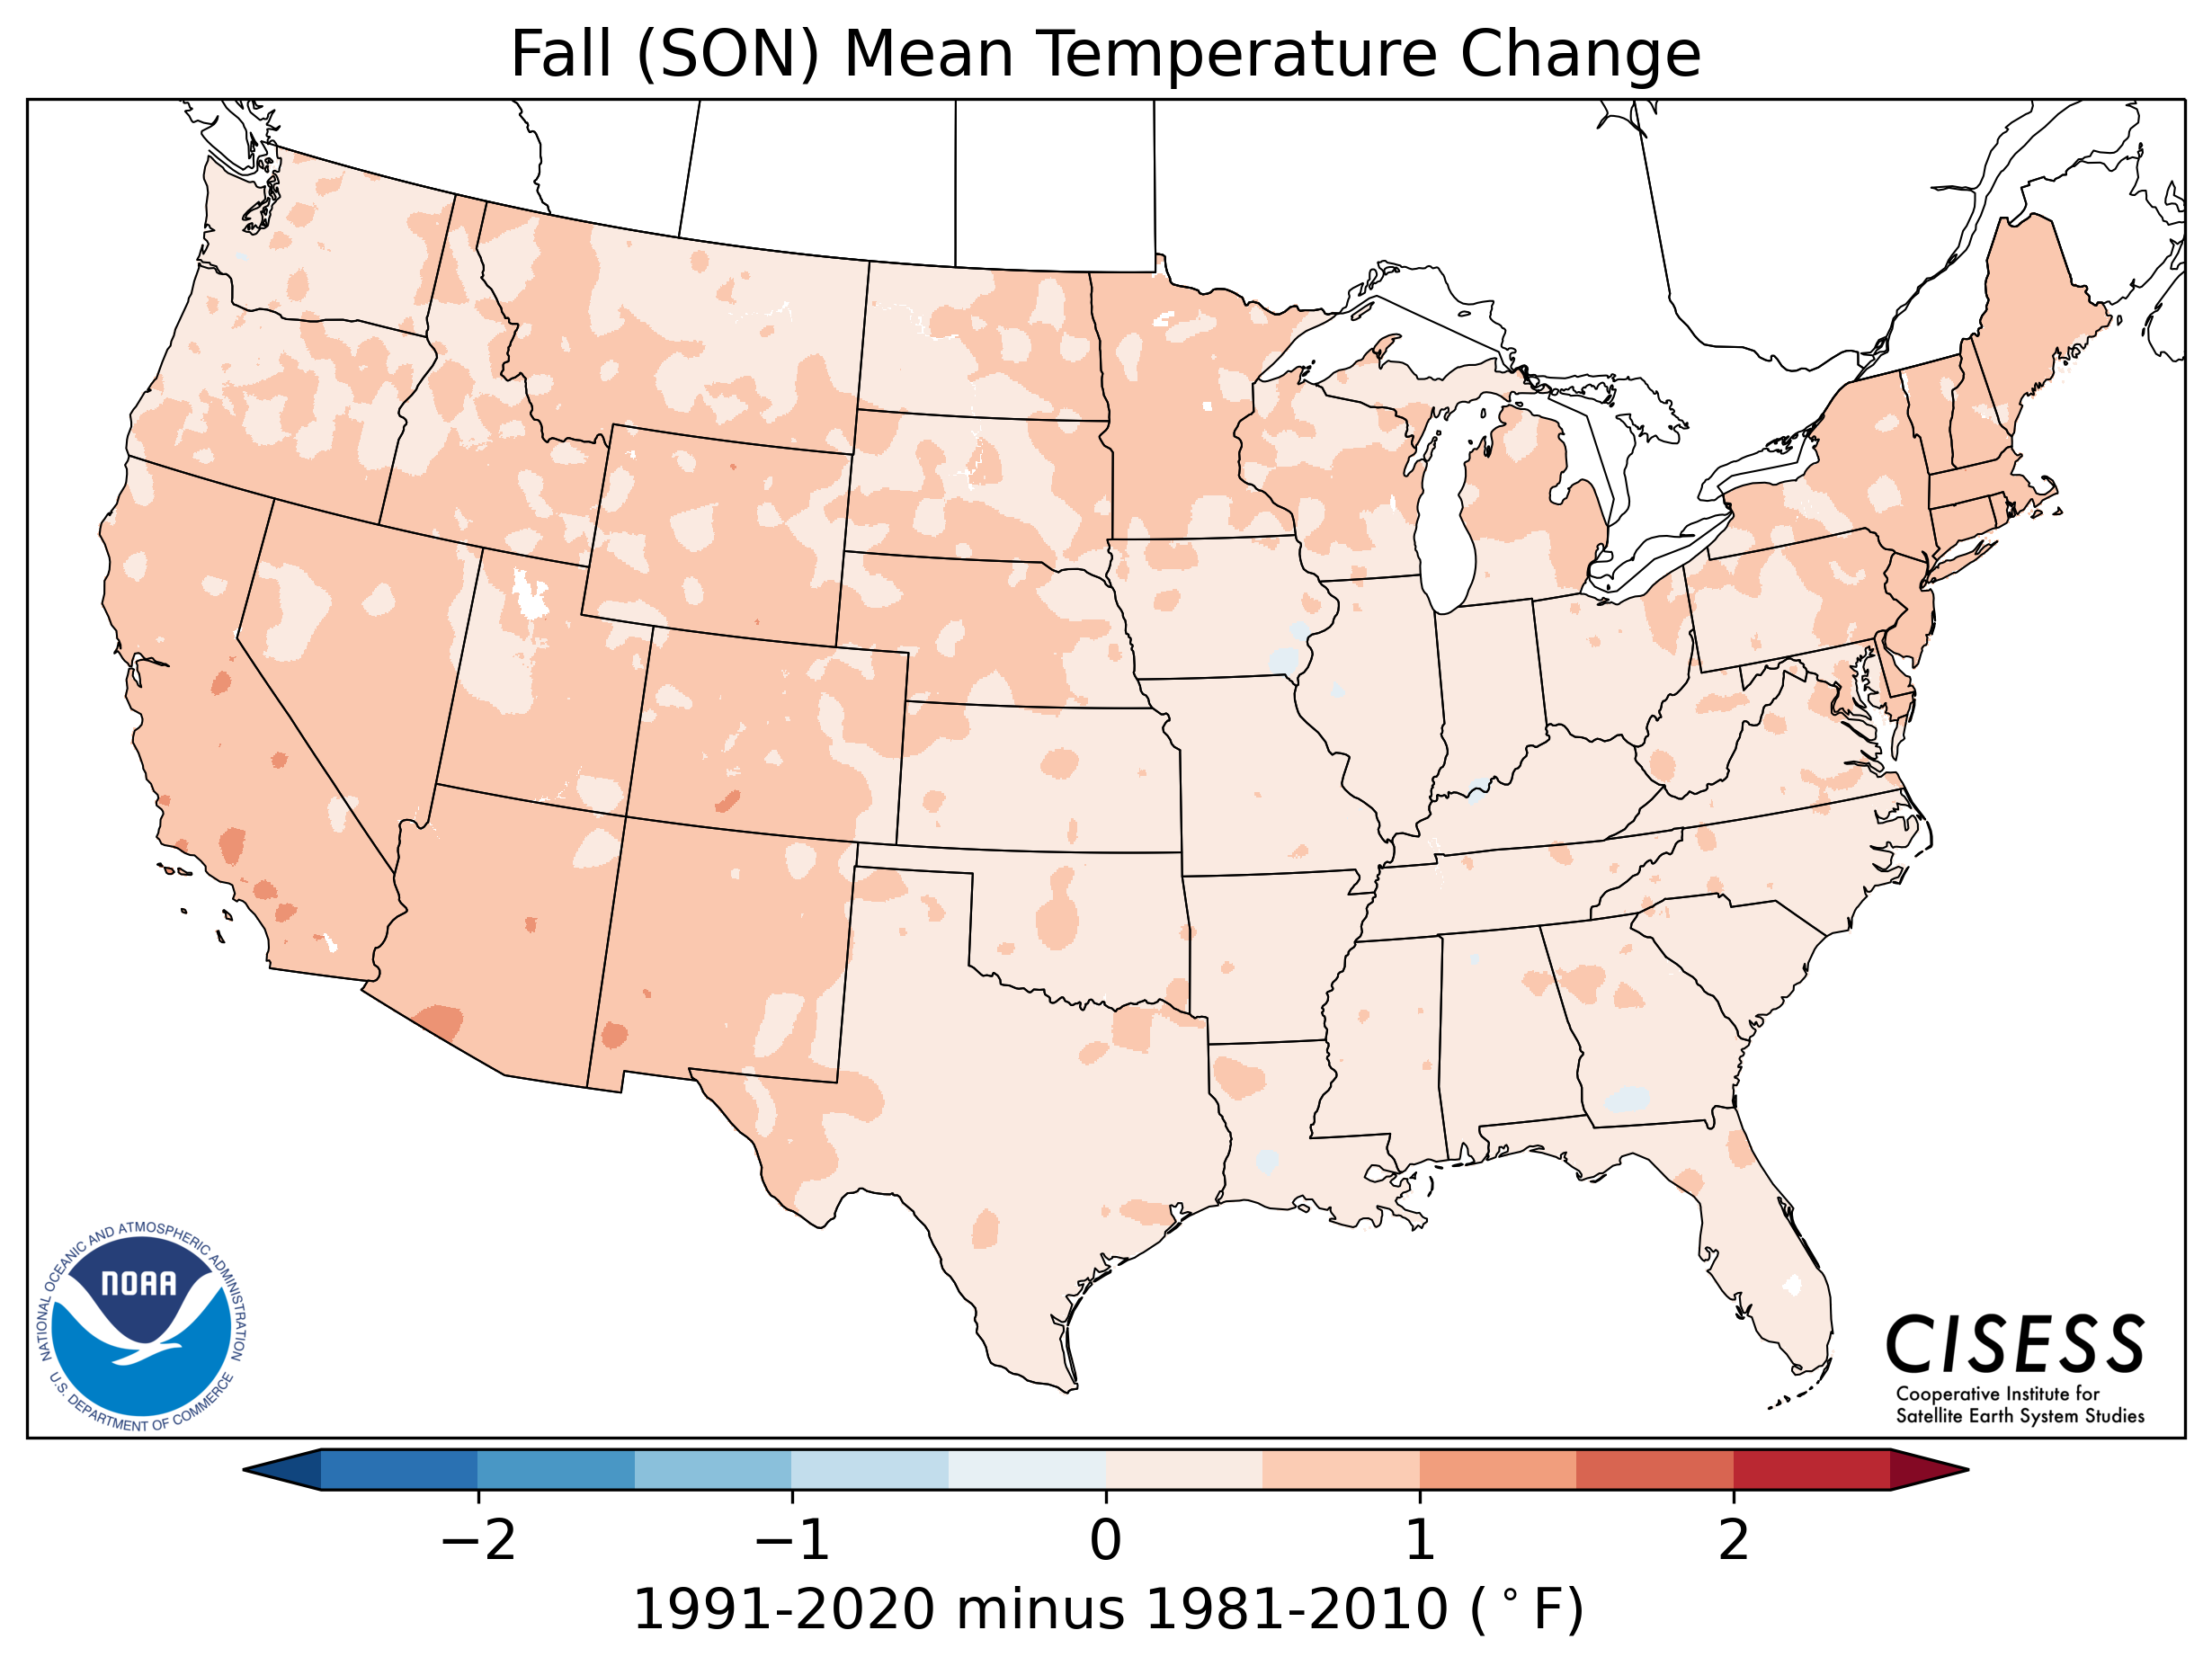
Map shows the spatial change (degrees Fahrenheit) in daily average temperature between the most recent/current "normal" period of 1991-2020 and the 1981-2010 normals during the autumn months. |
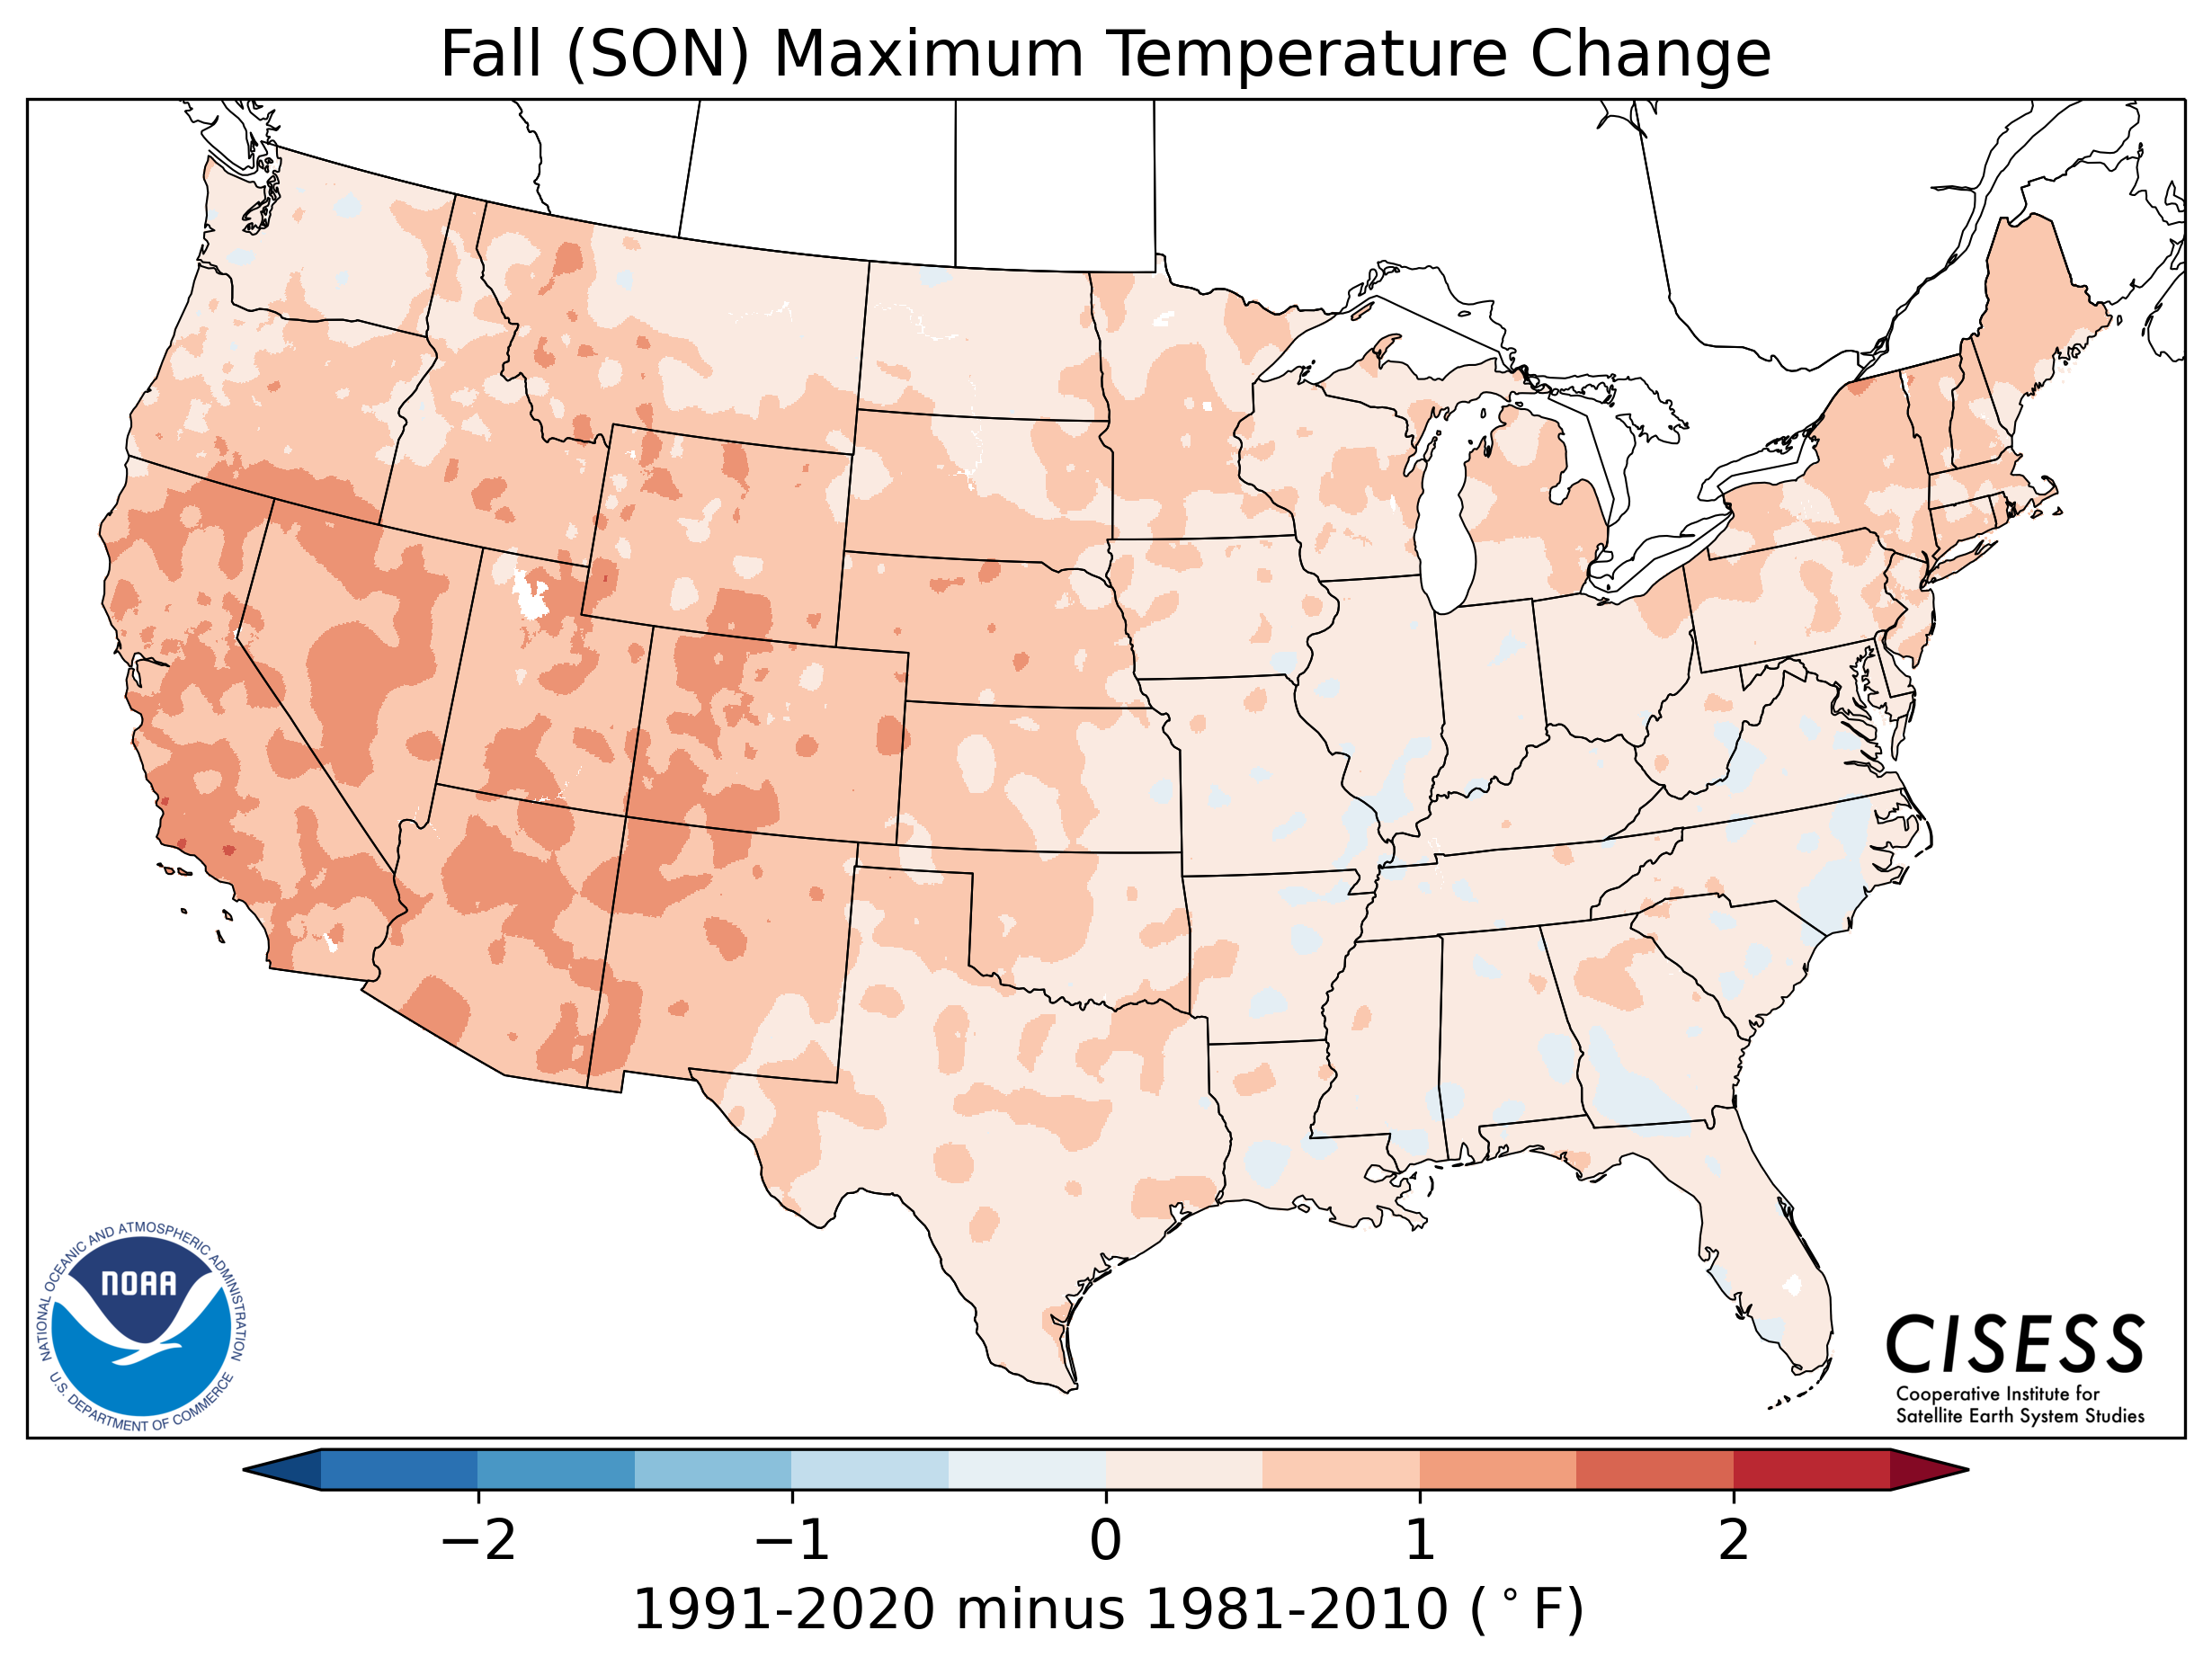
Map shows the spatial change (degrees Fahrenheit) in daily maximum temperature between the most recent/current "normal" period of 1991-2020 and the 1981-2010 normals during the autumn months. |
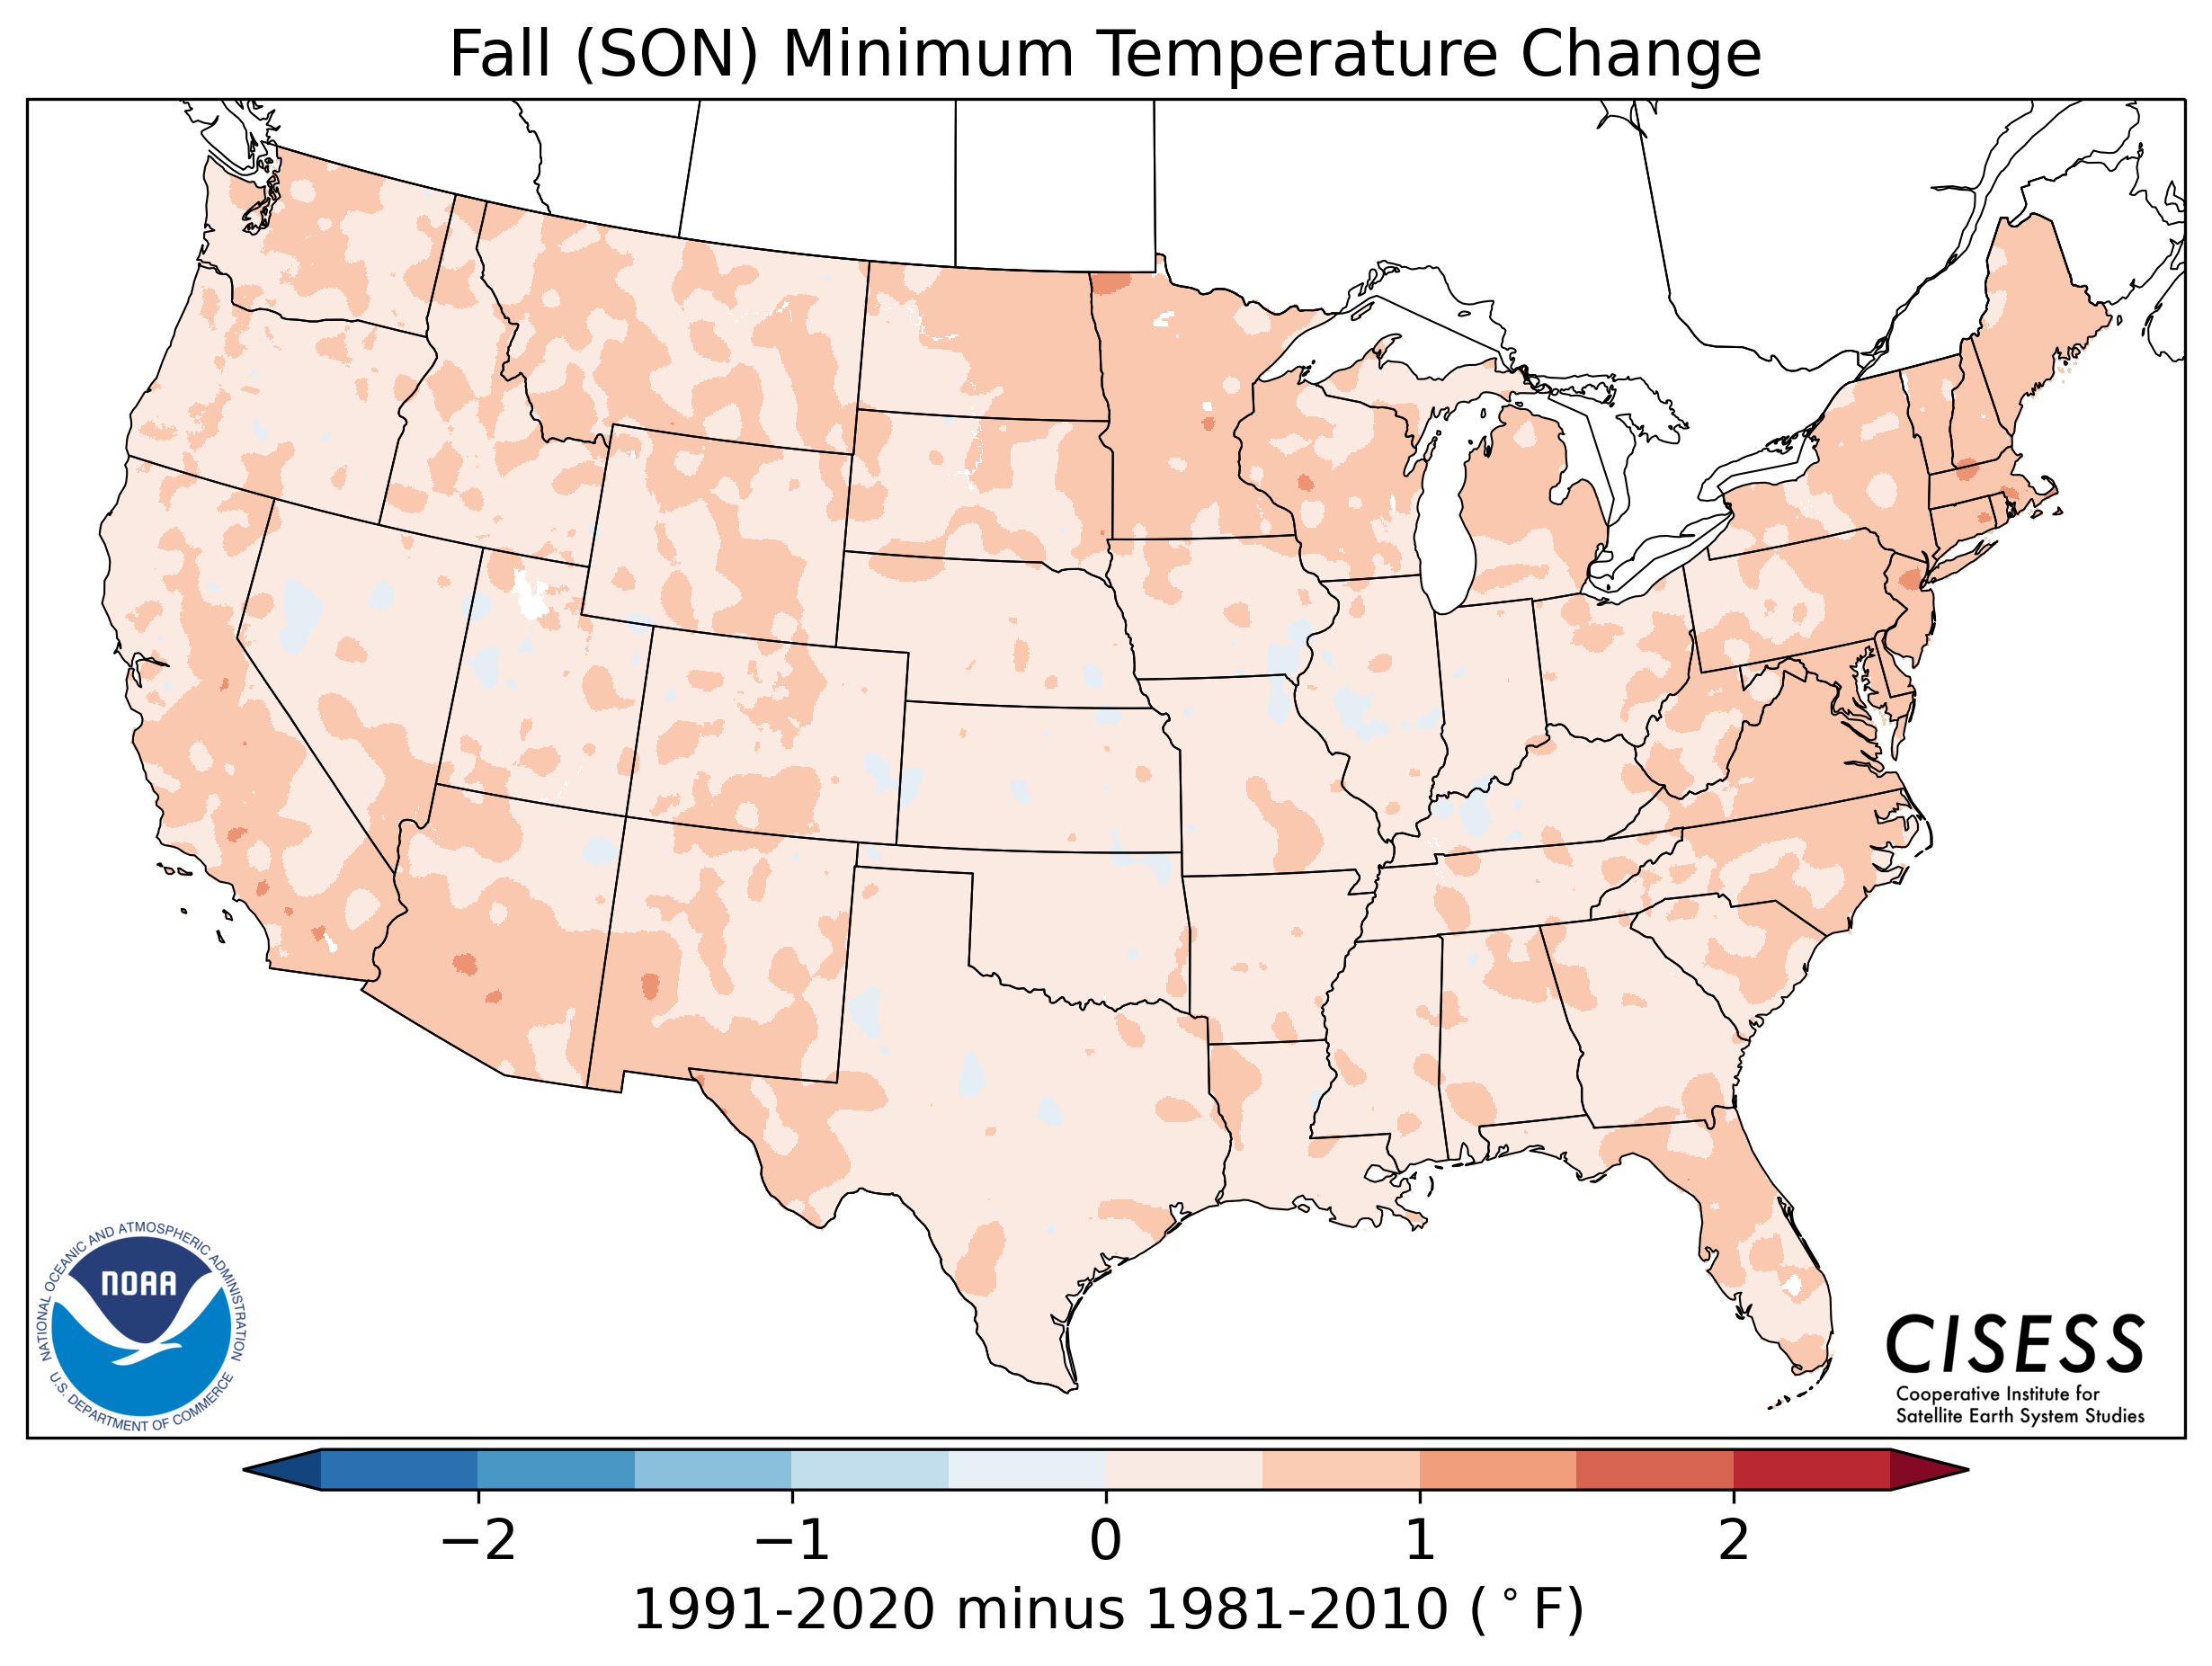
Map shows the spatial change (degrees Fahrenheit) in daily minimum temperature between the most recent/current "normal" period of 1991-2020 and the 1981-2010 normals during the autumn months. |
|
|
||
|
Winter (December-January-February) |
||
|
|
||
 |
||
|
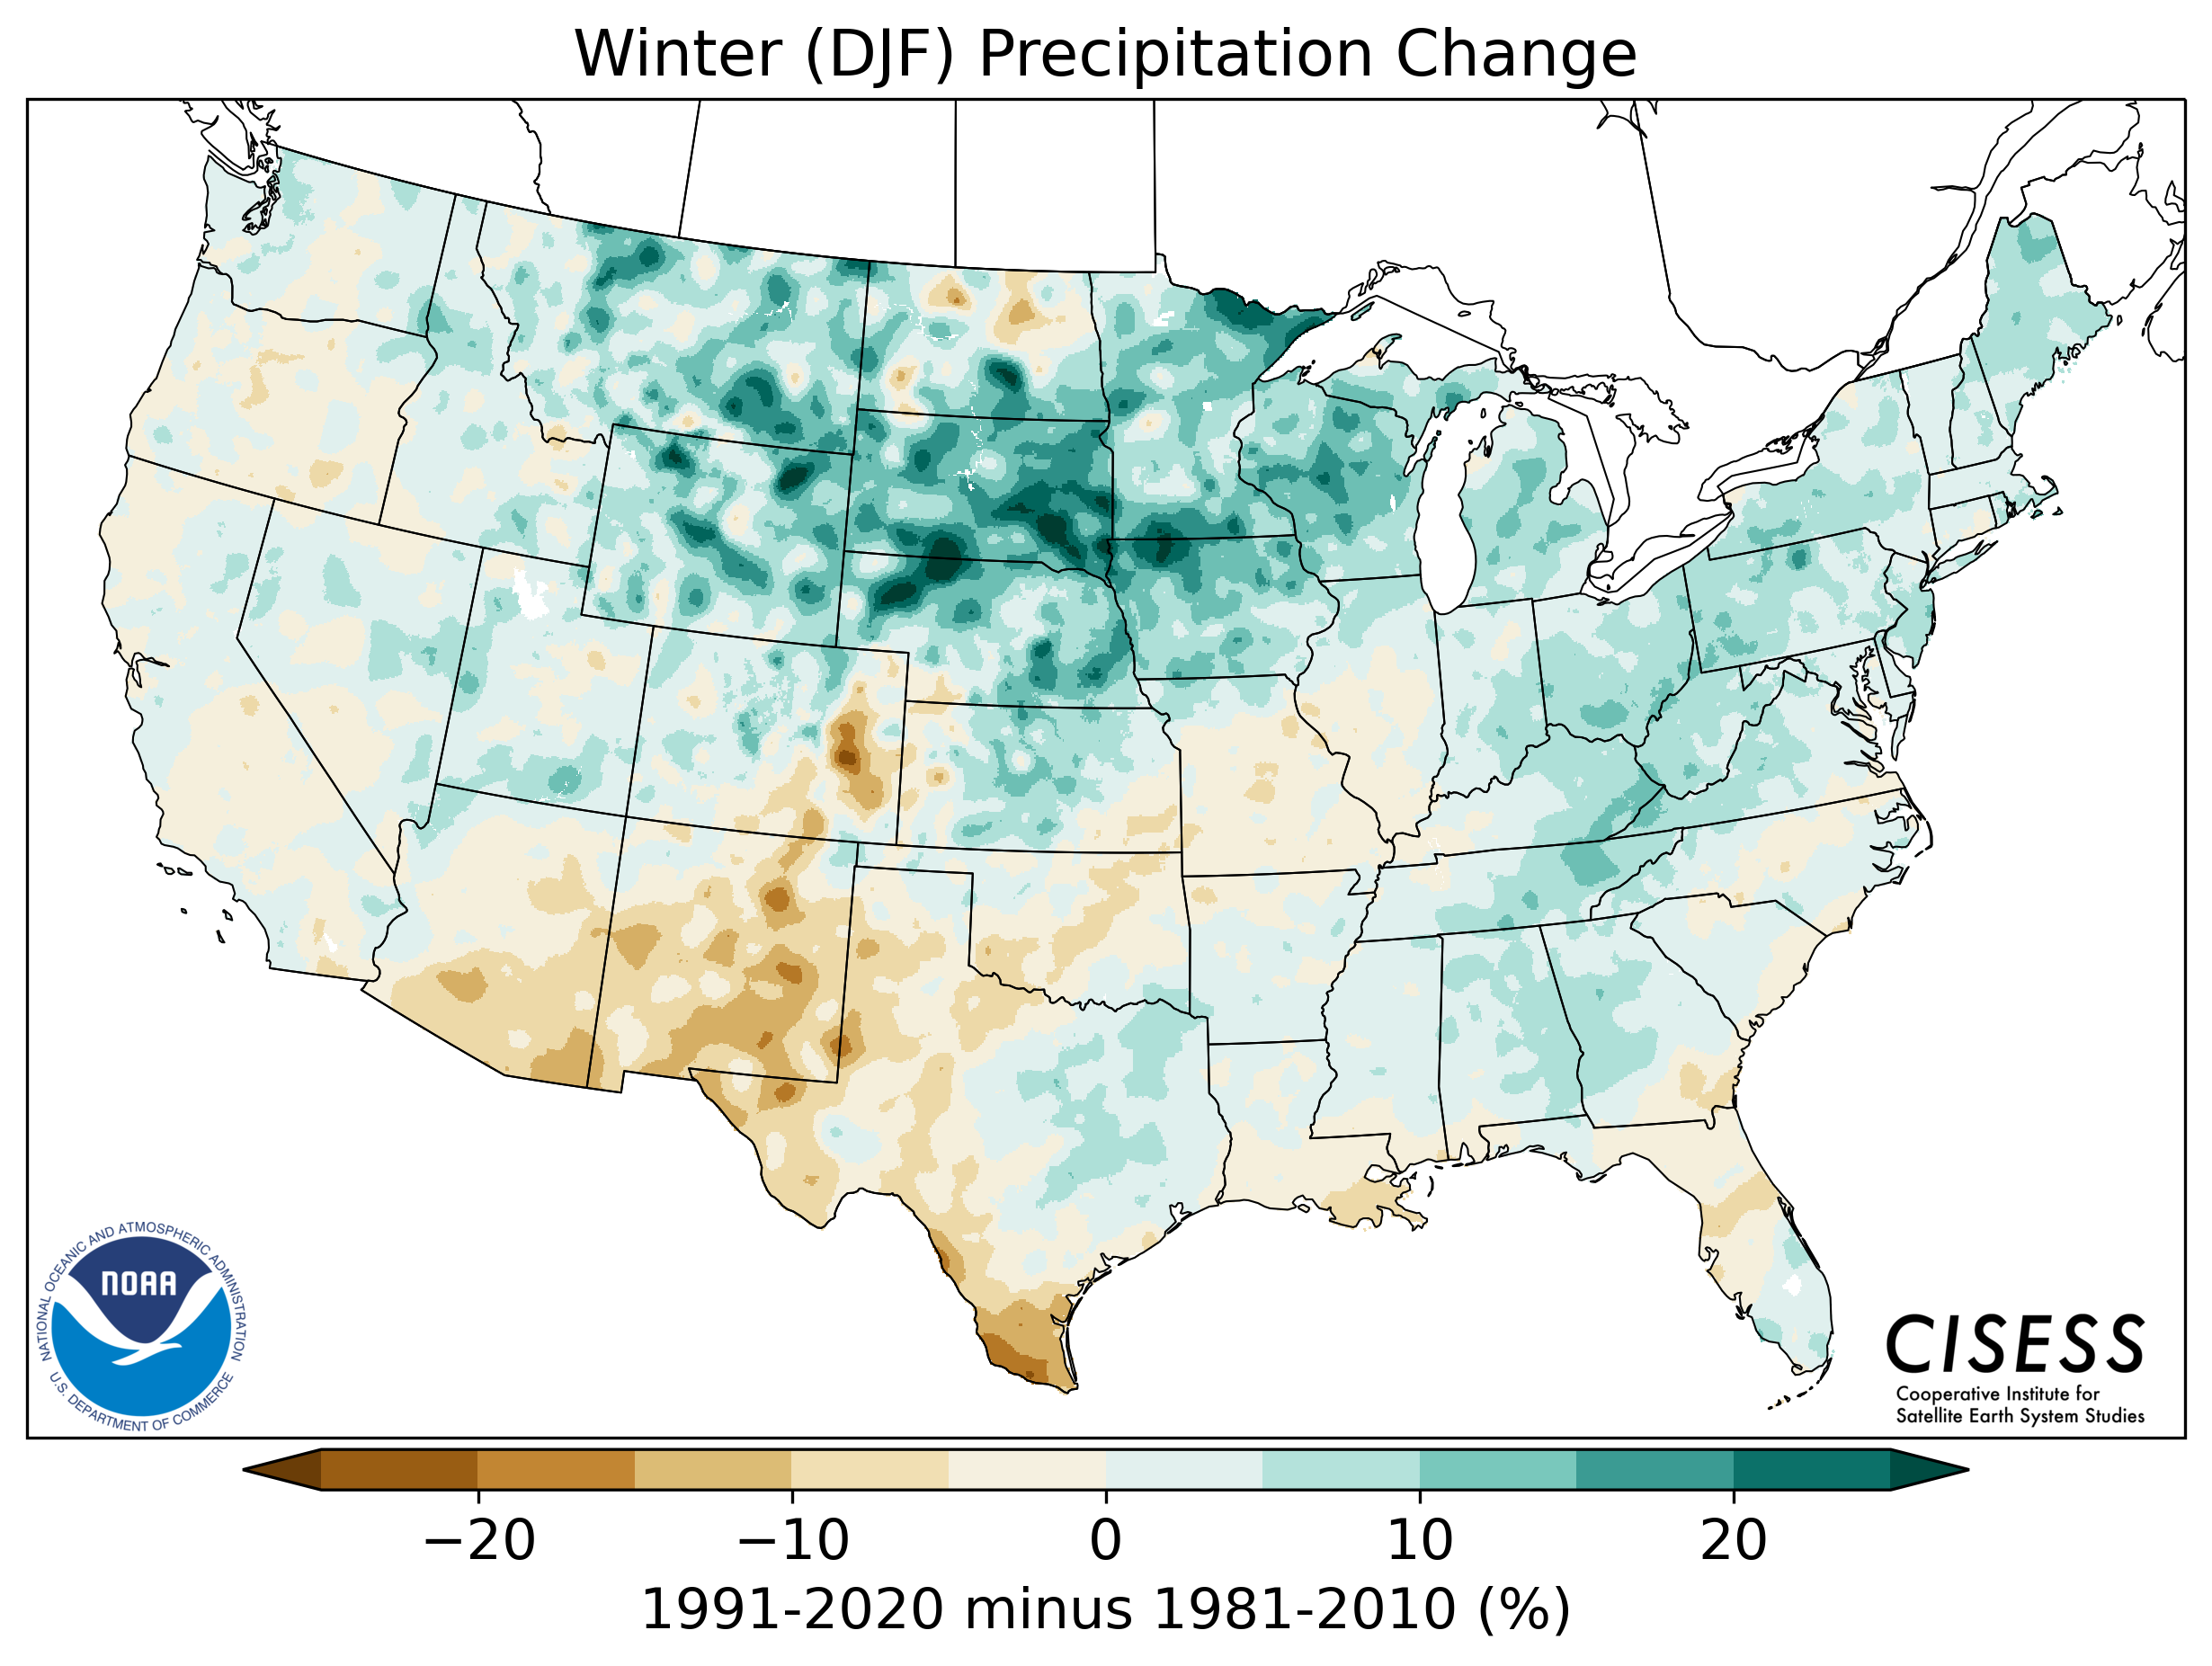
Map shows the spatial percent (%) difference in precipitation between the most recent/current "normal" period of 1991-2020 compared to the "normal" period of 1981-2010 during the winter months. |
||
|
|
||
 |
 |
 |
|
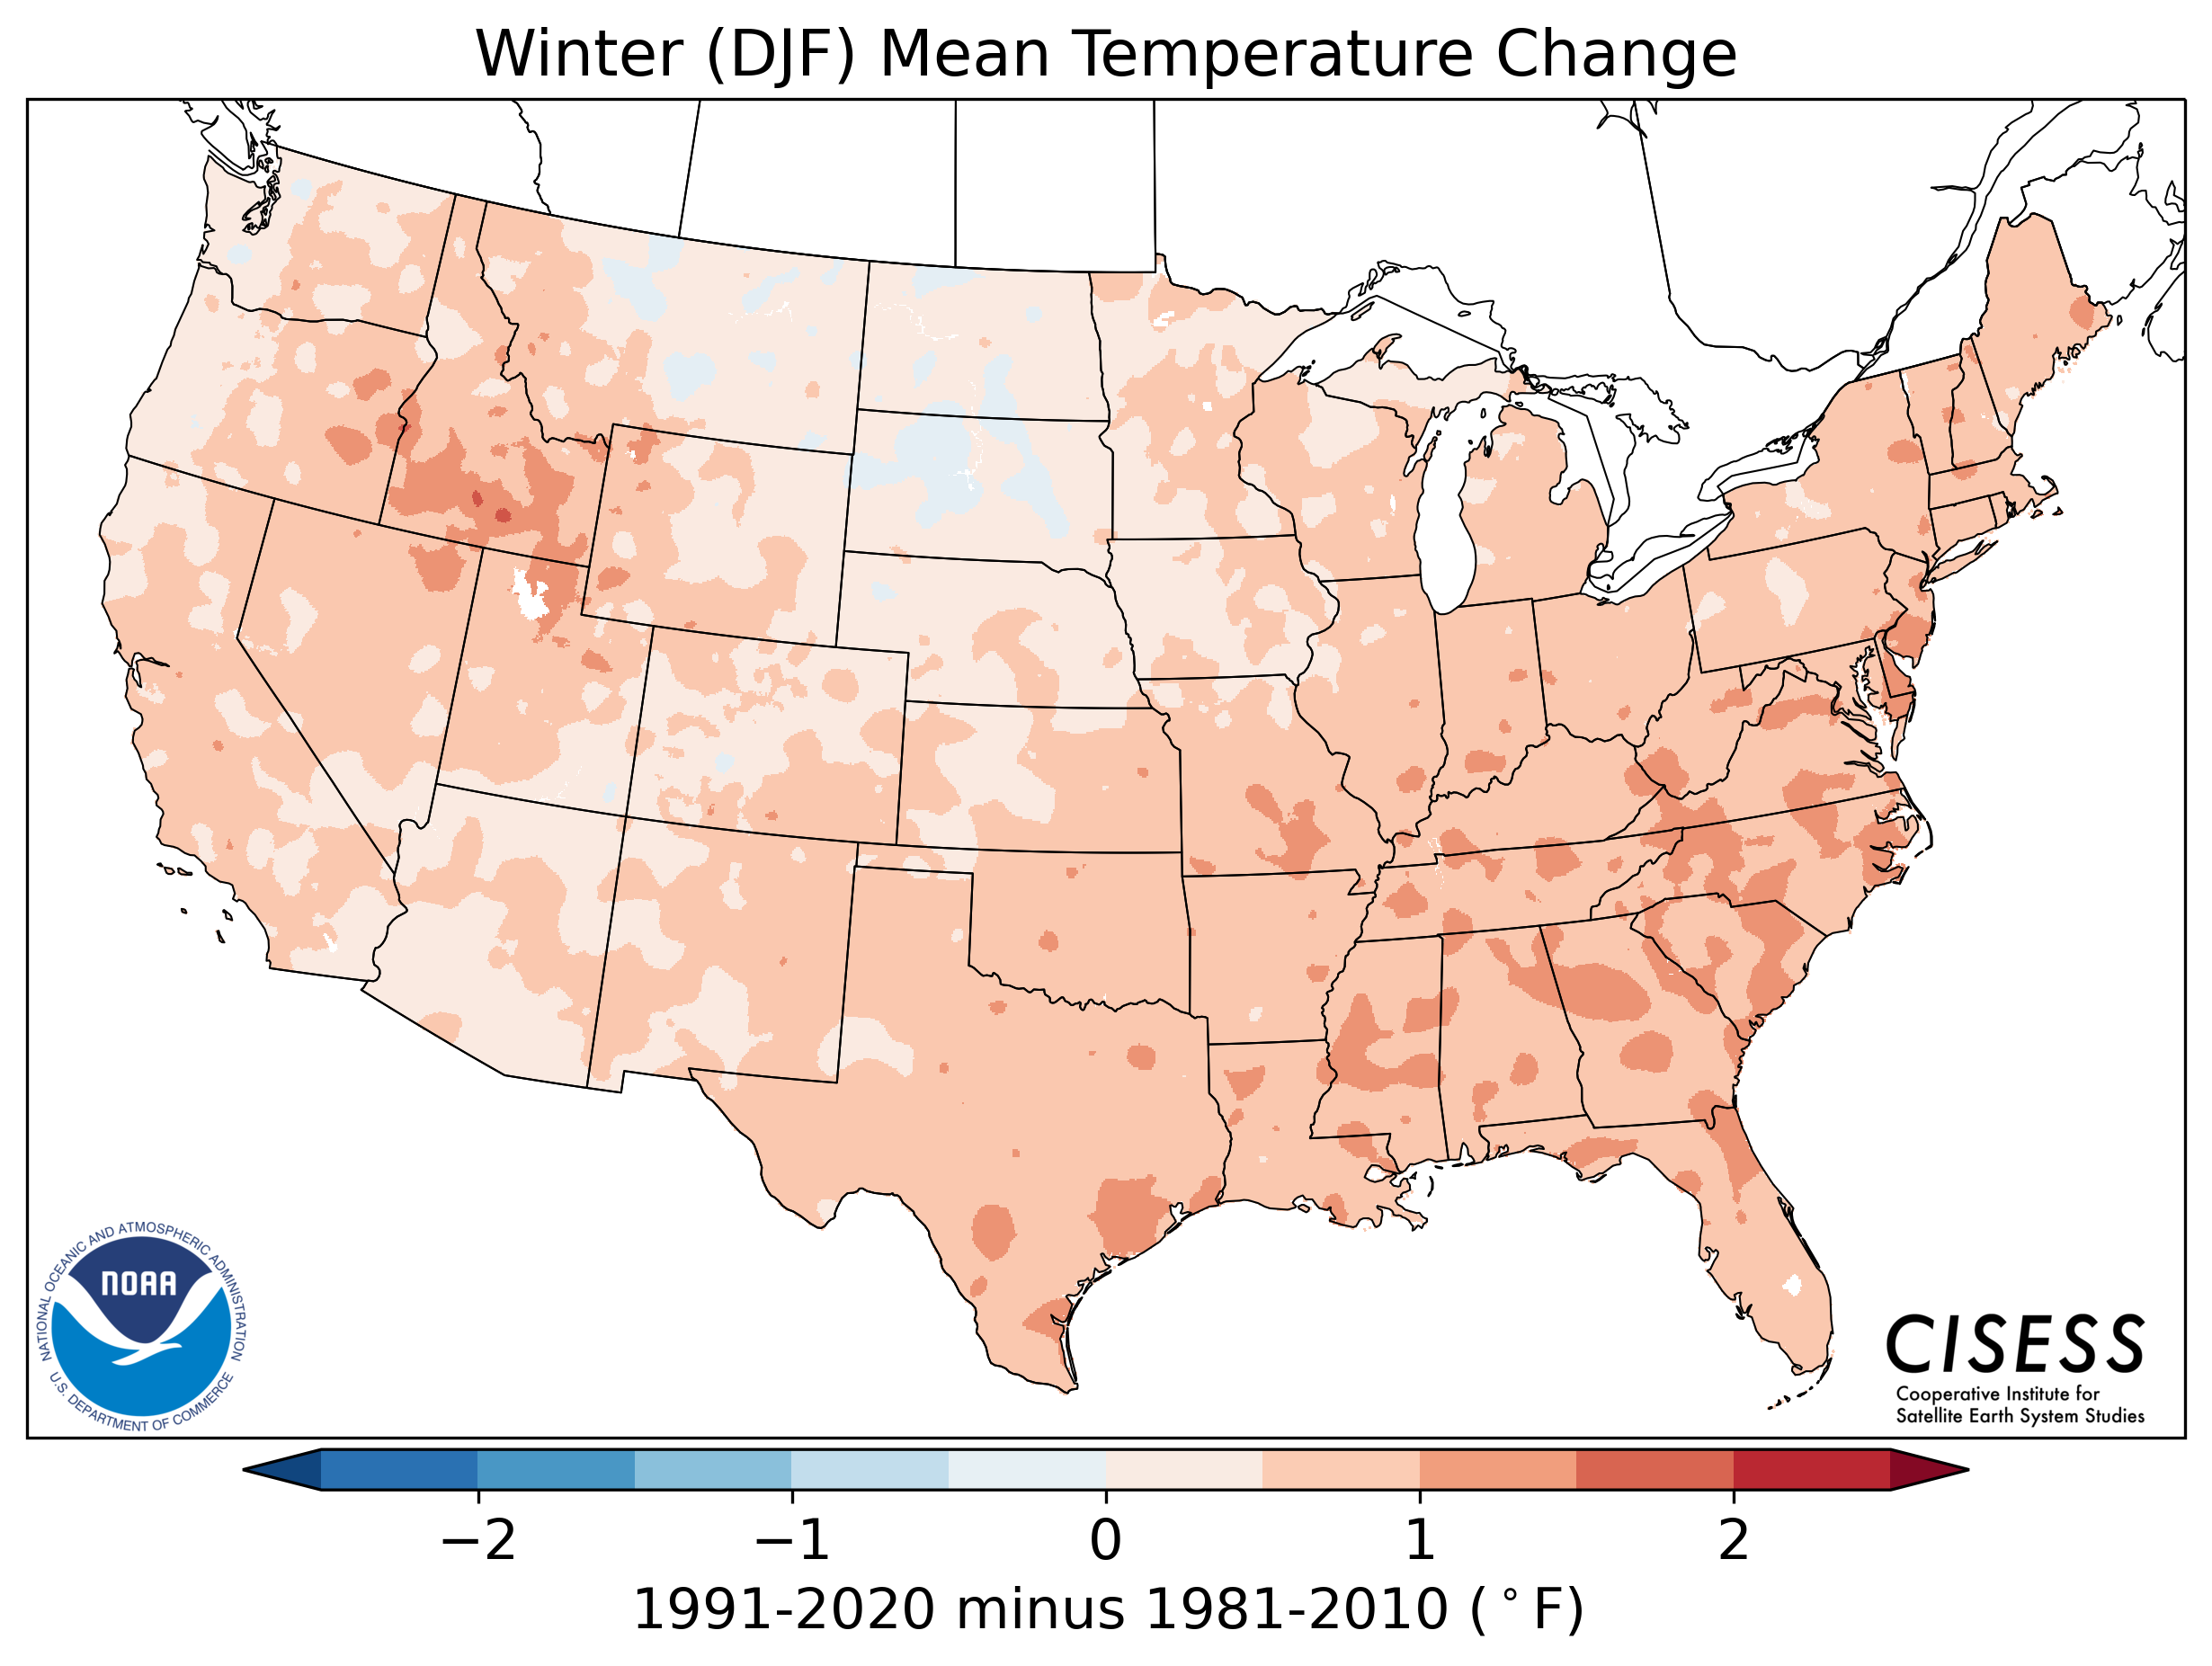
Map shows the spatial change (degrees Fahrenheit) in daily average temperature between the most recent/current "normal" period of 1991-2020 and the 1981-2010 normals during the winter months. |
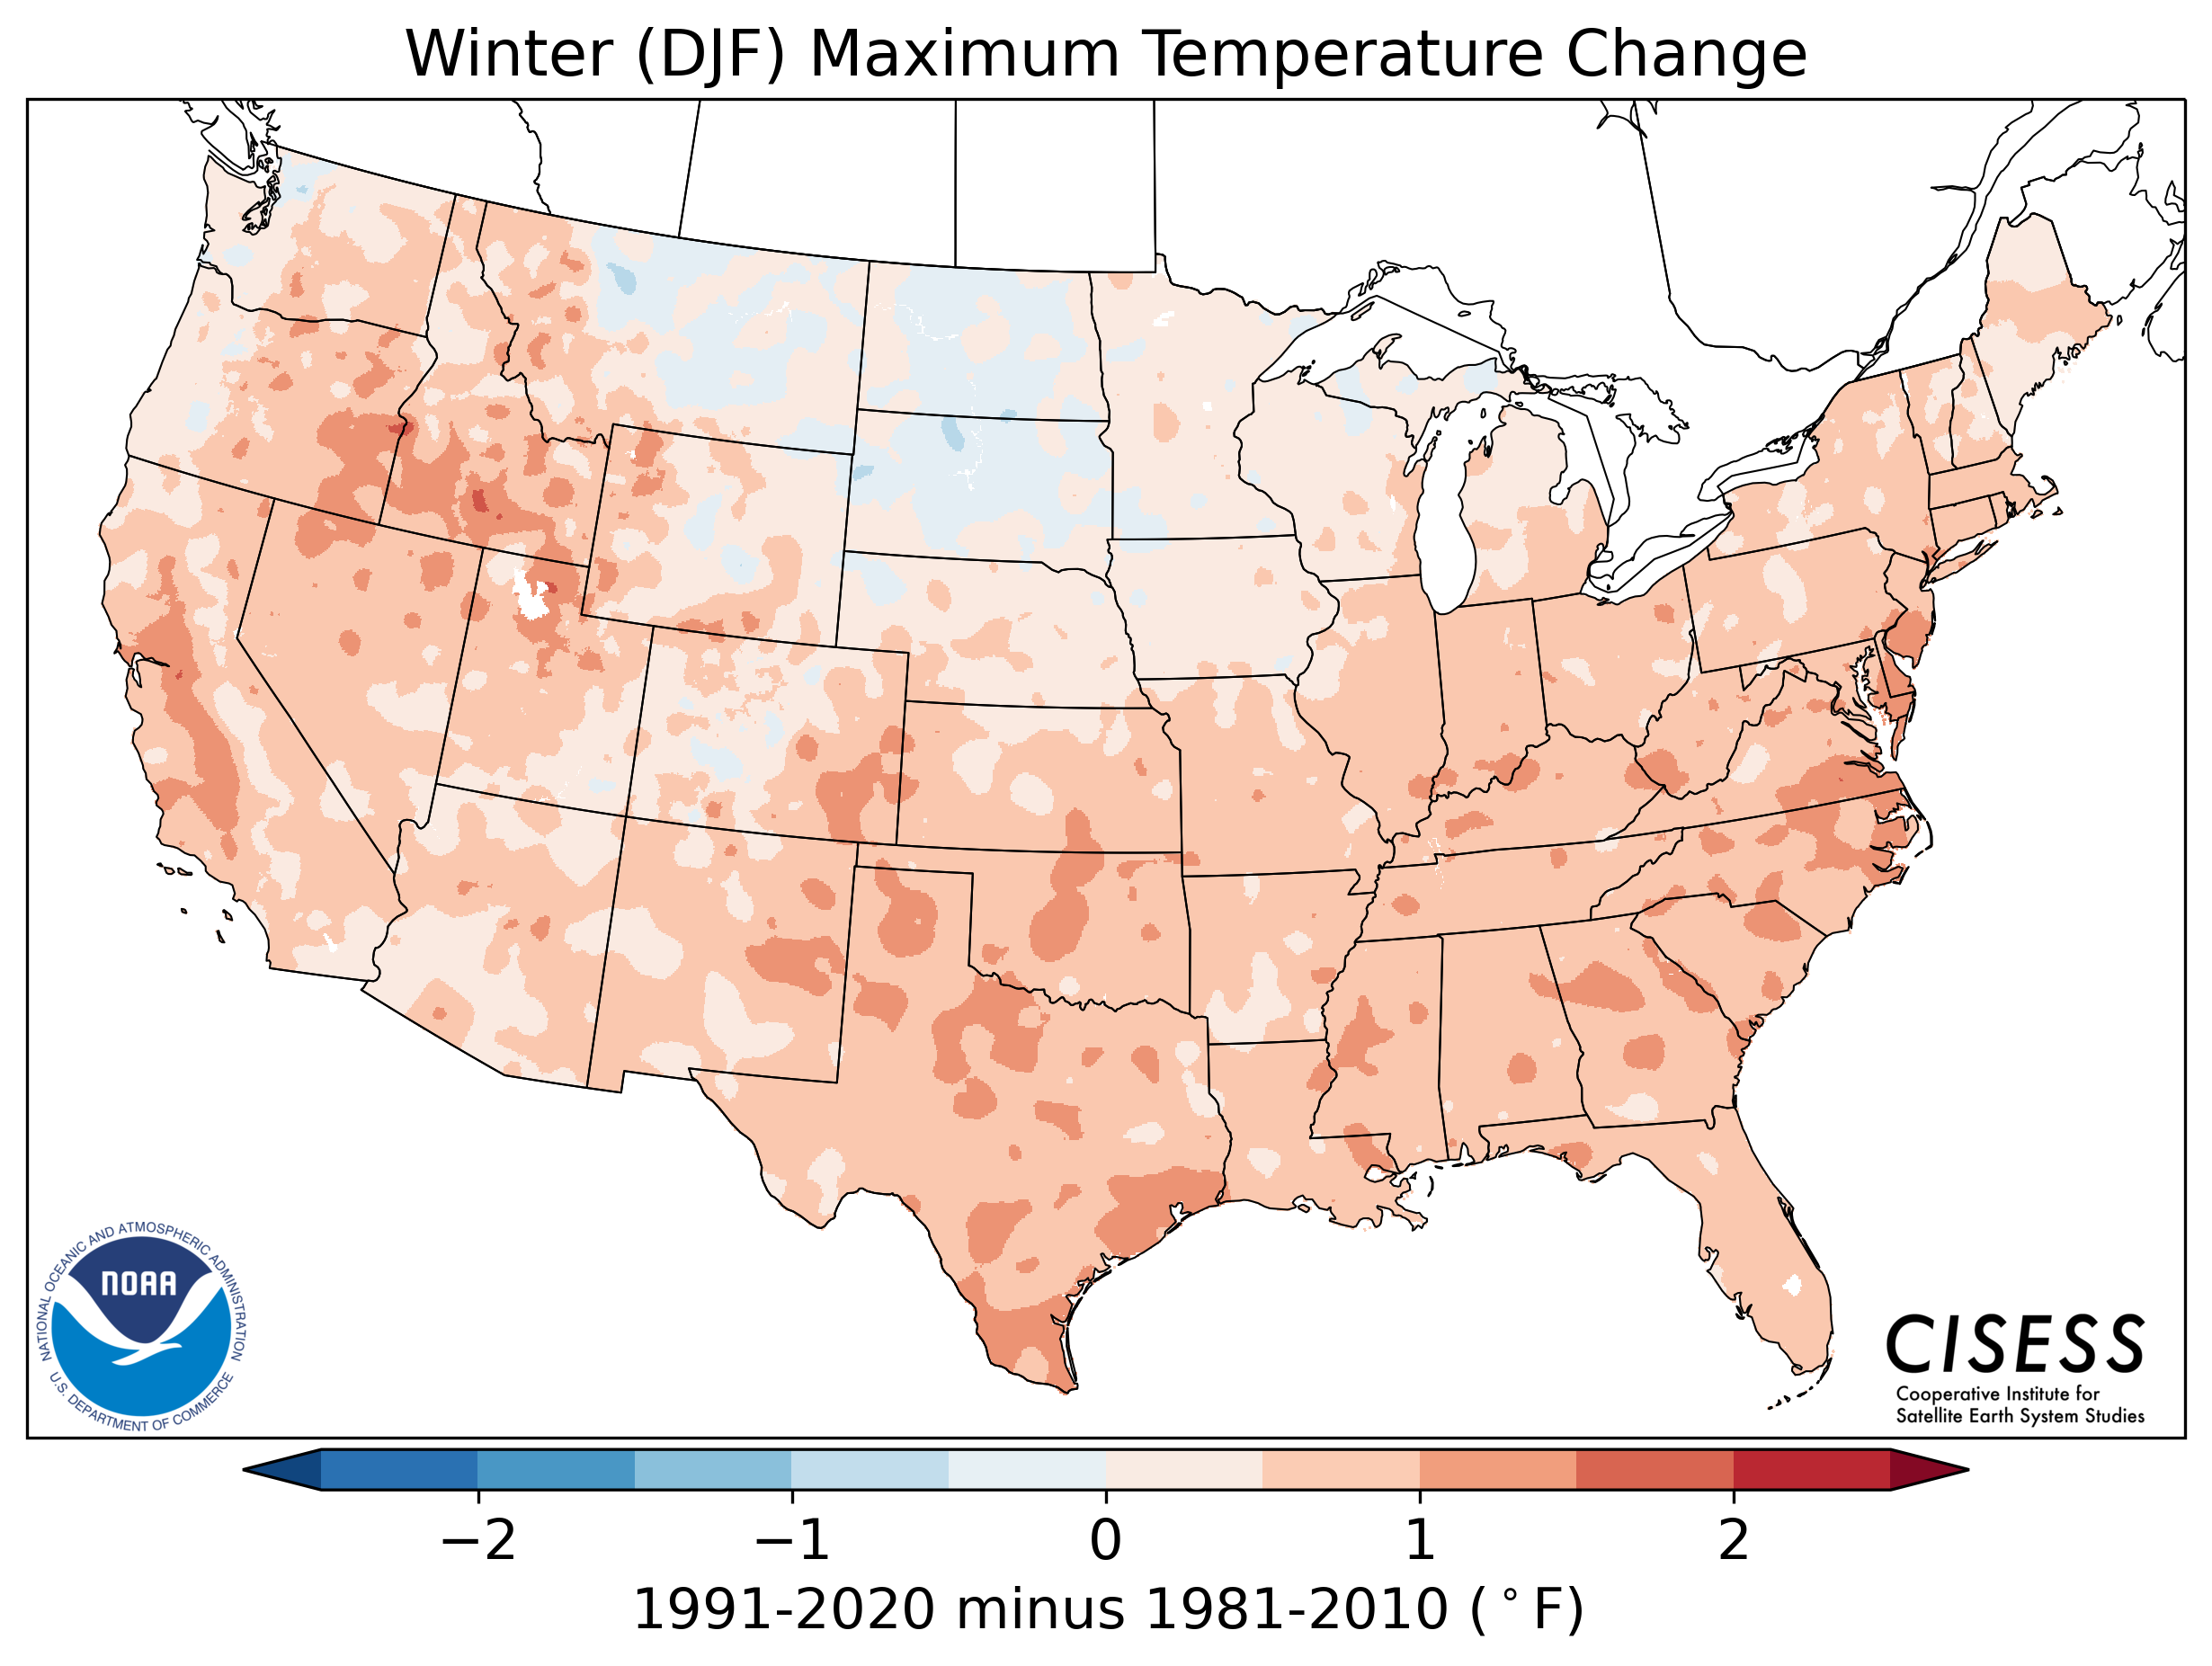
Map shows the spatial change (degrees Fahrenheit) in daily maximum temperature between the most recent/current "normal" period of 1991-2020 and the 1981-2010 normals during the winter months. |
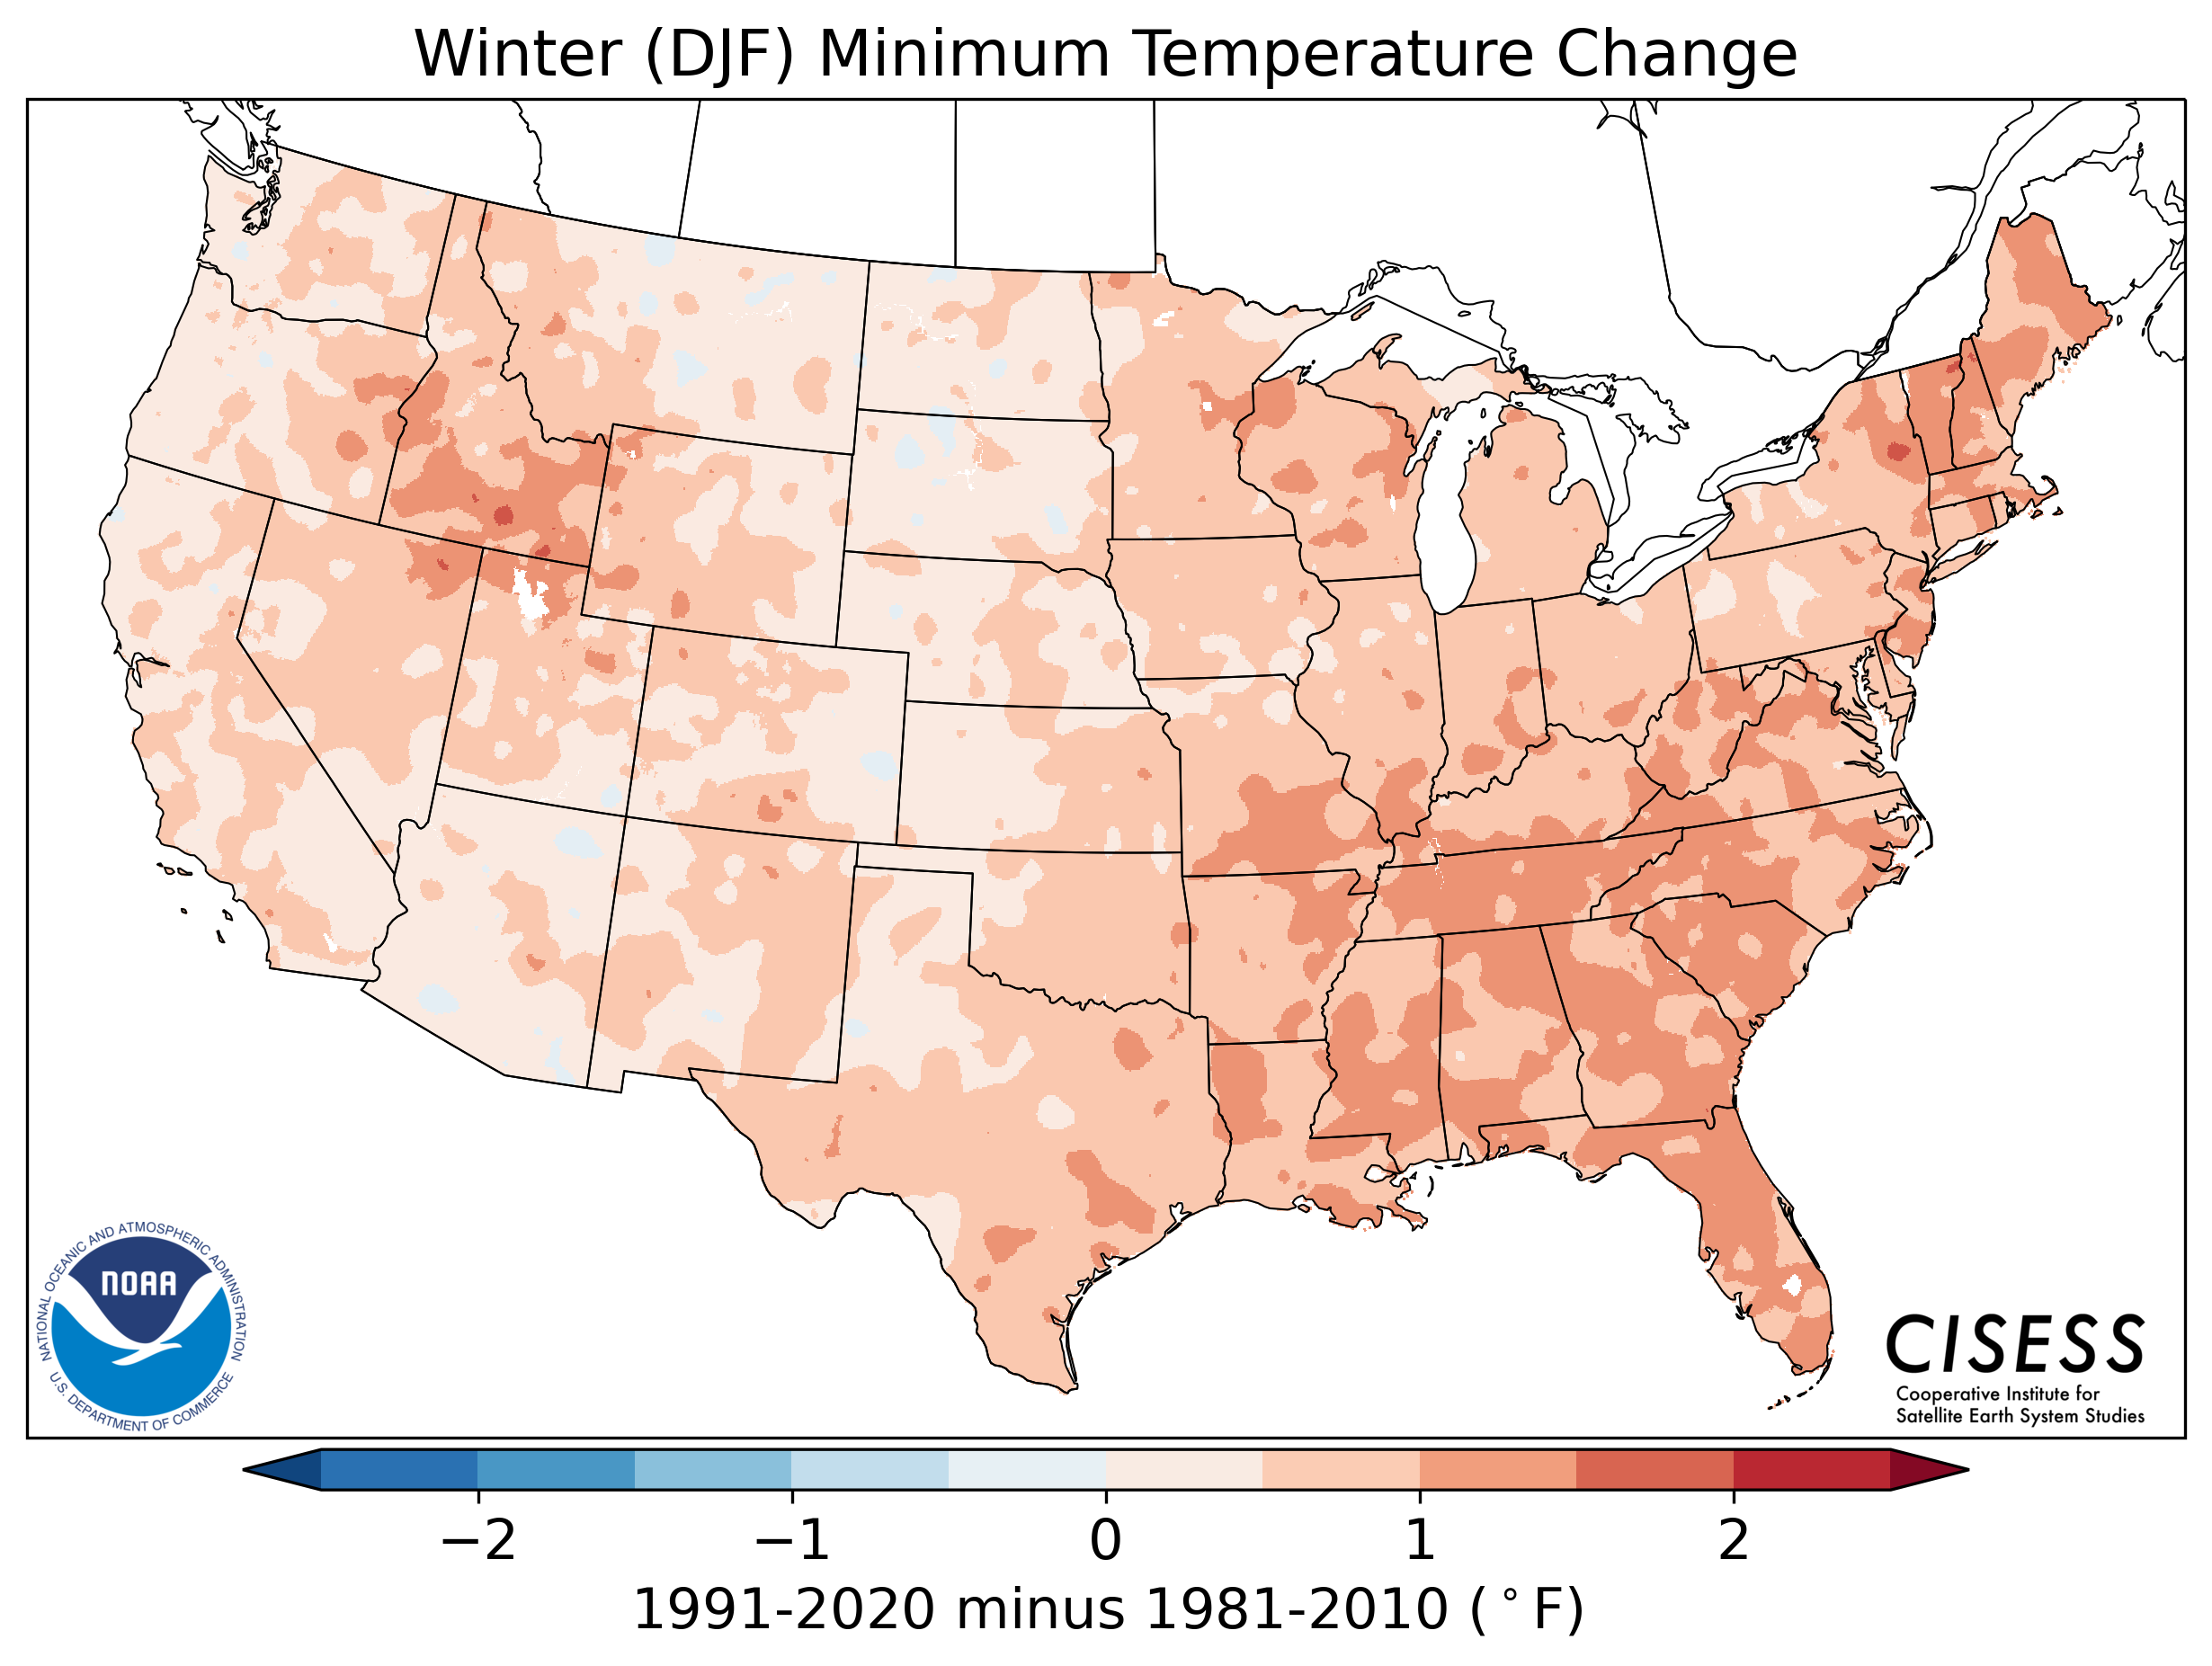
Map shows the spatial change (degrees Fahrenheit) in daily minimum temperature between the most recent/current "normal" period of 1991-2020 and the 1981-2010 normals during the winter months. |
|
Temperatures |
|
 |
 |
|
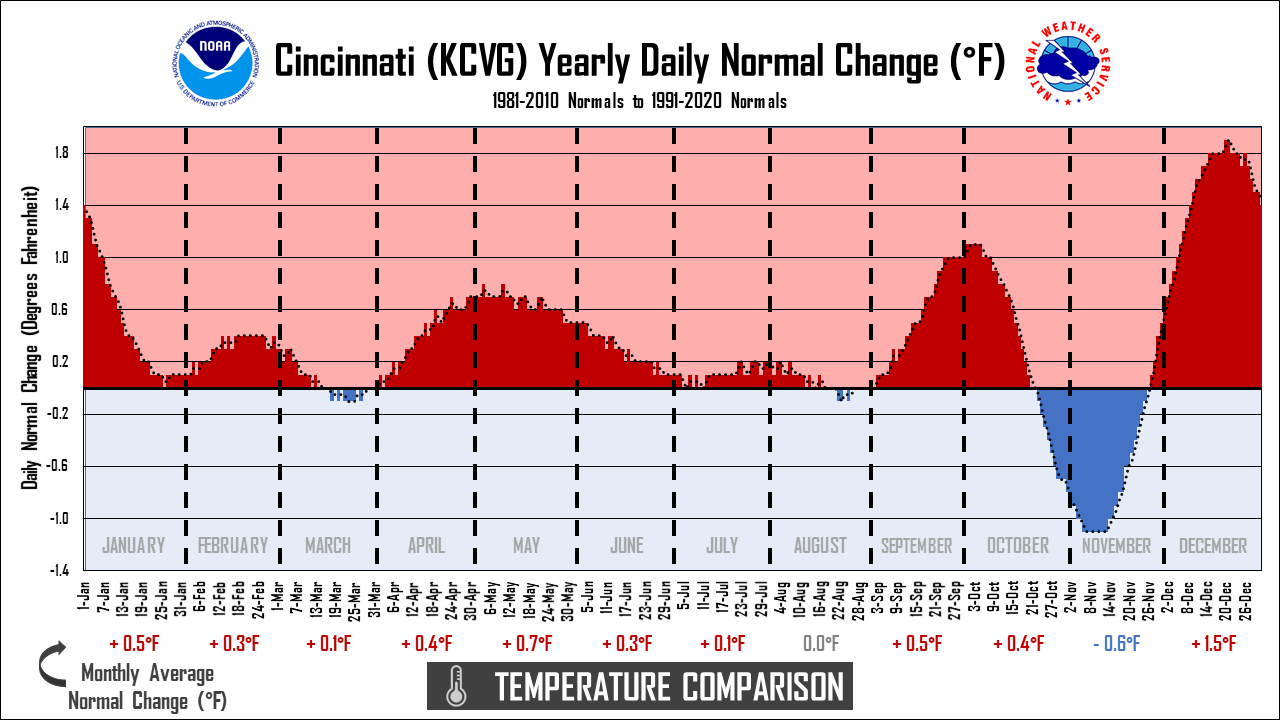
Cincinnati (KCVG) Daily Average Temperature Change (1991-2020 normals to 1981-2010 normals) |
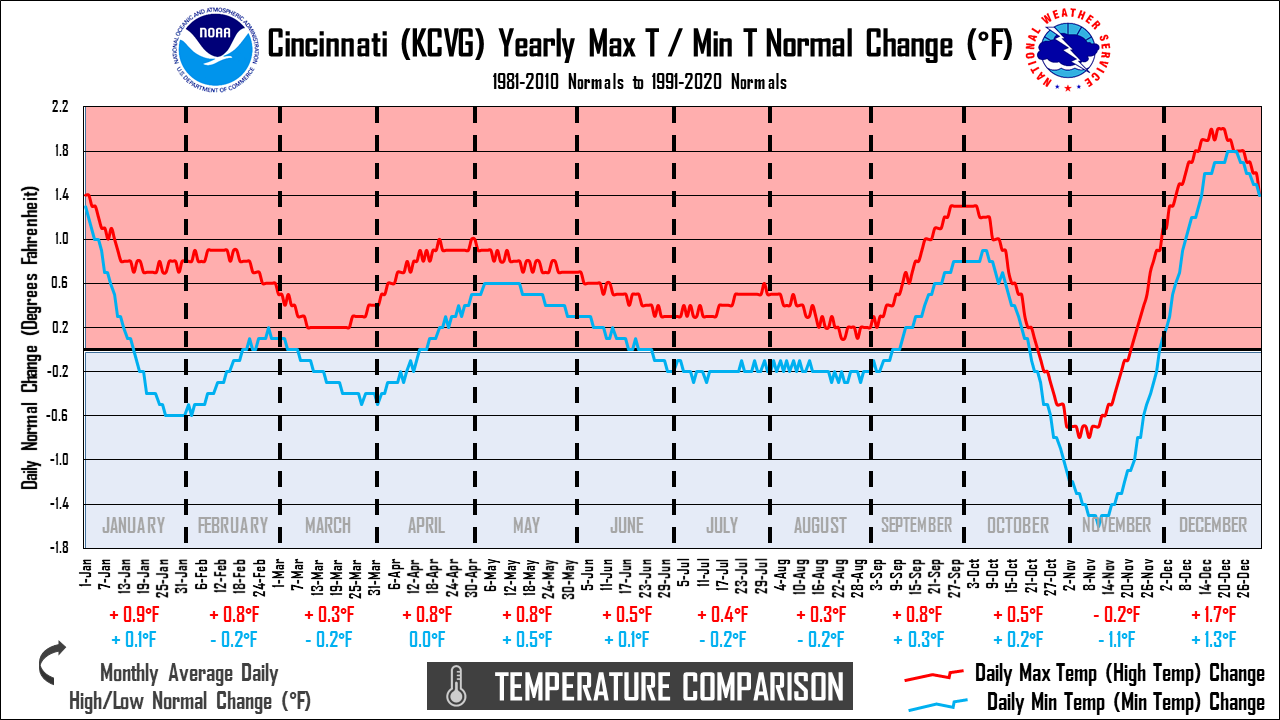
Cincinnati (KCVG) Daily High/Low Temperature Change (1991-2020 normals to 1981-2010 normals) |
|
|
|
 |
 |
|
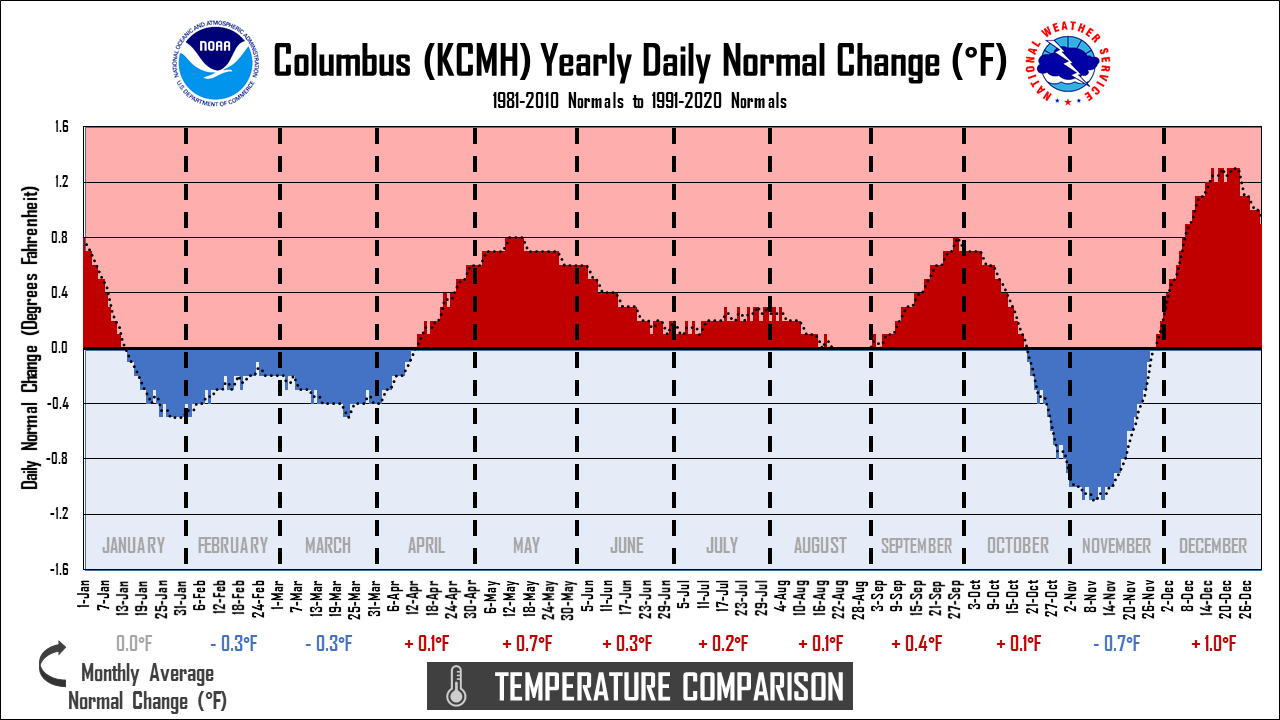
Columbus (KCMH) Daily Average Temperature Change (1991-2020 normals to 1981-2010 normals) |
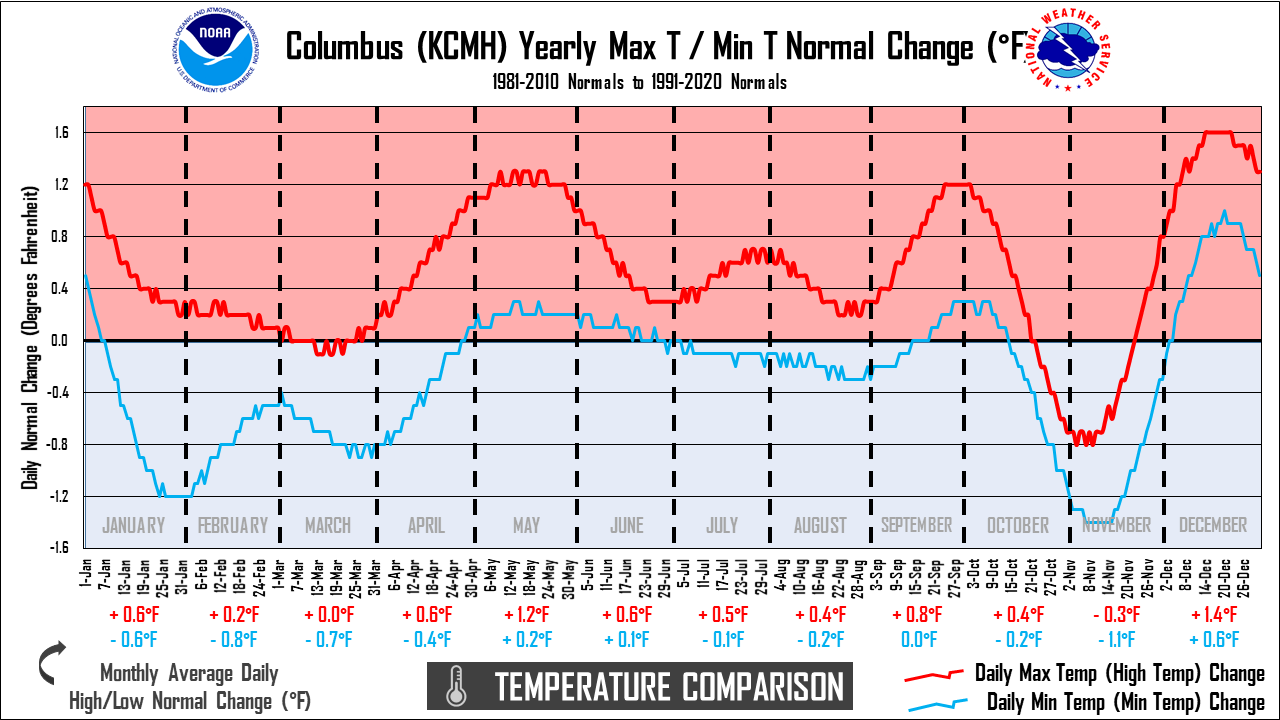
Columbus (KCMH) Daily High/Low Temperature Change (1991-2020 normals to 1981-2010 normals) |
 |
 |
|
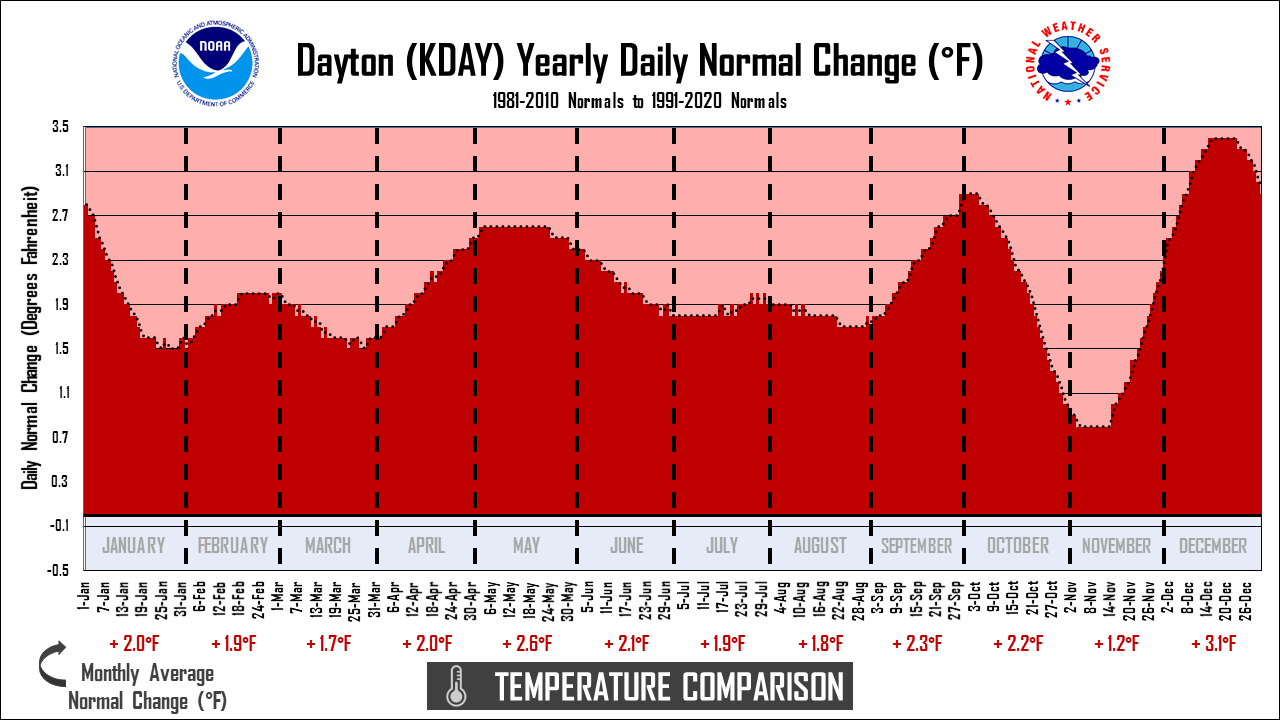
Dayton (KDAY) Daily Average Temperature Change (1991-2020 normals to 1981-2010 normals) |
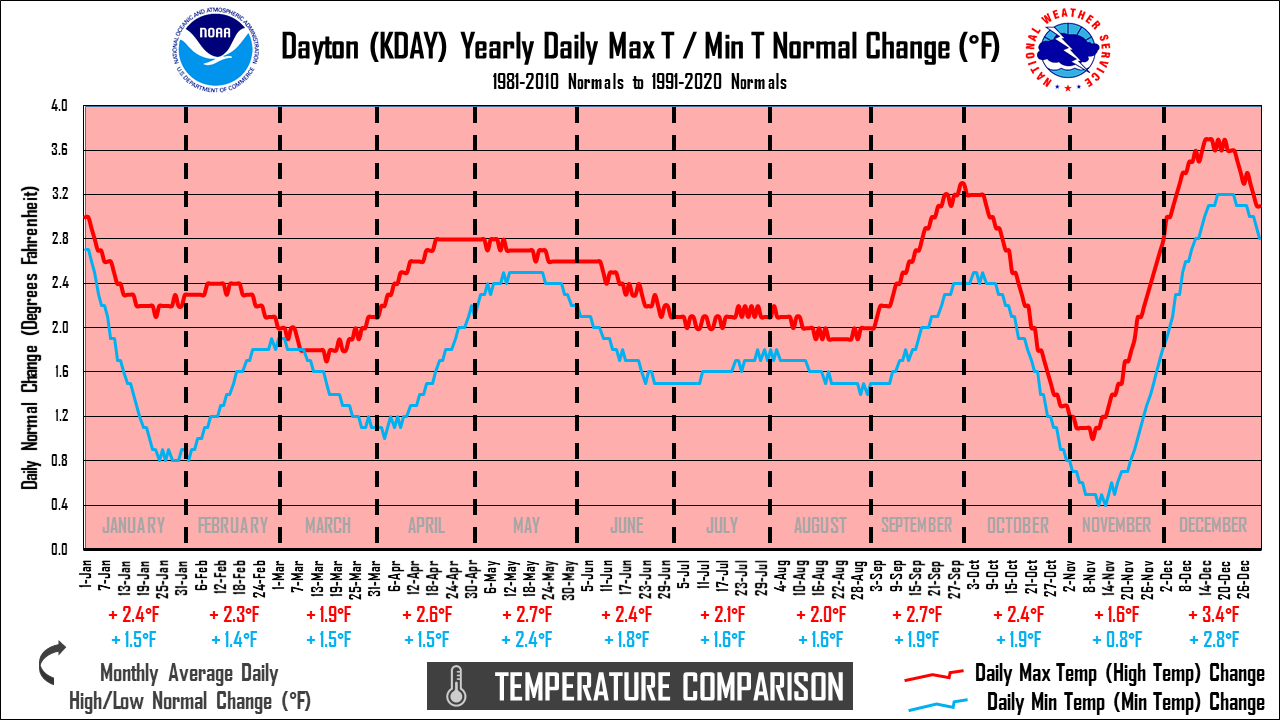
Dayton (KDAY) Daily High/Low Temperature Change (1991-2020 normals to 1981-2010 normals) |
|
|
|
|
Precipitation |
|
 |
 |
|
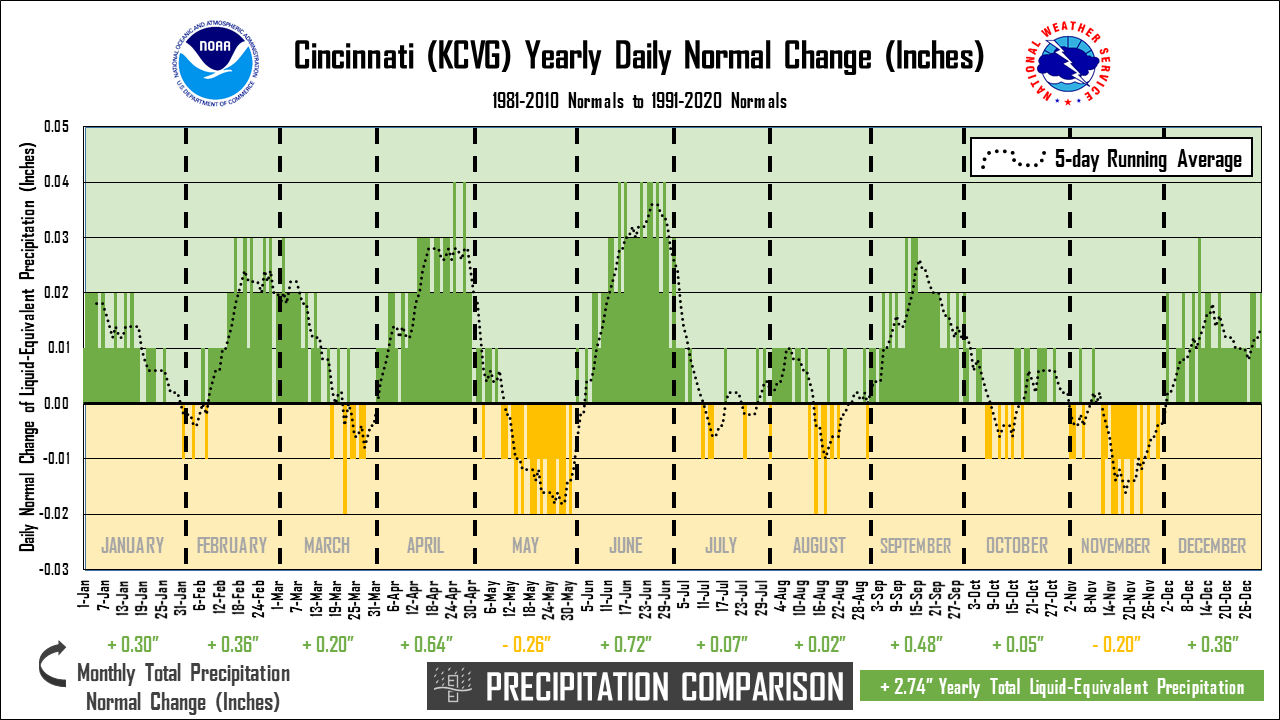
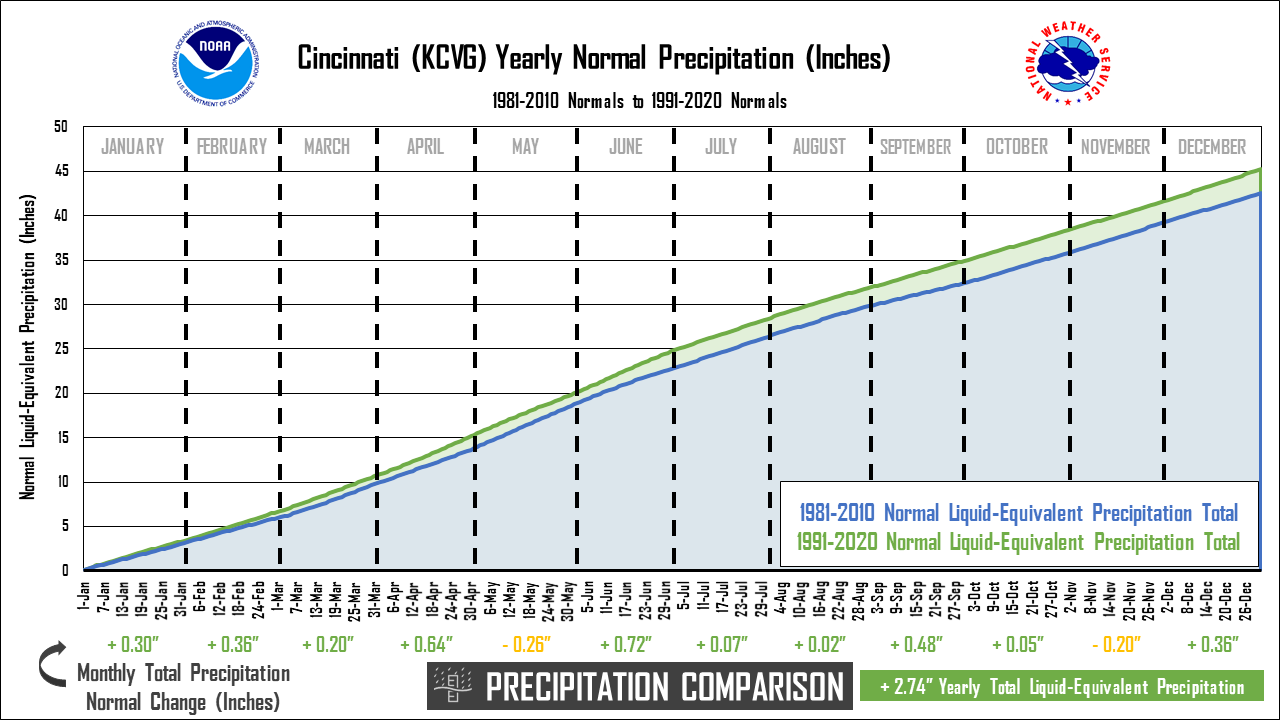
Cincinnati (KCVG) Daily Liquid-Equivalent Precipitation Change (1991-2020 normals to 1981-2010 normals) |
Cincinnati (KCVG) Daily High/Low Temperature Change (1991-2020 normals to 1981-2010 normals) |
 |
 |
|
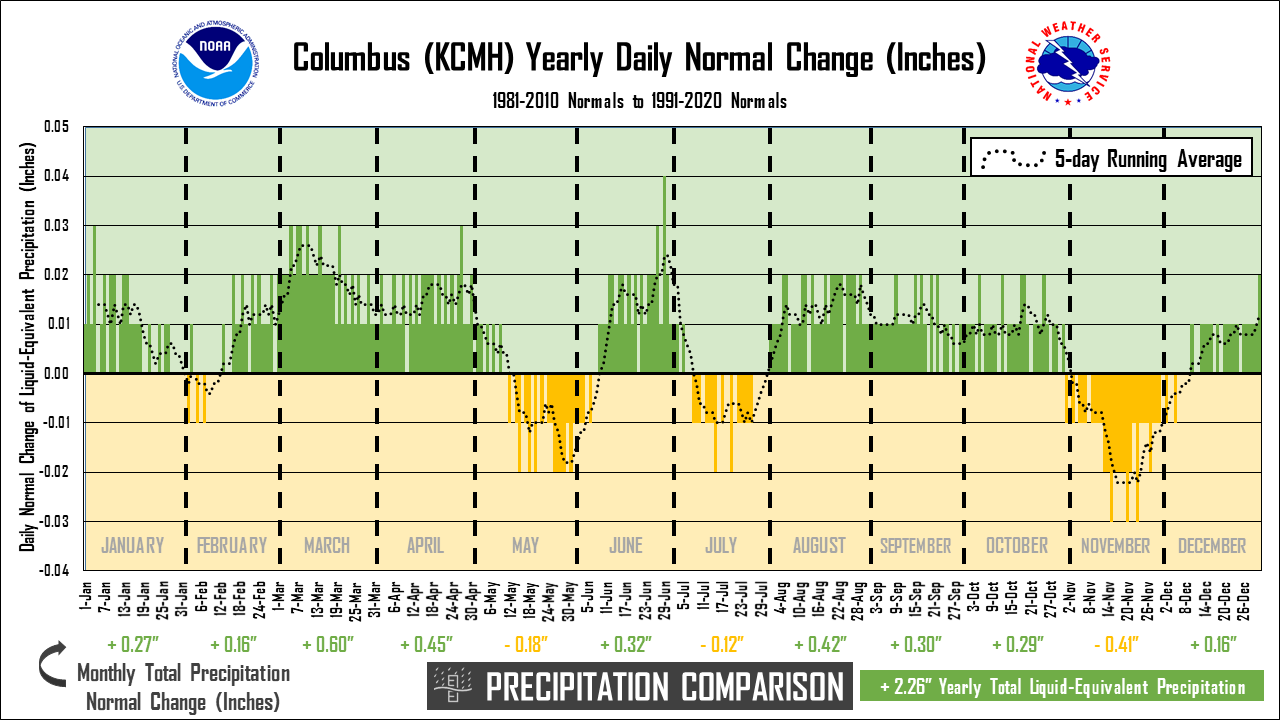
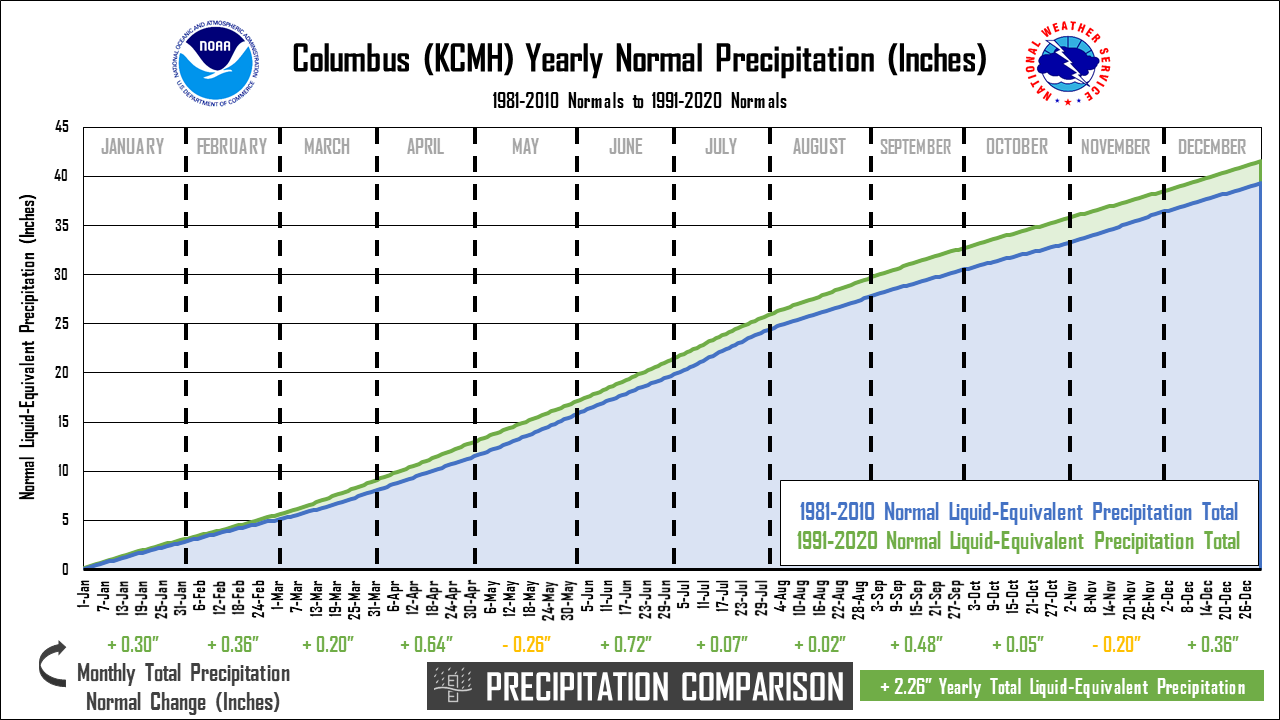
Columbus (KCMH) Daily Liquid-Equivalent Precipitation Change (1991-2020 normals to 1981-2010 normals) |
Columbus (KCMH) Daily High/Low Temperature Change (1991-2020 normals to 1981-2010 normals) |
 |
 |
|
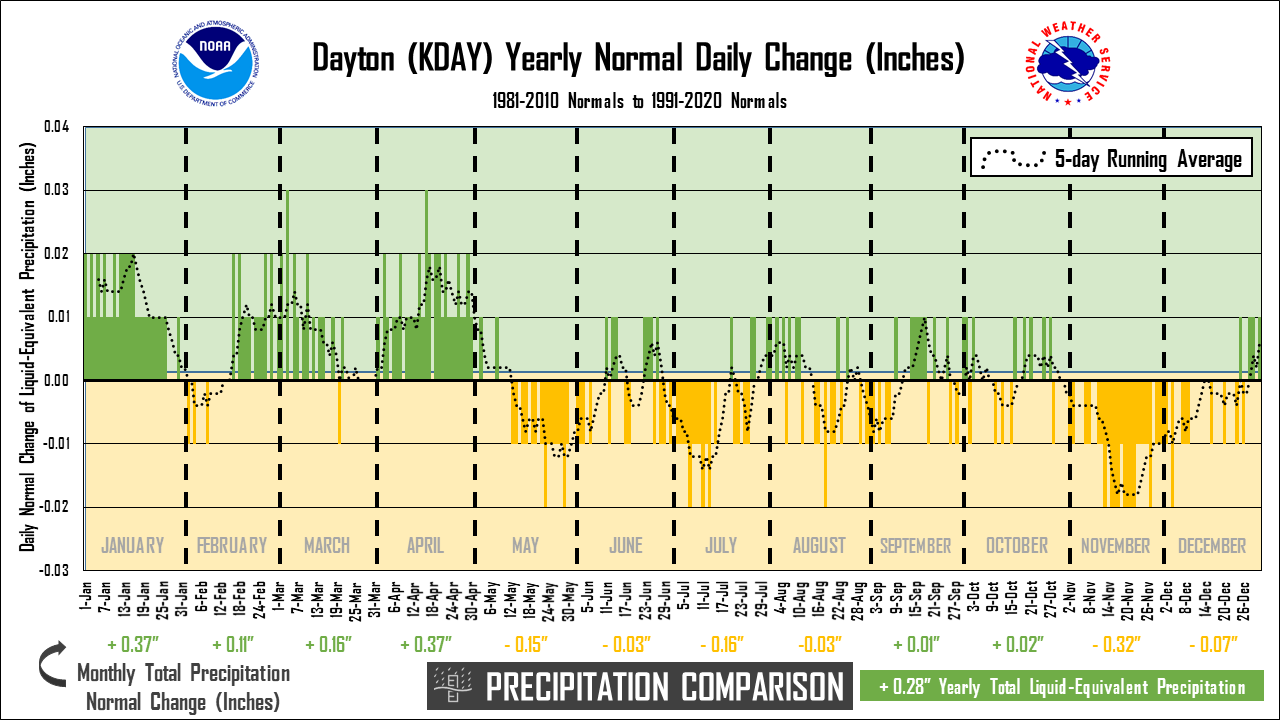
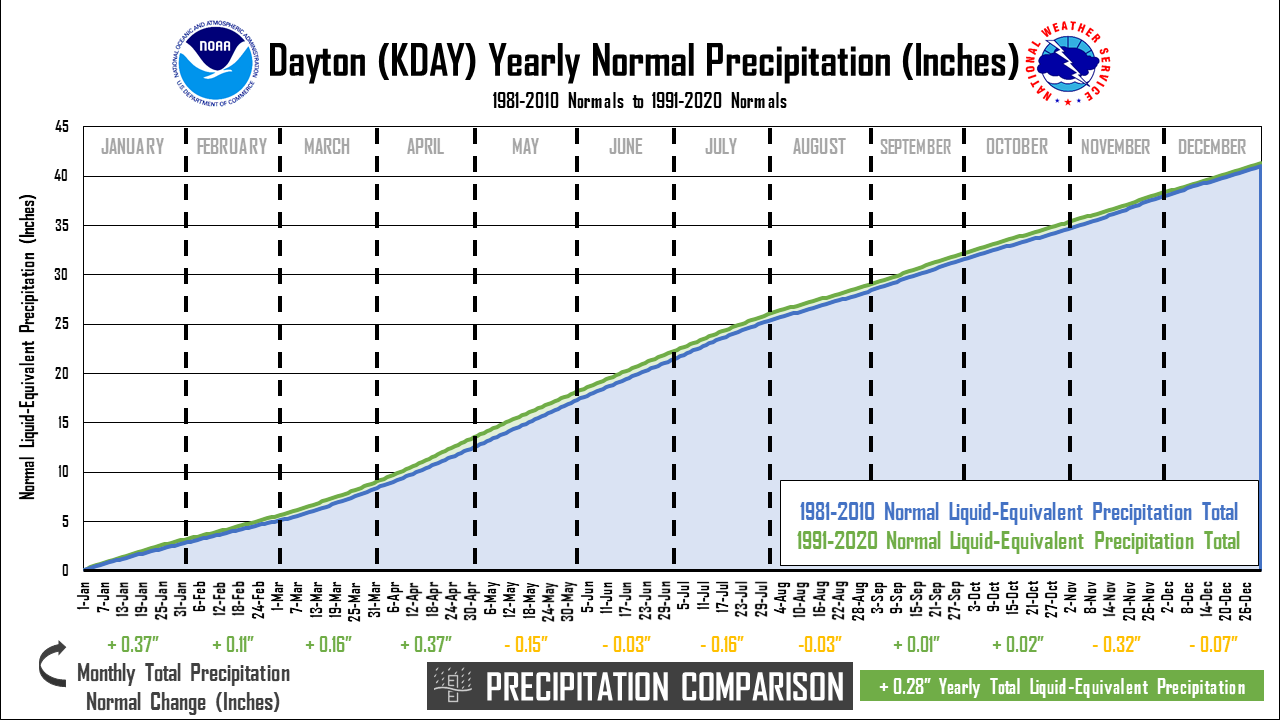
Dayton (KDAY) Daily Liquid-Equivalent Precipitation Change (1991-2020 normals to 1981-2010 normals) |
Dayton (KDAY) Daily High/Low Temperature Change (1991-2020 normals to 1981-2010 normals) |
|
|
|
|
Snowfall |
|
 |
|
|
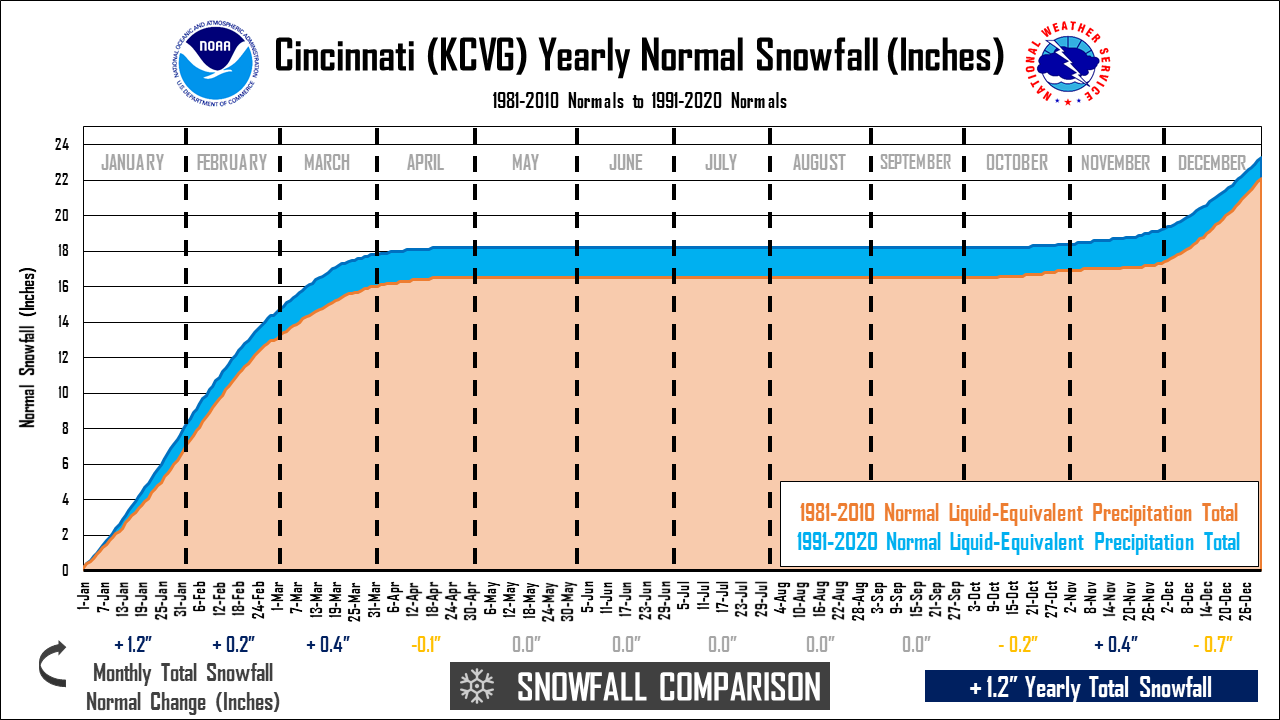
Cincinnati (KCVG) Yearly Snowfall Change (1991-2020 normals to 1981-2010 normals) |
|
 |
|
|
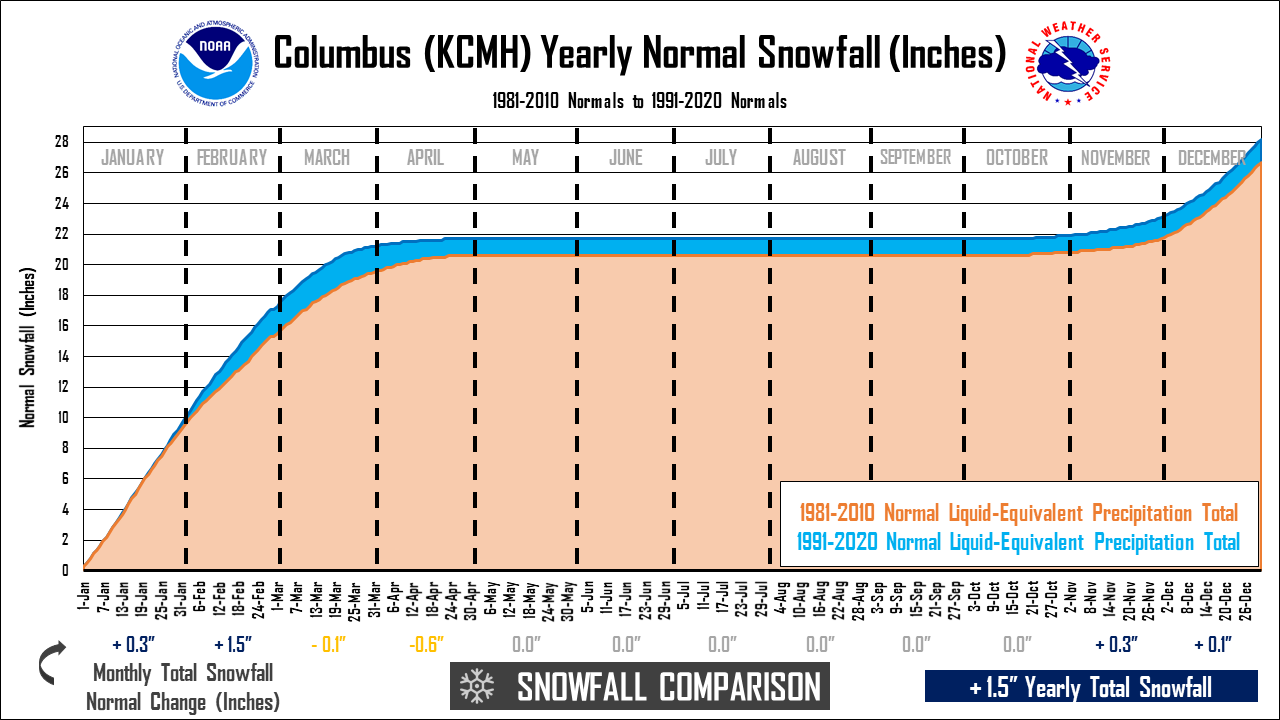
Columbus (KCMH) Yearly Snowfall Change (1991-2020 normals to 1981-2010 normals) |
|
 |
|
|
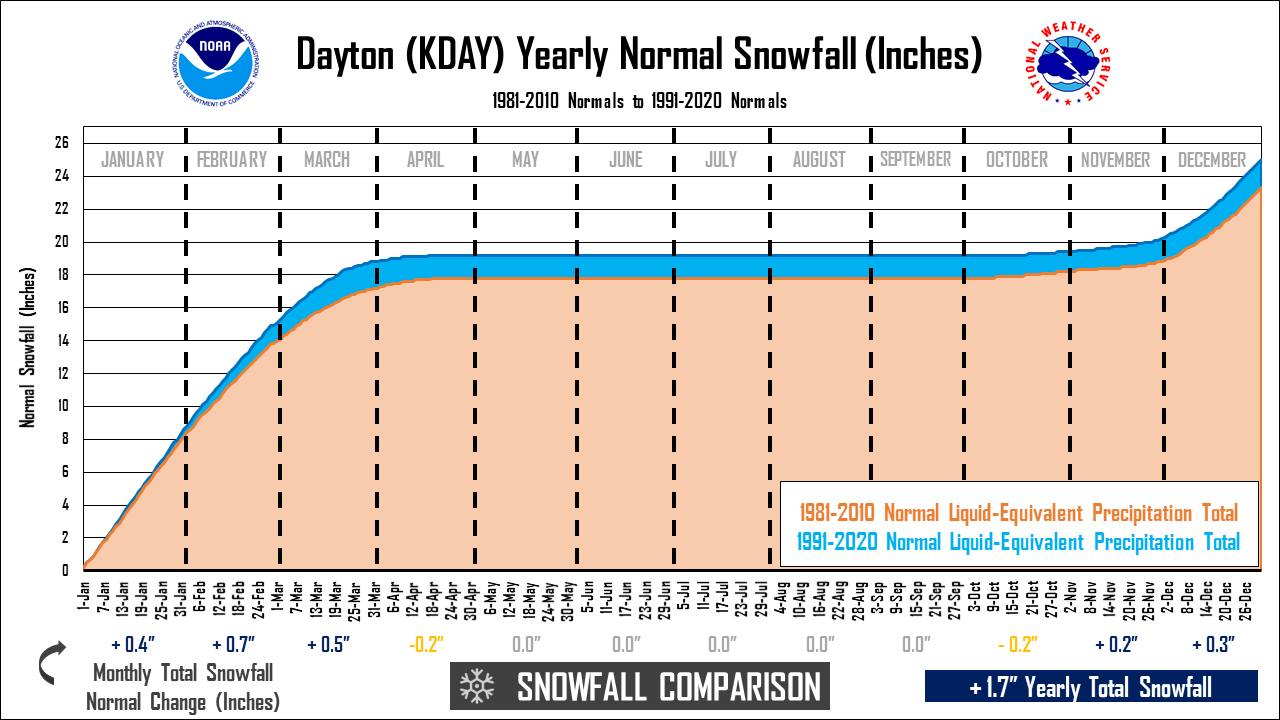
Dayton (KDAY) Daily Liquid-Equivalent Precipitation Change (1991-2020 normals to 1981-2010 normals) |
|
|
|
|

