Northern Indiana
Weather Forecast Office
Click a year to see the seasonal summaries, or read about the database and the 2002-2020 Data below
*Last Updated October 7th, 2023*
Each summer there are an average of 12 fatalities and 23 rescues due to dangerous currents on the Great Lakes (10 year average). The National Weather Service in Northern Indiana maintains the Great Lakes Current Incident Database (GLCID), an 19 year archive of current-related incidents. Case studies were completed on 703 current-related incidents to learn about where and when dangerous currents form. This research improves National Weather Service beach forecasts and beach hazards statements. Victim demographics were also collected to improve beach safety outreach and education efforts. The Great Lakes see millions of visitors per year at State Parks alone, most within a 3-4 month period in the summer. The key to being safe is knowledge. Beachgoers and the water safety community need to understand how, why, where, and when dangerous currents form.
It is important to realize that although there are many incidents that occur at these beaches, the number of incidents must be kept relative to how many people visit the beaches each year. For example: Porter County Indiana, which includes the Indiana Dunes National Lakeshore, recorded 30 current-related incidents between 2002-2020, however over 2 million people visit the Indiana Dunes park alone EACH YEAR! Similarly, Ottawa County in Michigan has seen more than 130 incidents over the years, however they also see around 2 million visitors per year at Holland State Park alone. These beaches are all safe and fun to swim at, however beachgoers must remain alert to the changing weather and wave conditions and heed the advice of park patrol and lifeguards.
Database History
In 1998, 12 year old Travis Brown drowned in a rip current at a Lake Michigan beach along US-2 in Mackinac County, Michigan. Prior to that incident, people didn't think rip currents could happen on the Great Lakes. In memory of Travis, the Brown Family started the Mackinac Water Safety Review team, which included Michigan Sea Grant, local law enforcement, and other members of the community. Eventually, they reached out to the National Weather Service in Marquette, Michigan to see if they could start a forecast on the Great Lakes to alert the public about dangerous waves and currents. One of the forecasters Dave Guenther (now retired) agreed to join the group, and get forecasts started on the Great Lakes. To learn about where, why, and when the currents developed, Dave started the Great Lakes Current Incident Database. Once Dave retired in January 2011, he handed the task to Megan Dodson, who now maintains the database from NWS Northern Indiana. Forecasts are now done at nearly all NWS Offices on the Great Lakes, and outreach has greatly improved as a result of the database. Thanks to a collaborative project between Michigan Sea Grant and the Michigan Department of Environment, Great Lakes, and Energy's Coastal Management Program, the database is available online.
Searching the Database & Reporting an Incident
To search the database for more detailed information, click here. To submit a current-related incident into the database, please use this form. Any incidents submitted using the form will be sent to Megan Dodson for review before being entered in. We accept incidents that occurred from 2002 to present. If you have any questions or concerns, email Ms. Dodson at NWS Northern Indiana (megan.dodson@noaa.gov).
About Swim Season Summaries
Each swim season, which runs from roughly May 1st to October 15th each year, NWS Northern Indiana writes up a summary of the incidents that occurred that year. The summary is usually posted by January each year, but delays may occur if there is difficulty in confirming incidents with authorities (pending final police reports, witness/survivor interviews, etc.).
There are several dangerous currents that can cause a swimmer to struggle on the Great Lakes. The currents that have most often claimed lives since 2002 are structural currents, rip currents, outlet currents, longshore currents, and channel currents. According to the National Weather Service (NWS) Great Lakes Current Incident Database (GLCID), the Great Lakes averages around 12 drowning fatalities per year related to dangerous currents. Most of these dangerous current incidents occur on Lake Michigan (Fig. 2) because its eastern shores are positioned favorably for current development, and it is a popular tourist destination (Fig. 7). Note that the incidents collected in the GLCID are current related, meaning currents may have been only a partial cause of the fatality or rescue (likely a combination of high waves and currents).To learn about the various types of currents, visit this webpage.
When Great Lakes current related incidents are analyzed, several commonalities emerge. First, a majority of the incidents occur during, or just after high wave action. Most of the wave periods during the incident were short, meaning there is less time in between each incoming wave (less time for swimmers to recover in between waves). Waves were likely an equal contributor in many of the incidents. Once a swimmer is pulled into deeper water by the current, the waves quickly become overwhelming. Secondly, most of the incidents occur near shoreline structures, such as a breakwall or pier.
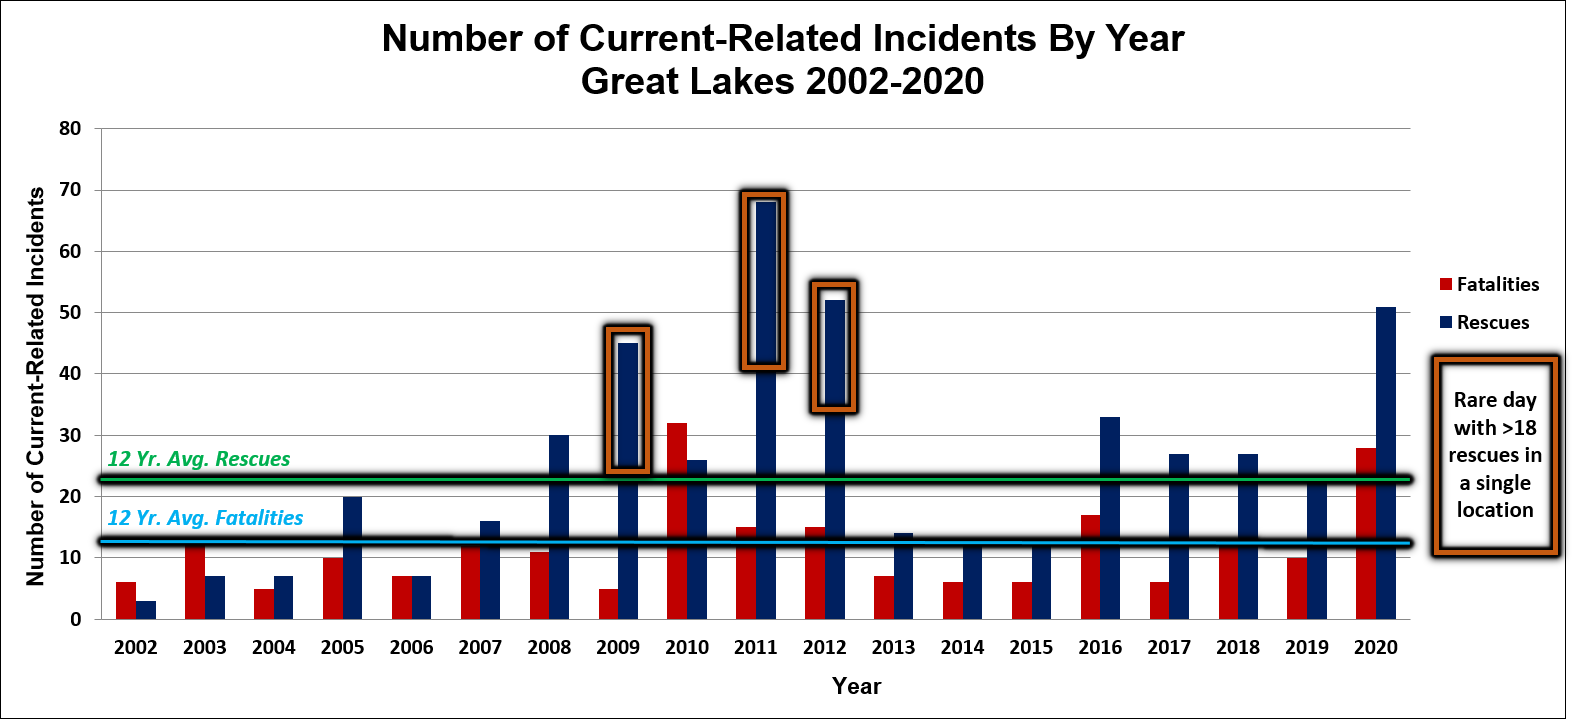
Fig. 1. A graph of current related incidents from 2002-2020. The years of 2009, 2011, and 2012 were years where there was one day with greater than 18 rescues, which are marked by orange boxes in this graph. Averages are marked by the blue (fatalities) and green lines (rescues) (GLCID, 2020).
Current-Related Incidents By Lake
Lake Michigan has the most current related incidents of all the Great Lakes. This is because Lake Michigan (mainly the eastern shore) is favorably aligned for the weather and wave conditions conducive to current formation, and many beaches along the shoreline have sandbars and breakwalls. Additionally, Lake Michigan sees extensive tourism. One limitation of the database is the lack of data we have from the Canadian shores of the Great Lakes. As a result, it is likely that the numbers for Lakes Erie, Huron, Ontario, and Superior are under reported in comparison to Lake Michigan.
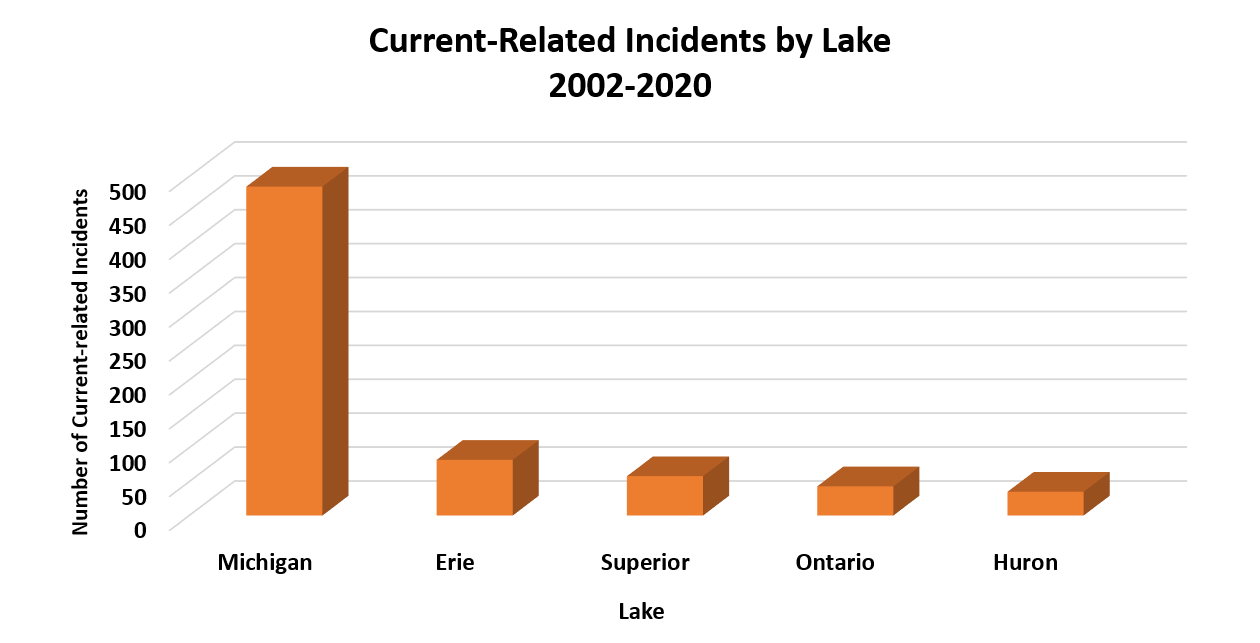
Fig. 2. Number of current-related incidents by Great Lake for 2002-2020. "Incidents" include both rescues and fatalities. GLCID (2020).
Conditions that Lead to Dangerous Currents and High Wave Action
Dangerous currents develop on the Great Lakes when the waves approach the beach around a 30 to 90 degree angle relative to shore (Fig. 3), and wave heights are 3 feet or greater (Fig. 4). Moderate to high waves are conducive to currents because they 'pile up' the water near the beach, which causes the surface of the water to be uneven. Water can also 'pile up' near a shoreline structure, like a breakwall, or near a river mouth. The water must return into the lake or the ocean, so it flows outward as a rip current, structural current, or outlet current. Longer wave periods (the time in between each successive wave) also work to 'pile up' water near the beach. On the ocean, rip currents are typically associated with wave periods greater than 9 seconds, but can occur when wave periods are as short as 4 seconds. On the Great Lakes, most of the incidents occur when wave periods are 4 to 5 seconds (Fig. 5), which is reasonable given the average wave period on the Great Lakes is 3 to 4 seconds.
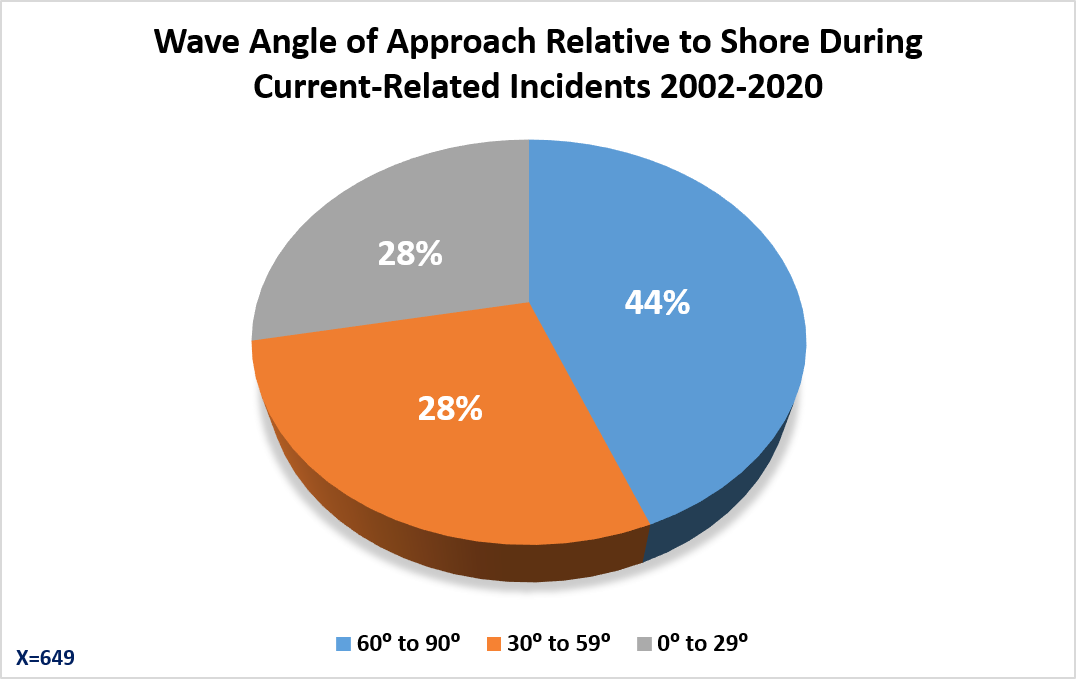
Fig. 3. Orientation of the winds (waves) relative to the shore during outward flowing current-related incidents (structural, rip, outlet). Waves moving onshore at a 60-90 degree angle will most often lead to rip currents, whereas waves moving onshore at a more oblique angle (especially 30-59 degrees) will produce primarily structural currents. Keep in mind, however, that 30-59 degree angle approaches can also lead to rip currents that develop more diagonally to shore (versus perpendicular to shore). Most of the incidents on the Great Lakes are caused by structural and rip currents, so it is reasonable that we see a large number of the incidents occurring when waves are approaching the beach at oblique angles (GLCID, 2020).
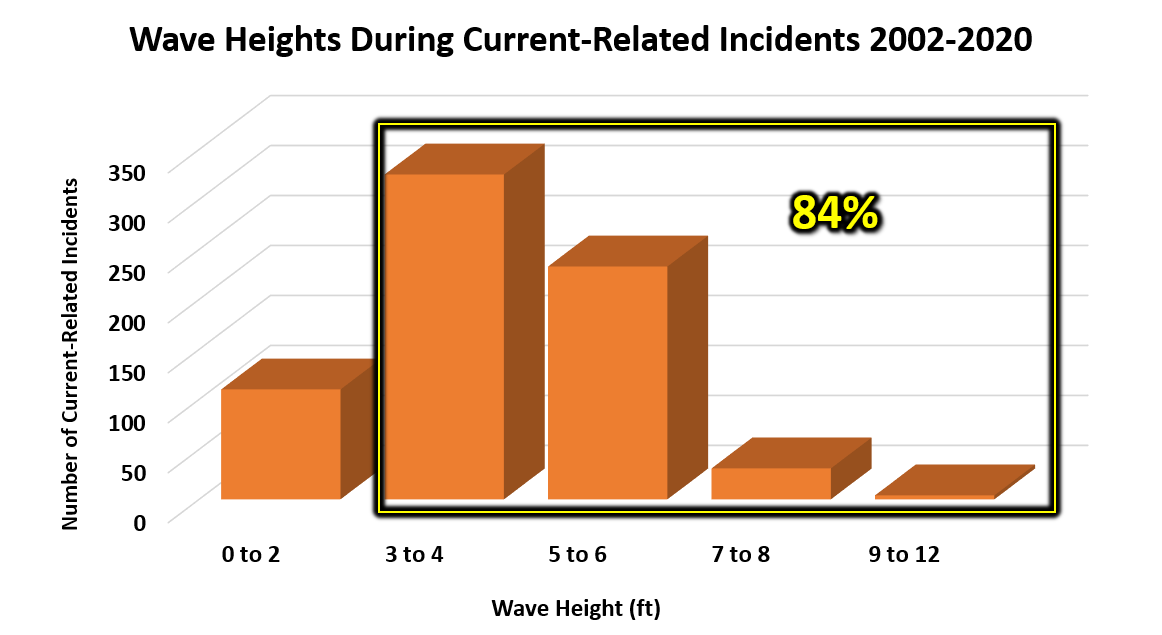
Fig. 4. A majority (84%) of current related incidents occur during moderate to high wave action. Incidents decrease dramatically after 6 feet because most people are too intimidated to swim when waves are above their head (GLCID, 2020)
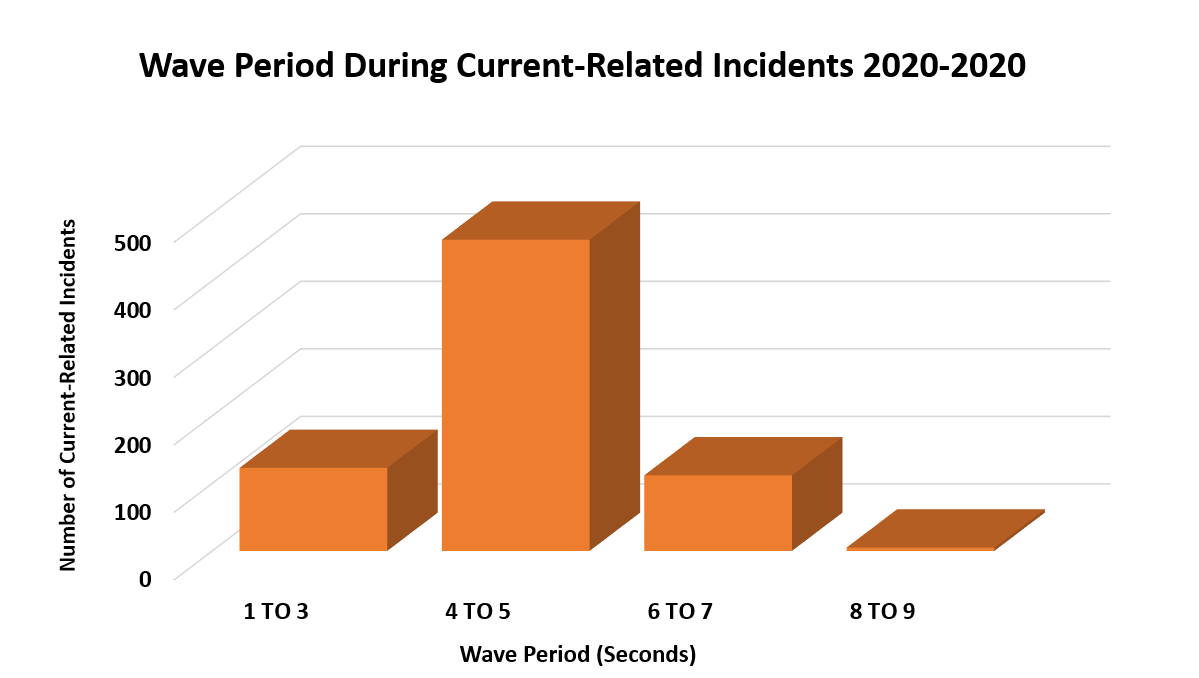
Fig. 5. Wave periods during current related incidents on the Great Lakes. Wave periods are typically 4 to 5 seconds. Longer wave periods are more conducive to developing strong rip currents on the ocean and the Great Lakes. However, wave periods on the Great Lakes are fetch limited (limited by the distance the wind can travel across the lake), so periods are often less than 7 seconds (GLCID, 2020).
Current Related Incidents on the Great Lakes
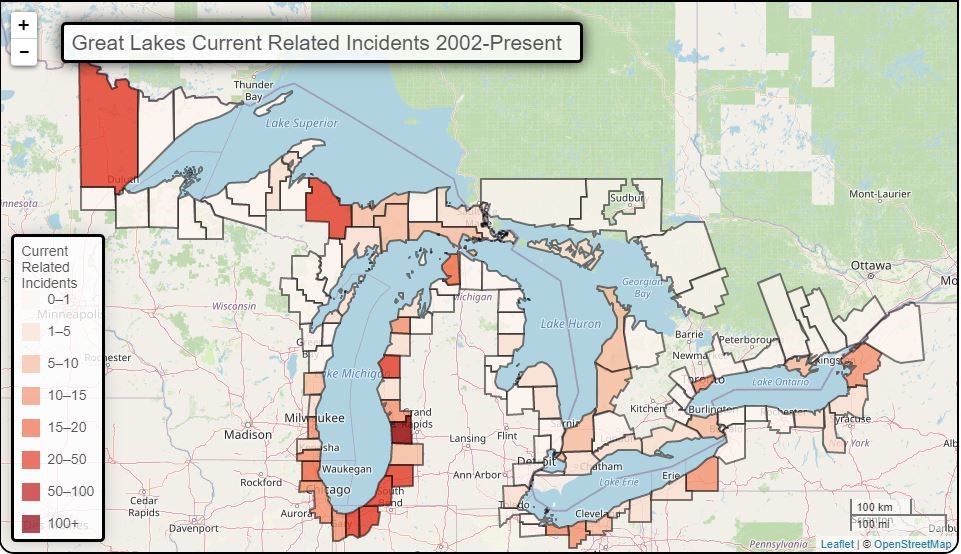
Fig. 6. Shows the number of current related incidents on the Great Lakes by county (for an interactive version, visit the main page). The prevailing wind directions over the Great Lakes are west, southwest, and northwest (Center, Fig. 7). This is why a majority of the incidents (seen as the darker red colors) are seen on the eastern, southern, and northern shores of each of the Lakes. These wind directions are often associated with the passage of a cold front (which causes winds to veer from southwest to northwest over a time period). With stronger winds out of these directions, waves can get high on the lakeshore, which can develop dangerous currents (GLCID, 2020).
Lake Michigan: Tourism + Favorable Conditions and Features for Current Development
Onshore directed winds and waves, shoreline structures, warm water and air temperatures, and popular tourist destinations all come together in late July-early August to bring higher numbers of incidents (rescues and fatalities) to the southeastern shore of Lake Michigan (Fig. 7). The most common pattern associated with current-related incidents on the Great Lakes, is the passage of a cold front because it often brings stronger onshore winds, and hence larger waves (Fig. 8).
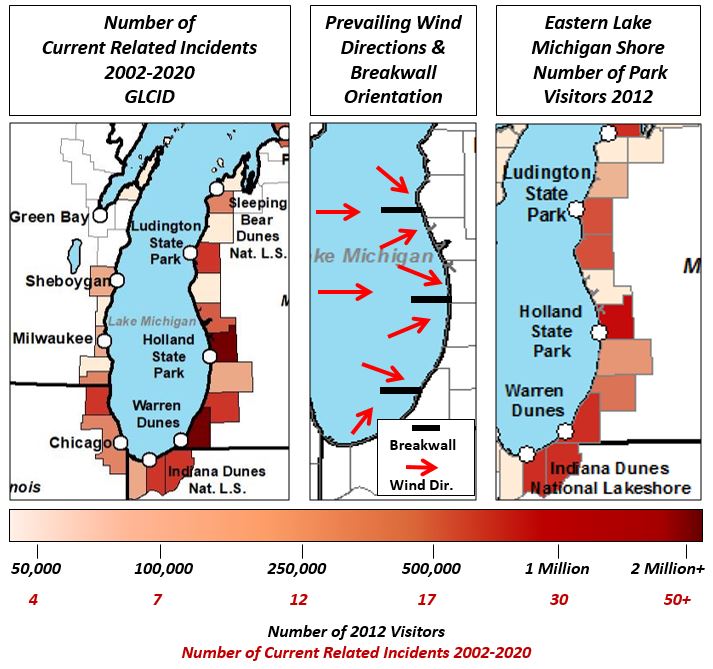
Fig. 7. The map on the left depicts the most common location for current related incidents (GLCID, 2002-2019). The middle map depicts the breakwalls (black rectangles) and the most common wind directions (red arrows) over Lake Michigan. The breakwalls are not realistic in size/length-they were drawn large for easy visibility. The map on the right is the number of visitors to state and national parks in 2012. The combination of frequent favorable wind directions for current development, beach features (breakwalls, sandbars), and popularity cause Lake Michigan to have more incidents than all of the other Great Lakes.
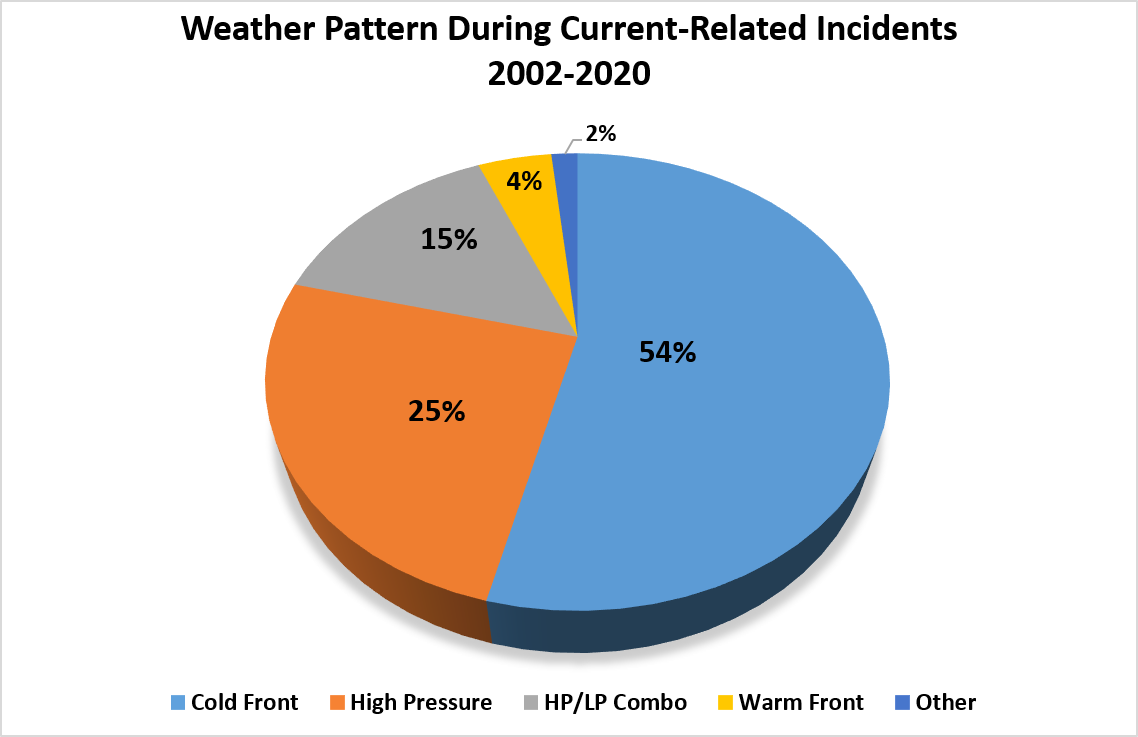
Fig. 8. The most common pattern observed during outward flowing current related incidents on the Great Lakes is the passage of a cold front. HP/LP stands for high and low pressure-where the pattern may have been such that the beach was in between both features. Does not include channel current/longshore current related incidents (X=672 incidents). GLCID (2020).
It is important to realize that although there are many incidents that occur at these beaches, the number of incidents must be kept relative to how many people visit the beaches each year. For example: Porter County Indiana, which includes the Indiana Dunes National Lakeshore, recorded 30 current related incidents between 2002-2020, however over 2 million people visit the Indiana Dunes park alone EACH YEAR! Similarly, Ottawa County in Michigan has seen more than 130 incidents over the years, however they also see around 2 million visitors per year at Holland State Park alone. These beaches are all safe and fun to swim at, however beachgoers must remain alert to the changing weather and wave conditions and heed the advice of park patrol and lifeguards. Additionally, visitors should always stay away from shoreline structures and river mouths, as dangerous currents often form there.
For references, click HERE.
Overview
Air and water temperatures across the Great Lakes were colder than normal throughout the 2014 swim season. This led to less current related fatalities and rescues. July was particularly cool, with temperatures averaging 6 to 7 degrees below normal (Fig.1). According to the Summer 2014 climate summary from the Grand Rapids National Weather Service (NWS), locations in southwestern lower Michigan (Lansing, Grand Rapids, Muskegon, and Jackson) didn't even reach 90 degrees until after August 31st. For Grand Rapids this was the first time since 1951 to see such a late season arrival of a 90-degree day. Similarly, according to the Summer 2014 Climate Summary from the NWS in Cleveland, Ohio, the average maximum temperatures in Cleveland for the summer season were 1.9 degrees below normal. Temperatures in Cleveland only climbed above 90 degrees three times during the summer, which is about five times less than a typical summer in that area.
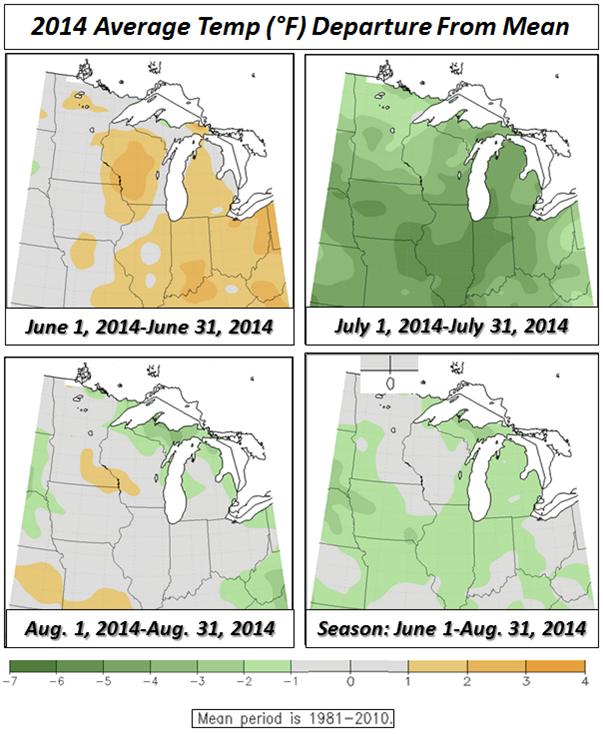
Fig. 1. Average Mean Temperatures: Departure From Mean (F). Darker green shows cooler than average temperatures. Darker yellow shows warmer than average temperatures. From the Midwestern Regional Climate Center
With the cold winter season of 2013-2014 and a cooler summer, water temperatures on the Great Lakes struggled to reach the average. Lake Michigan saw average surface water temperatures rivaling those of 2009, reaching a peak of only 68 degrees F in August (Fig. 2). Meanwhile, icebergs were still floating on Lake Superior until roughly June 10, 2014 (Fig. 3).
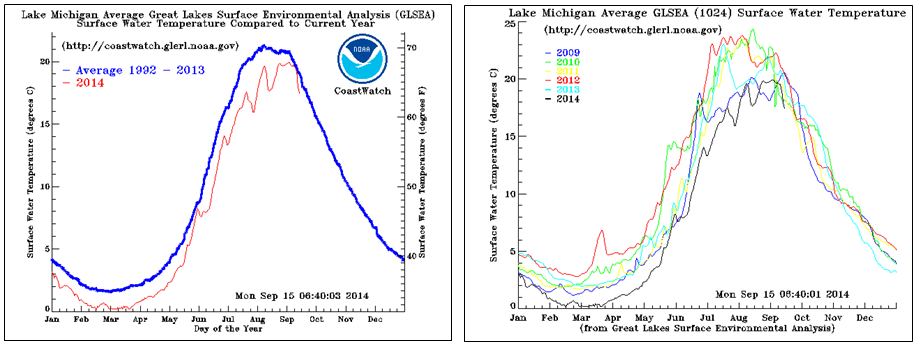
Fig. 2. Lake Michigan Average Surface Water Temperatures (1992-2013) compared to 2014 (left). Comparison of Lake Michigan Average Water Temperatures (Deg. C) 2009-2014. Images from The Great Lakes Environmental Research Lab.
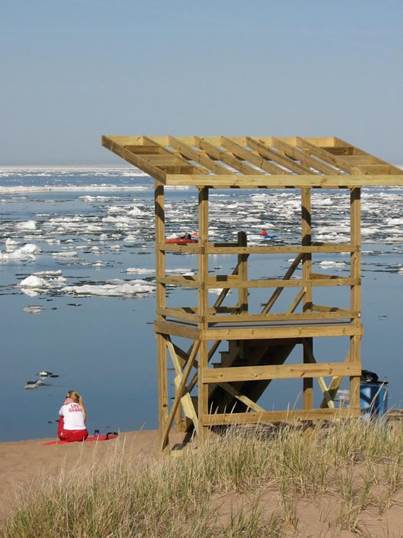
Fig. 3. Ice at McCarty's Cove, Marquette Mich. on Lake Superior in early June, 2014.
Image courtesy of Don Rolfson.
Cooler water temperatures through the season also kept conditions over the lakes relatively stable during a better part of the swim season, which led to less days where high swim risk criteria was reached (i.e. waves 3 to 5 feet). Additionally, many of the days with current-conducive conditions featured poor swimming weather, such as colder air temperatures and rain showers.
2014 Current Incident Database Summary
During the 2014 swim season there were 6 fatalities and 12 rescues related to currents on the Great Lakes, which is below the 13 year average of around 11 fatalities and 25 rescues per year (Fig. 4). Lake Erie and Lake Michigan saw more than half of the incidents (Fig. 5).
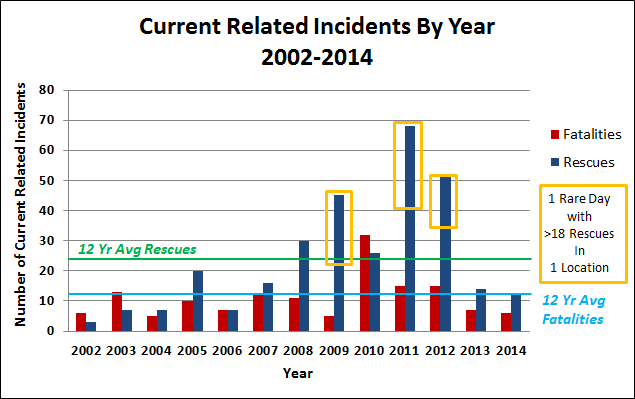
Fig. 4. A graph of current related incidents from 2002-2014. The years of 2009, 2011, and 2012 were years where there was one day with greater than 18 rescues, which are marked by orange boxes in this graph. The swim season of 2014 had below average current related fatalities and rescues (2002-2013 average). Averages are marked by the light blue and dark green lines. GLCID, 2014.
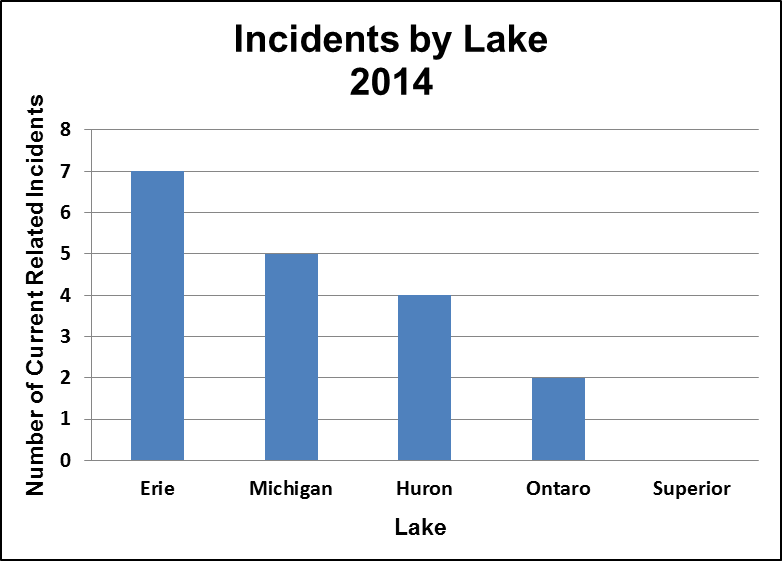
Fig. 5. Current Related Incidents by Lake in 2014. GLCID, 2014.
Approximately 39 percent of the current related incidents in 2014 occurred near river mouths, which is unusual when compared to past years (Fig. 6). The cooler air and water temperatures may have driven beachgoers to swim near river mouths and other outlets, where the water is much warmer.
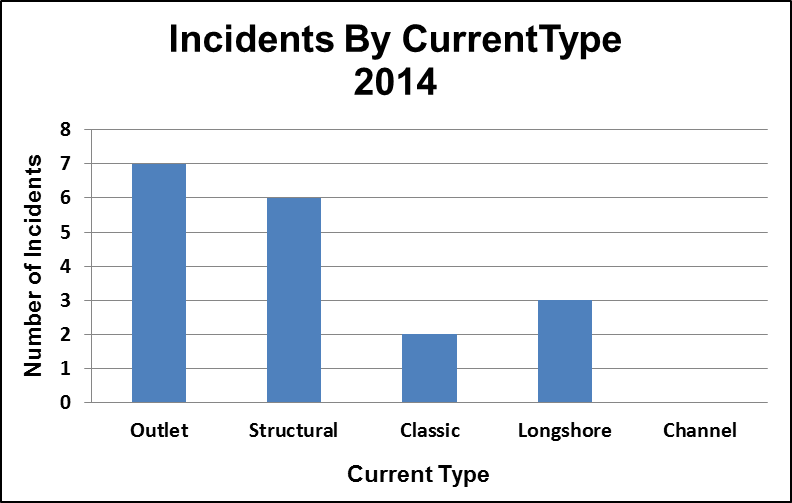
Figure 6. Current related incidents on the Great Lakes by current type. For a description of each current type, visit Dangerouscurrents.org. GLCID, 2014.
Conditions Present During Current Related Incidents in 2014
Waves
Most of the incidents on the Great Lakes occur when wave heights reach 3 to 5 feet (GLCID 2002-2013), however in 2014, incidents predominantly occurred under low wave height conditions (Fig. 7). During 67 percent of the incidents, waves were approaching the shoreline at a near 45 degree angle (Fig. 8), which is when the longshore current is theoretically strongest (USACE 1984). A stronger longshore current can lead to stronger structural currents near breakwalls and jetties, and it can join the outflow from a river, leading to stronger outlet currents (Shepard et al. 1941; Short 2007; Pattiaratchi et al. 2009; Leatherman 2011). Dangerous currents are most likely to occur with waves that have longer periods (Shepard et al., 1941; Leatherman 2003) because they feature longer wavelengths. A longer wavelength is associated with a larger volume of water, and a larger volume of water accumulating in the nearshore leads to the development of stronger currents. Current related incidents on the Great Lakes most often occur when wave periods are between 4 and 5 seconds (GLCID, 2002-2013). This year, however, a large number of incidents happened when wave periods were 3 seconds or less (Fig. 9). This is likely because the incidents in 2014 were primarily near shoreline structures and river outlets, which can act to “pile up” water in the nearshore and lead to a stronger current, despite lower wave heights and shorter wave periods.
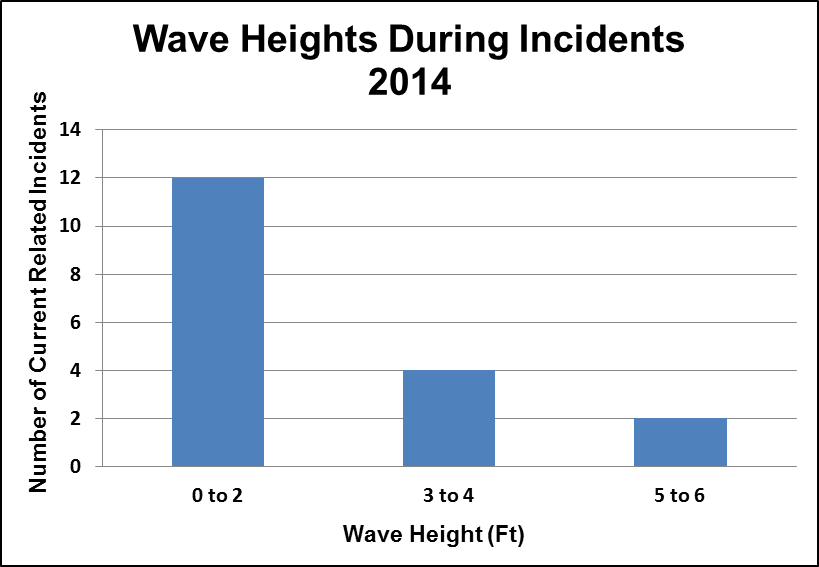
Fig. 7. Wave Heights observed during current related incidents in 2014. GLCID, 2014
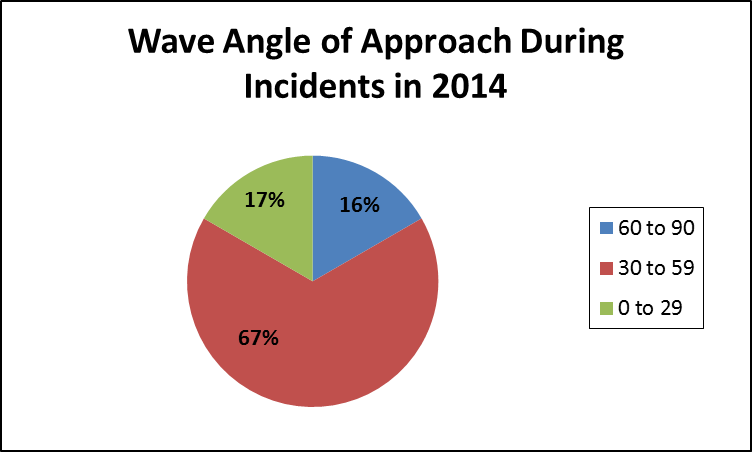
Fig. 8. Wave angle of approach relative to shore during current related incidents in 2014. GLCID, 2014.
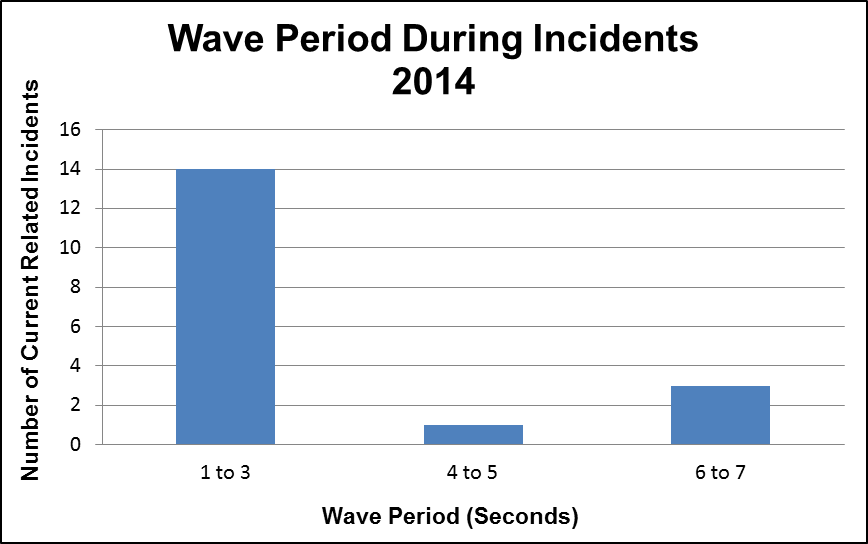
Fig. 9. Wave period observed during current related incidents in 2014. GLCID, 2014.
Winds, Temperatures, and Weather Pattern
The bulk of the incidents in 2014 happened when wind speeds were 10 to 20 mph (Fig. 10), which is characteristic of current related incidents as a whole on the Great Lakes. However, there was an uncommonly high number of incidents that occurred when winds were fairly light (less than 10 mph), likely because many happened in areas less dependent on strong winds/high waves to develop currents, such as near shoreline structures and river outlets. Nearly half of the incidents occurred when a cold front was passing through the area (Fig. 11). This is unexceptional, as cold frontal passage is the predominant synoptic pattern observed during Great Lakes current related incidents collectively.
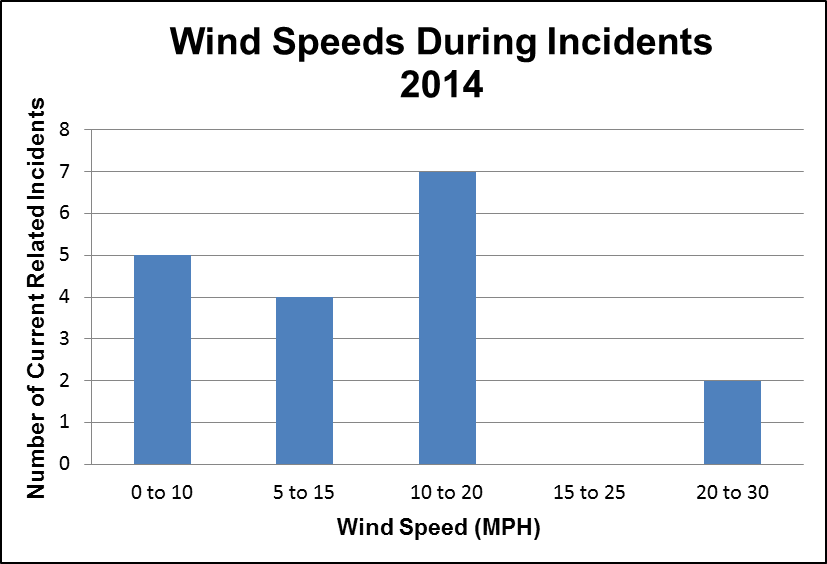
Fig. 10. Wind speeds observed during current related incidents in 2014. GLCID, 2014.
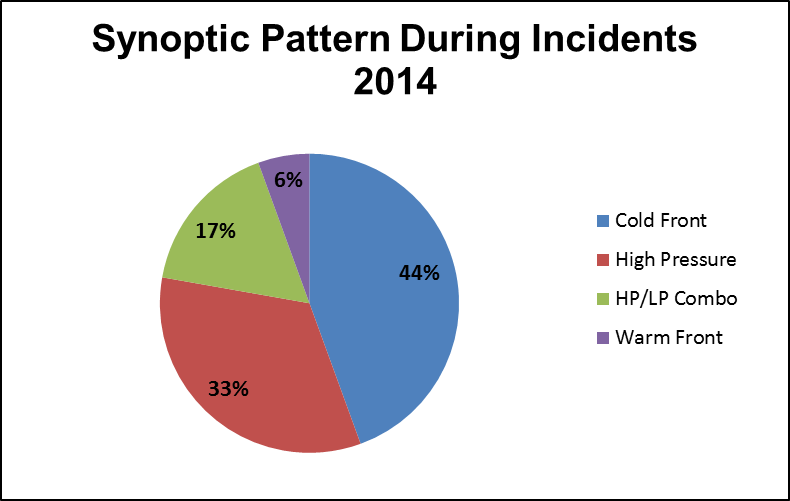
Fig. 11. Synoptic weather pattern during current related incidents on the Great Lakes. HP/LP Combo indicates that a combination of high pressure and low pressure systems were generating onshore flow at the time of the incident. For example, a high pressure system may have been exiting the area and a low pressure system moving towards the area, creating a tight pressure gradient between the two systems and over the site of the incident. GLCID, 2014.
A better part of the incidents in 2014 occurred when the air temperature was warmer than 65 degrees (Fig. 12), which is representative of incidents on the Great Lakes (GLCID 2002-2013; Dodson 2013). Temperatures this season were much cooler than normal for the region, which may explain the spike in the 66 to 70 degree range (cooler than what one would expect for swimming conditions). However, many of the incidents occurred after the passage of a cold front, so it may have actually been warmer when the victims were swimming prior to the time of the incident. Water temperatures were also cooler than normal for 2014 (Fig. 2), so water temperatures during the incidents are also slightly cooler than expected (Fig. 13). Roughly half of the 2014 incidents occurred when water temperatures were colder than 65 degrees, so hypothermia likely played a part in causing the victims to struggle. Bear in mind that water temperature observations were taken from the observation platform nearest to the site of the incident, which may have been as far away as an offshore buoy. This could have skewed the water temperatures in Fig. 13 to be cooler than what they actually were at the site of the incident, especially for those that occurred near river outlets where water can be much warmer than the open lake.
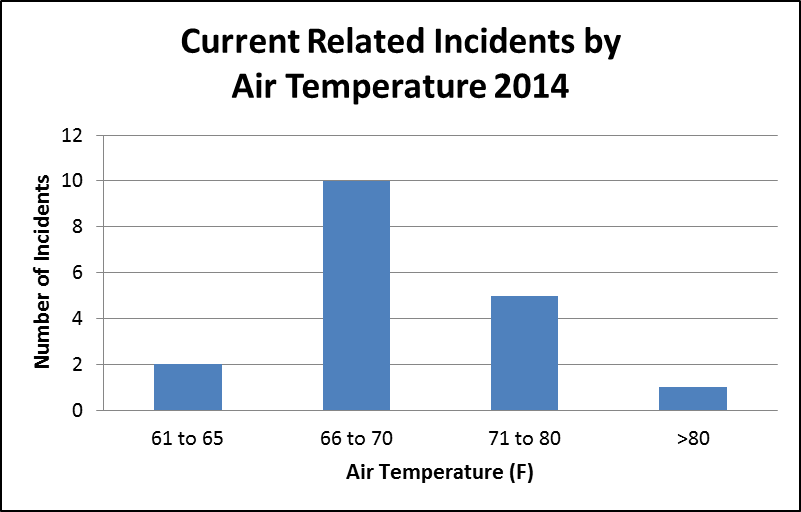
Fig. 12. Current related incidents by air temperature. Most people swim once the temperature reaches above 65 degrees. GLCID, 2014.
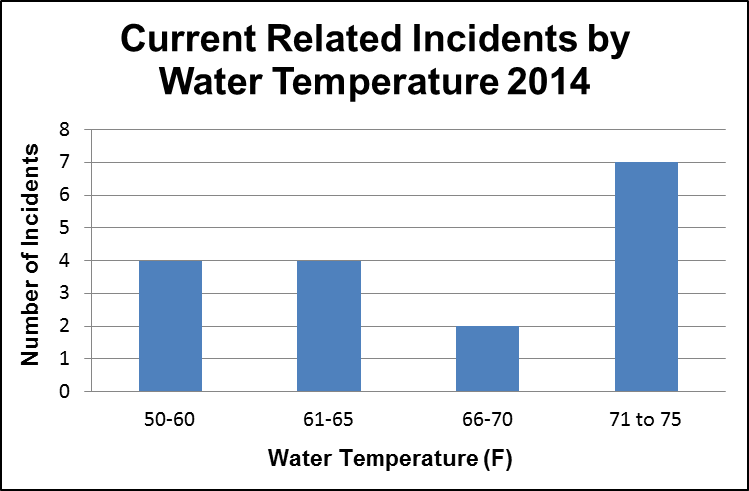
Fig. 13. Current related incidents by water temperature. Water temperatures taken from the nearest observation site, which may have been an offshore buoy (cooler than what was likely in the nearshore where the incident occurred). GLCID, 2014.
Victim Demographics
All but one of the 2014 victims were male, which is quintessential of drowning incidents across the U.S., including the Great Lakes region (Gensini and Ashley 2009; Paxton 2011; Howland et al. 1995, GLCID 2002-2013). The age of the 2014 victims ranged from 7 to 50 years, with most victims in the adolescent to young adult age groups (Fig. 14). This is not unusual, as a majority of the current incident victims on the Great Lakes are between the ages of 15 to 25 years or are parents attempting to rescue their children (GLCID 2002-2013). Hometown information was only known for 14 out of 18 incidents in 2014. Out of those, half lived within 60 miles of the beach, and half lived between 90 and 300 miles from the beach. Nearly all of the incidents occurred between noon and 8 p.m. LDT. There were three incidents that occurred around 9:30 a.m. LDT.
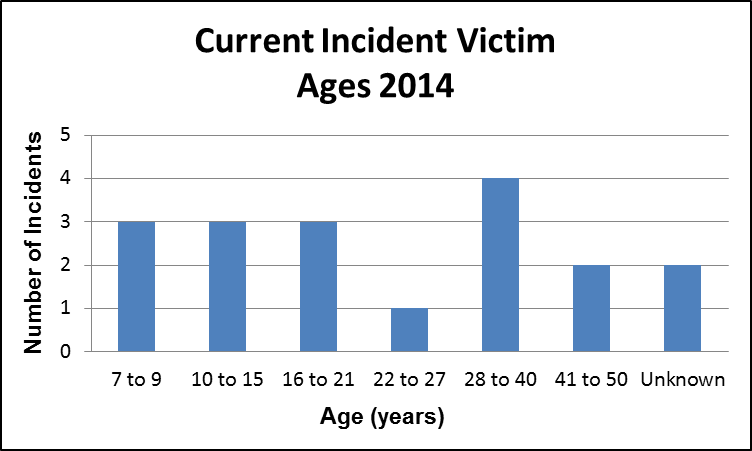
Fig. 14. Current incident victim ages from the 2014 swim season on the Great Lakes. GLCID, 2014
2014 Data Summary
Despite the cooler temperatures and lack of high-wave days, there were still a number of incidents near shoreline structures and river outlets. Swimmers should remember that dangerous currents are almost always present near these features-even during times of low waves and light winds, as was demonstrated this year. Moderate to high risk beach forecasts from the National Weather Service are focused on the conditions that will lead to especially hazardous currents, like those present during times of moderate to high waves and longer wave periods. A best practice is to swim near a lifeguard, and avoid the hazardous current-prone locations of breakwalls, piers, and river outlets.
Click HERE to see details on individual incidents from the database. If you know of or were involved in a current-related incident that is not in the database, fill out our incident submission form.
For references, click HERE.
Overview
The number of current related rescues and drowning fatalities for summer 2013 fell below the Great Lakes average of 11 fatalities and 25 rescues per year (2002-2014 avg), with 7 fatalities and 14 rescues at least partially attributed to dangerous currents. Cool summer air temperatures and below average water temperatures likely kept most swimmers from venturing too far into the water, especially on high-swim risk days with northerly winds (waves are bigger and currents are stronger, yet temperatures are often cooler).
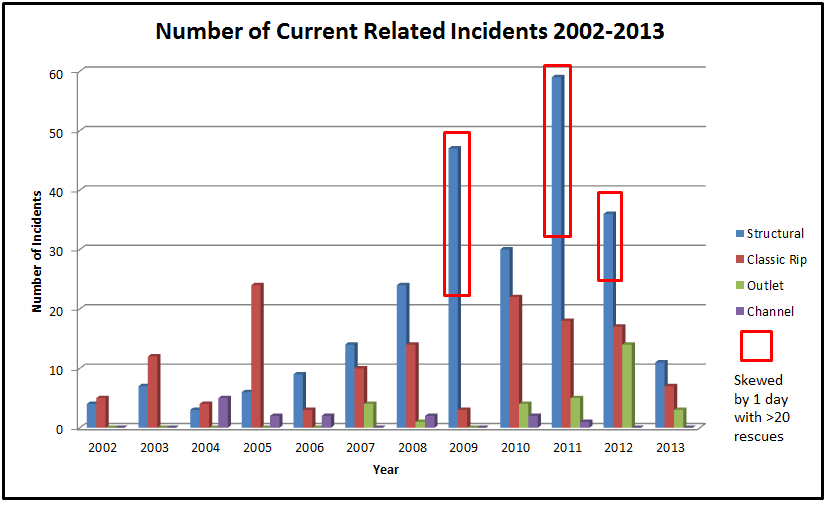
Fig. 1. Number of current related incidents 2002-2013. The years highlighted in red boxes each had 1 day where over 20 people were rescued. This skews the data, making it seem like the number of incidents is increasing with each year. General reporting of the incidents increased after 2005, when the NWS launched the rip current outreach campaign. Data also varies widely from year to year because the number of current related incidents depends on tourism, air and water temperatures, the number of moderate-high risk days, and even the number of cloudy vs sunny days. (GLCID, 2013).
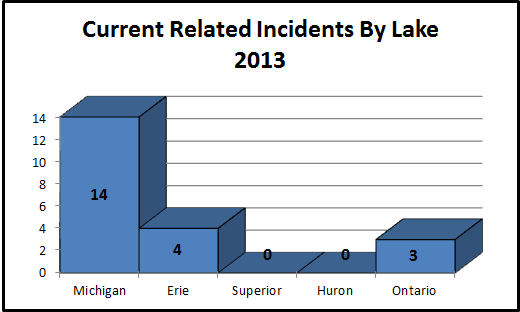
Fig. 2. A majority of current related incidents occured on Lake Michigan in 2013 (GLCID, 2013)
Current related incidents on the Great Lakes most often occur from late July into early August, as water temperatures, air temperatures, and tourism are at their peak. On Lake Michigan, where most current related incidents on the Great Lakes occur (Fig. 2), water temperatures were several degrees below normal for this time frame (Fig. 3).
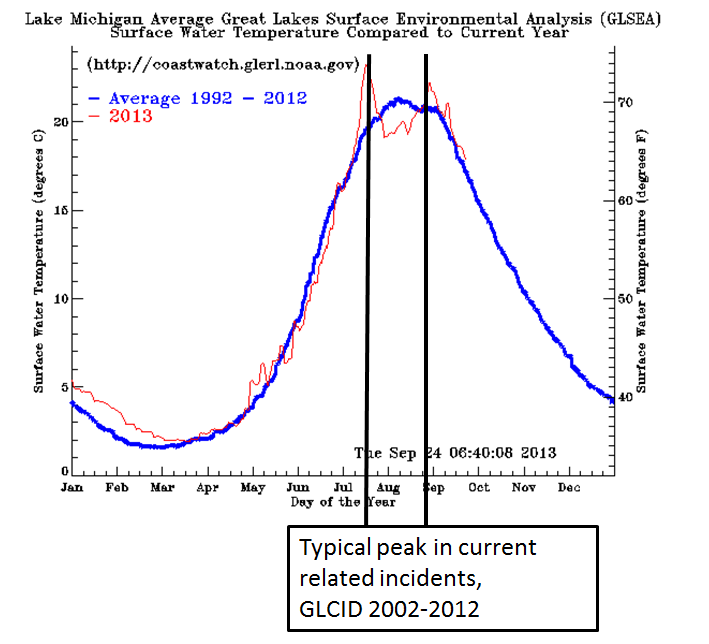
Fig. 3. 2013 Lake Michigan Water Temperatures vs. 1992-2012 normal (GLERL, 2013).
Additionally, air temperatures for July-August were below normal for the Great Lakes. In southwestern Lower Michigan, where a majority of the current related incidents occur, 2013 was the coldest summer since 2009 (See the NWS Grand Rapids Summer Climate Summary). This can be seen in the data as well (Fig. 1), with drowning fatalities and rescues at lows during those two years (with the exception of one high-rescue day in August 2009, which increases the number of rescues by 23).
Type of Current
As is typical, a majority of the 2013 incidents on the Great Lakes were related to structural currents. These dangerous currents form near shoreline structures like piers, breakwalls, and peninsulas. For more information on the different types of currents on the Great Lakes, visit this webpage.
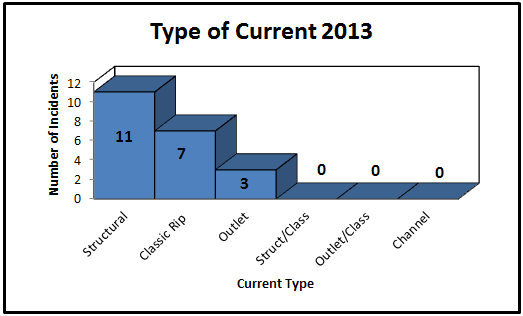
Fig. 4. All incidents in the GLCID were classified as either structural, classic rip , outlet, or channel currents. Incidents where it was not known where the victim was swimming at the time of the incident were classified as a combination (e.g. structural/classic would be a beach with a shoreline structure and properties of an intermediate beach type/sandbars). (GLCID, 2013).
Weather and Wave Conditions Observed During Current Related Incidents
Wave Heights
Dangerous currents typically develop once waves reach 3-5 feet, except near shoreline structures or river mouths, where currents can be present at any time. In 2013, all but one incident occurred during wave heights of 3 feet or greater. The one incident where wave heights were less than 2 feet occurred near a shoreline structure. The National Weather Service had a high swim risk in effect with a Beach Hazards Statement during all of the 2013 incidents where applicable (some Great Lakes office's do not issue these products).

Fig. 5. Wave heights observed during current related incidents in 2013 (GLCID, 2013).
Wave Direction
Generally, classic rip currents are most likely when moderate to large waves approach the shoreline at a near-normal angle (near perpendicular). Structural currents, however, are more likely when waves approach the shoreline at more oblique angles to shore (45 degree angle is best).This trend was supported by the 2002-2013 GLCID data, seen in fig. 6. A majority of the incidents on the Great Lakes are due to shoreline structures, so one would expect a majority of the incidents to occur as waves approach the shoreline at an oblique angle.
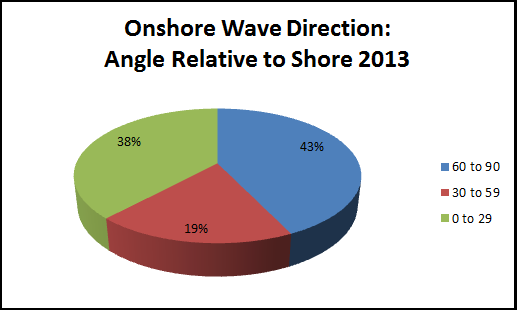
Fig. 6. A majority of the incidents in 2013 occurred when the wave direction was at a near normal angle to shore (represented by 60-90 degreess). The remainder of the incidents in 2013 occurred under more oblique wave incidence angles (0 to 59 degrees relative to shore). Data from the GLCID, 2013.
Wave Period
Wave periods (the time between each passing wave) during current related incidents on the Great Lakes typically fall between 4 and 5 seconds, which is classified as a "short period." Current-related incidents on the ocean are most often observed with longer wave periods, generally greater than 9 seconds. Short period waves add an additional hazard to swimmers, especially those caught in currents. Moderate to large waves crashing into the swimmer every 4 to 5 seconds can prevent them from completing the typical rip current-escape methods, like "flip, float, and follow" or "Swim parallel to shore." The shorter wave periods also create a more disorganized wave field, making rip currents tougher to spot on the Great Lakes (versus the ocean). In 2013, a majority of the current related incidents occurred with wave periods of 6 to 7 seconds (fig. 7).
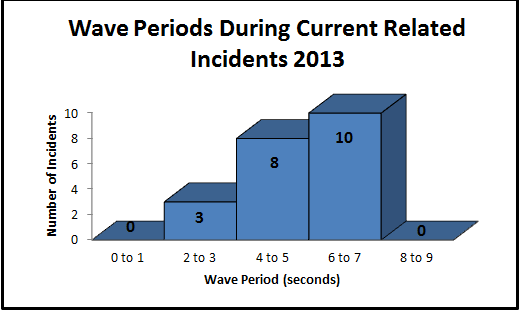
Fig. 7. Wave periods observed during current related incidents in 2013 (GLCID, 2013).
Wind Speed
Wind speed is an indirect factor in current development. Depending on the direction, strength, and longevity of the winds over the Great Lakes, moderate to high waves can be generated. When the waves approach the shoreline, they can lead to dangerous currents. Wind speeds during current related incidents in 2013 were primarily in the 10-20 mph range or greater. Only one incident in 2013 occurred with winds in the 0-10 mph category-and it was near a shoreline structure. Again, even when conditions appear benign, swimming near shoreline structures or river mouths is hazardous as currents exist with these features all the time.
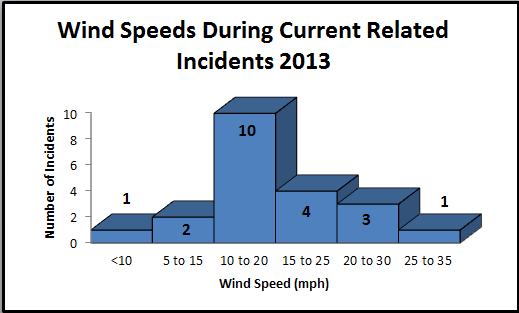
Fig. 8. Wind speeds observed during current related incidents in 2013 (GLCID, 2013).
2013 Victim Demographics
As is typical of beach fatalities on the ocean and the Great Lakes, 52% of the victims were male and 33% were female. For 14% of the incidents, the gender of the victims was not known. The average age of the victims was 22 years old (only 11/21 cases had age information), and they lived an average of 35 miles from the location of the incident (only 12/21 of the cases had hometown information).
Case Study, 2013: Factors Come Together for a High Swim Risk Day
Late July into early August is when current related incidents on the Great Lakes peak, mainly due to the combination of warm water temperatures, warm air temperatures, and the high number of vacationers. July 19th was the perfect set up for high swim risk conditions, with water temperatures on Lake Michigan in the 70s and air temperatures along the western Michigan coastline in the 80s. By mid afternoon, a cold front was situated just west of Lake Michigan, so winds over the lake were out of the south-southwest. Waves that day were 3 to 6 feet, also out of the south-southwest, with a wave period of 6 seconds. South-southwest wind/wave directions typically lead to the development of a strong longshore current on the eastern shores of Lake Michigan, which can intersect a breakwall and move lakeward as a structural current. Though structural currents are the most likely of the beach hazards on the eastern Lake Michigan shoreline during south-southwesterly winds, classic rip currents are also possible. Typically, classic rip currents form under shore-normal wave incidence (at a 60-90 degree angle from shore) but they can also form under more oblique incidence (0-59 degrees), which makes the rip current circulations more diagonal (versus moving directly outward from shore). As a result, the National Weather Service in Grand Rapids, Michigan issued a Beach Hazards Statement (around 4 am the 19th), citing that waves would be high, structural currents would form on the south sides of breakwalls, and classic rip currents were possible. Overall, the swim risk was high, and people were encouraged to steer clear from the lake.
Fig. 9. Surface map from the Weather Prediction Center at 2:00 PM EDT on July 19, 2013, just prior to the first set of incidents. The times surrounding the passage of a cold front are responsible for a majority of current related incidents on the Great Lakes (GLCID, 2013).
Around 3 pm EDT, six people had to be rescued from classic rip currents off Stearns State Park, near Ludington, Michigan (Fig. 9). Surfers at the beach made several observations of rip currents that afternoon. They reported that the rip currents were developing after larger sets of waves, moving offshore at an angle, primarily towards the northwest. They also reported a strong longshore current. After two hours of prime surf time, they heard the cry of struggling swimmers within the swimming area at Stearns Park. Luckily, despite the strong currents and waves, they were able to rescue them.
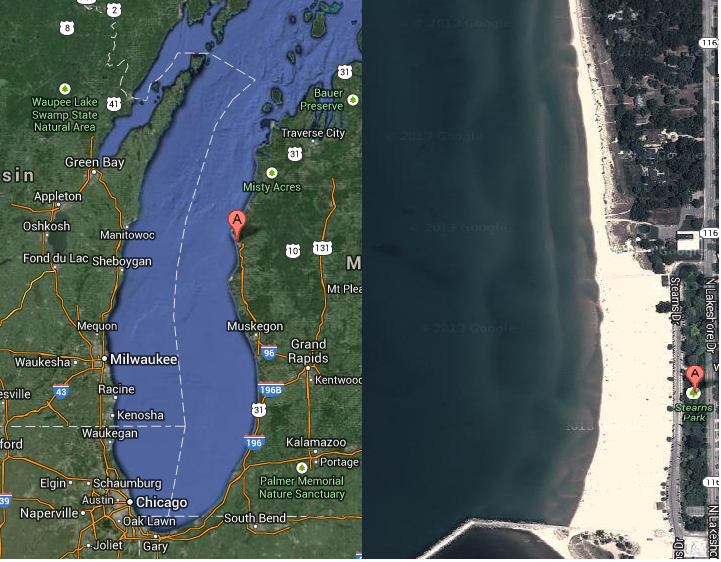
Fig. 10. Stearns State Park, Mason County, MI. Images from Google, 2013. Note the complex sandbars, the darker areas representing old rip current channels. The swimmers were rescued at the northern end of the designated swim area (away from the breakwall to the south).
Later that evening, around 7:30 PM EDT two additional incidents occurred. Two sisters were swimming near the south side of the breakwall at Pere Marquette Park in Muskegon, Michigan when they were caught in a structural current. The younger sister recounted, "we weren't too far from shore when the current began to pull us out further into the lake. We both began to struggle and began grabbing onto each other before being separated." The young girl then told authorities that she lost sight of her sister as she struggled in the waves. Luckily, the younger sister was rescued by a 20 year old woman. Unfortunately, her sister wasn't recovered until the 21st of July.
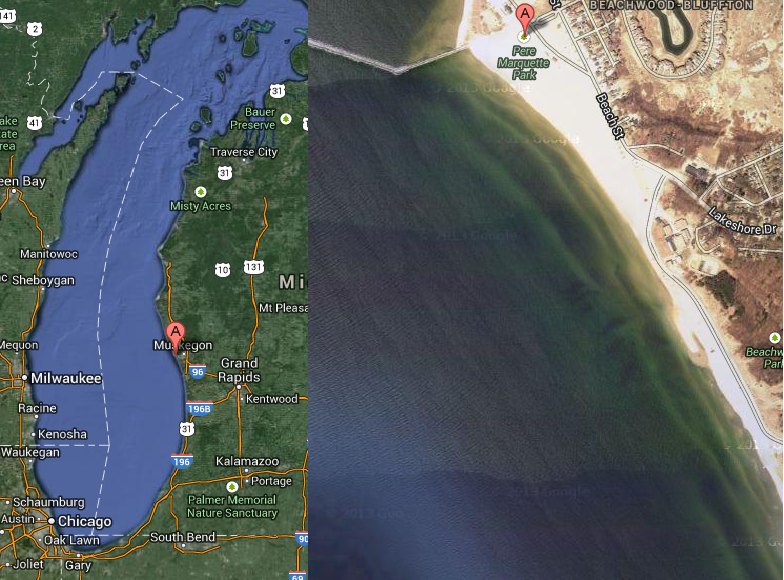
Fig.11. Pere Marquette Park, Muskegon Michigan. Images from Google, 2013. The victims in this case were swimming on the south side of the breakwall when they were caught in a structural current.
Concluding Remarks
This data was collected by the National Weather Service in Marquette, Michigan. All incidents in the database were at least partially due to a dangerous current. Many of the incidents are likely a combination of currents and high, short period waves. All readers are encouraged to read about how the data is collected here. These numbers must be viewed relative to the number of people that visit these beaches each year, which is on the order of millions.
Click HERE to see details on individual incidents from the database. If you know of or were involved in a current-related incident that is not in the database, fill out our incident submission form.
For references, click HERE.
Overview
This year was slightly above average for Great Lakes current-related incidents when compared to the average of 11 current related fatalities per year (2002-2014, Great Lakes Current Incident Database). As is often the case, Lake Michigan was responsible for a majority of the incidents, with its eastern shores favorably aligned to the prevailing wind flow and its popularity with tourists. In the Great Lakes, channel current incidents occur on average once per year. This year, there were no channel current incidents reported.
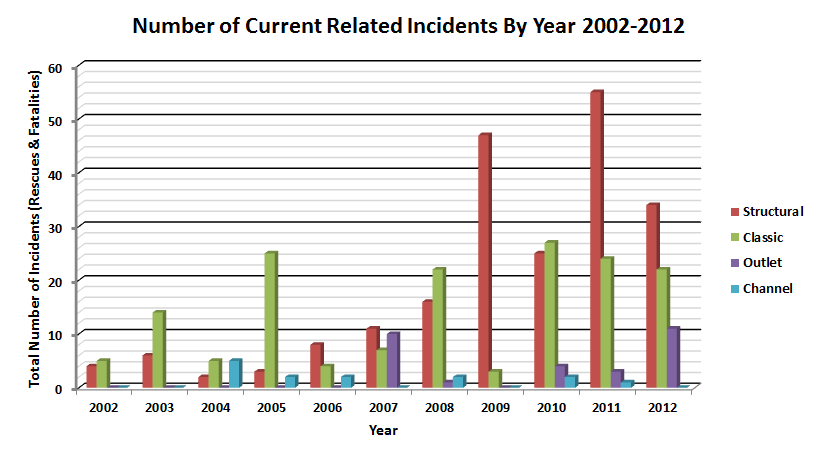
Fig. 1. Current-related incidents across the Great Lakes, 2002-2012. Data from the GLCID, 2012.
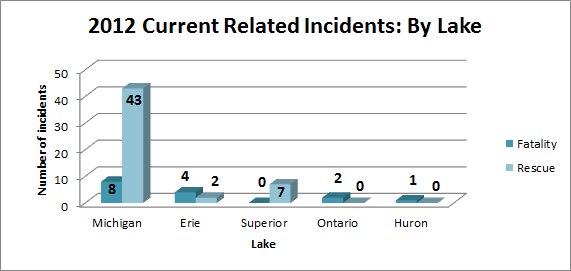
Fig. 2. 2012 current related incidents, sorted by lake. Data is from the GLCID, 2012.
About The Victims
As is typical of current-related incidents on the ocean (and of the Great Lakes), most of the victims were male. Out of the 67 total incidents in the database for 2012, 25 of them were male and 19 were female. For 23 of the incidents, the gender of the victim was unknown. The average age of the victims this year was 22 years old, which is also common in current related incidents. Approximately 60% of the victims this year were locals to the beach at which they drowned or were rescued at. In the GLCID, local is defined as living within 30 miles of the beach.
Conditions Observed During 2012 Current-Related Incidents
Wind Speeds
The most commonly observed wind speed classification during the 2012 incidents was 20 to 30 mph. Strong southerly winds commonly lead to beach problems, as they typically bring warmer temperatures and pleasant weather in combination with moderate to high waves. In addition, a large number of beaches on Lake Michigan's eastern coast have break walls that extend east to west into the lake.
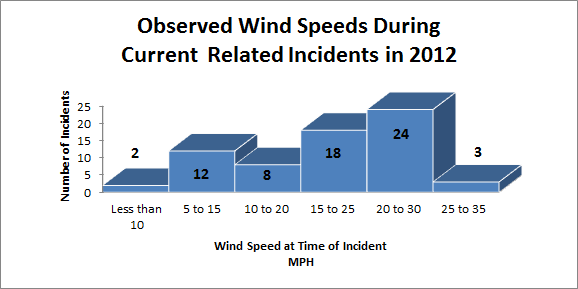
Fig. 3. Wind speeds observed during the current related incidents of 2012. Most incidents occurred when winds were in the 20 to 30 mph range. Data from the GLCID, 2012.
Wave Heights
On the ocean and in the Great Lakes, higher waves lead to dangerous current development. This can also been seen in the 2012 GLCID wave data. Most incidents this year occurred when waves were in the 4 to 7 ft. range. There were 9 incidents that occurred when waves were 2 feet or less, and 7 of those incidents were outlet currents.
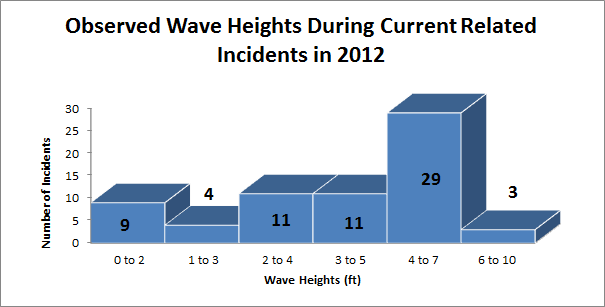
Fig. 4. Wave heights observed during current-related incidents are shown above. A majority of the incidents occurred when wave heights were greater than 2 feet. Data from the GLCID, 2012.
Wave Periods
Most of the incidents occurred when waves had a period between 3 and 5 seconds. This is one area where rip currents on the ocean are different from rip currents on the Great Lakes. Typically, rip currents in the ocean occur during longer wave periods, which is actually defined as longer than 9 seconds. Only 3 incidents occurred when the wave period reached close to 'long period' criteria, at 6 to 8 seconds. This generally shorter wave period (mostly 3 to 5 seconds) results in an additional hazard to the rip currents-as most people cannot recover while fighting a current and these rapidly incoming high waves.
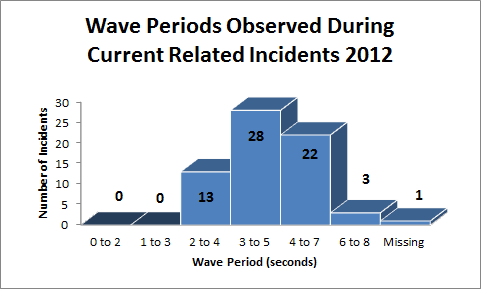
Fig. 5. Wave periods observed during current-related Incidents in 2012. Most of the incidents occurred with wave periods in the 3 to 5 second ranges. Data from the GLCID, 2012.
Most Hazardous Day of 2012:
August 5, 2012: 6 Current Related Fatalities, 7 Current Related Rescues (13 total incidents)
On this particular day, a low pressure system moving from northern Ontario into Hudson Bay brought two cold fronts across the Great Lakes. In addition, high pressure approaching from the plains extended a ridge across the region. This brought strong southerly, westerly, and northwesterly winds of 15 to 25 mph to the Great Lakes region throughout the day. These winds generated wave heights of 3 to 7 feet. NWS offices around the Great Lakes know this pattern is hazardous for beachgoers, so areas along the shoreline had a moderate to high risk of dangerous currents and waves in effect, and general statements about the hazards associated with high surf.
Archived Surface Analysis
Fig. 6. Weather Map at 2:00 PM EDT from the Weather Prediction Center on August 5, 2012.
By the end of the day, there was a total of 13 current-related incidents. There were two incidents that occurred on Lake Ontario around 8:30 am at a beach where there was a breakwall and complex sandbar features. It is unknown whether the victims were swimming at the breakwall or not, however the wind/wave direction was directly onshore (out of the south, ahead of the front).
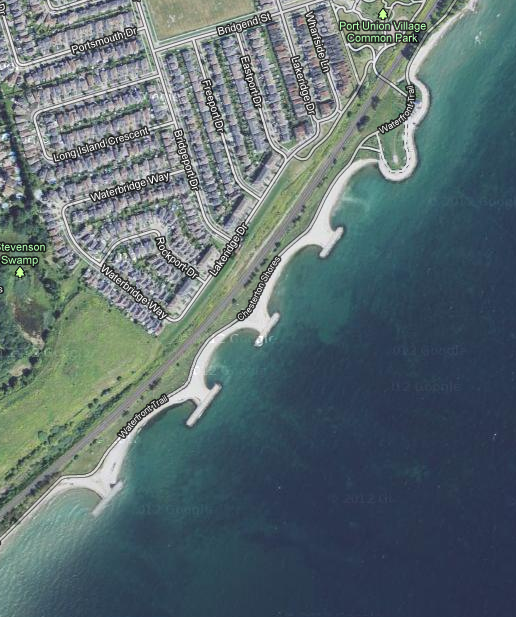
Fig. 7. Beach where the two men drowned from a current in Scarborough, Canada on Lake Ontario.
Image from Googlemaps, 2012.
Later that morning and into the early afternoon time frame, winds on southern Lake Michigan were out of the northwest at 15 to 25 mph, with waves in the 4 to 7 ft range. This set the stage for two current-related drownings and two rescues along the southeastern shores of the Lake, when a man noticed two children in distress from the current and jumped in to rescue them. The children survived, but the man did not. For this particular instance, it was not known whether the victims were caught in the river outlet at the beach or a rip current that developed within the sandbars.
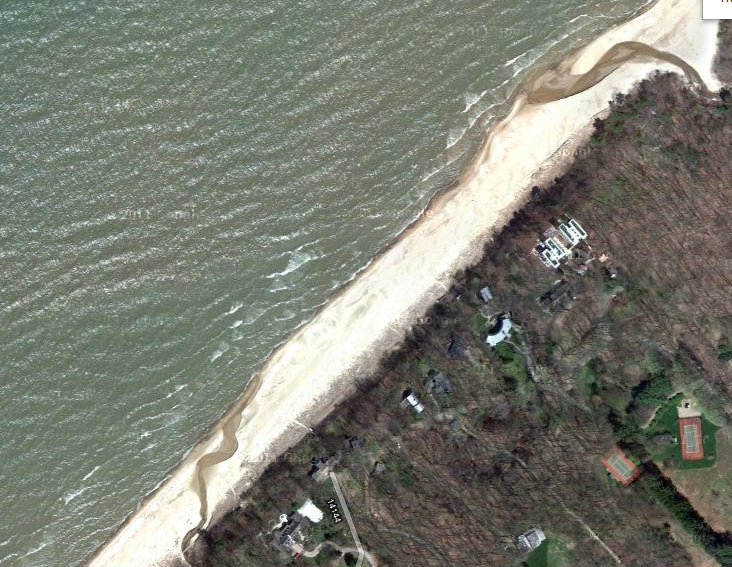
Fig. 8. Cherry Beach, in Chickaming Twp, Berrien County, MI. It was not known whether the victims were caught in the outlet current near the river mouth or a rip current associated within the sandbars. Googlemaps, 2012.
During that same afternoon, a little bit farther down the beach, another man drowned at Tiscornia Beach near St. Joseph, MI. It was not said if the man was swimming near the breakwall at the beach, however he was caught in a current and began to struggle. Two people tried to rescue him, however they could not due to the strong current.
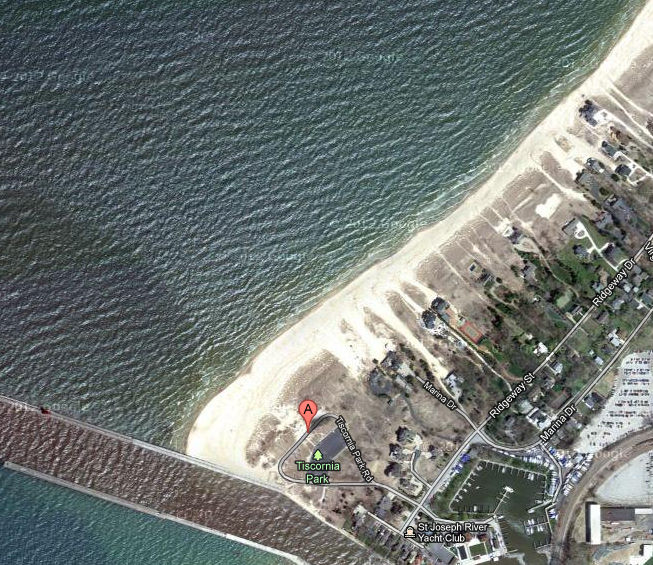
Fig. 9. Tiscornia Park, in Berrien County, MI. A man drowned when he was caught in a dangerous current in the early afternoon. Googlemaps, 2012.
Farther north on Lake Michigan, six people got into trouble with rip currents. One man drowned while trying to save his nephew from a rip current at Peterson Beach, Benzie County MI. He was swimming with 3 family members, who barely escaped the current themselves. Just prior to this incident, another woman and her granddaughter were caught in another rip current at the same beach, and nearly drowned but were rescued by several beach bystanders. Winds were westerly at approximately 10 to 20 mph, with waves in the 3 to 5 ft range. These onshore winds and waves led to the perfect set up for classic rip currents. Old rip current channels can be seen at this beach in the Googlemaps satellite image below.
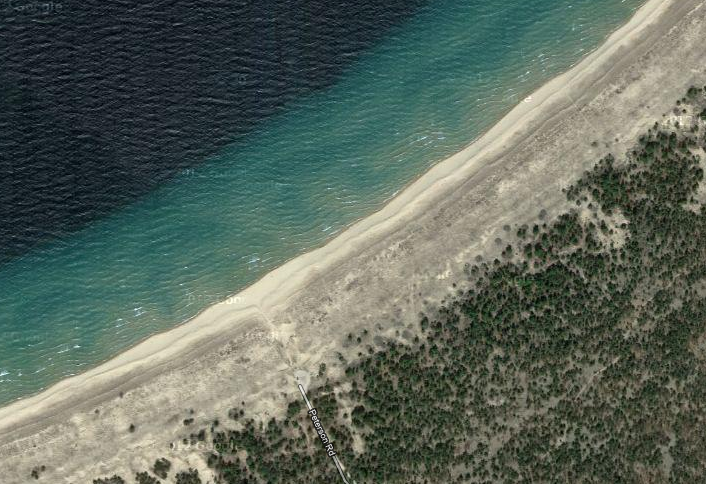
Fig. 10. Peterson Beach in Benzie, County MI. Darker areas on the image show old rip current channels. This was the site of 6 rip current incidents this summer.
Googlemaps, 2012.
Lastly, another man drowned on Lake Erie at Long Point Provincial Park, Ontario Canada. The 43 year old man was swimming in the park with his two children around 4 pm when he began to struggle in the water. Two witnesses jumped in to help but reported that the rip current was too strong, and they could not reach him.
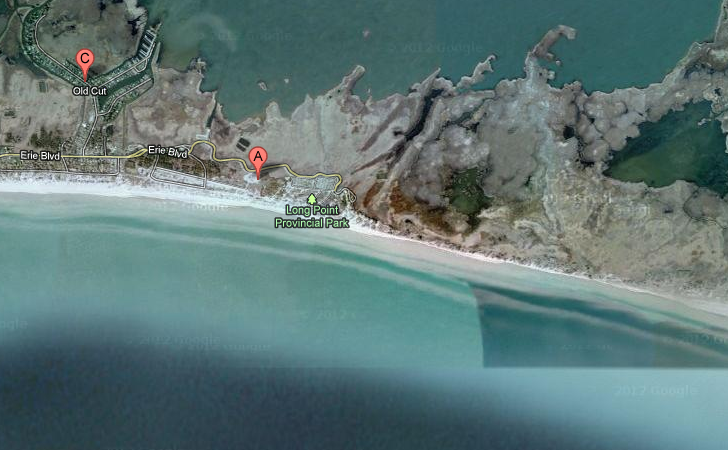
Fig. 11. Notice the sandbars running parallel to the shore at Long Point Provincial Park, Ontario. This helps to trap water near the shore, leading to rip current development during times of moderate to high surf. Image from Googlemaps, 2012.
Conclusion
In summary, 2012 was a slightly above average year for current-related incidents on the Great Lakes. Remember to pay attention to beach signs and forecasts before going out to enjoy the Great Lakes next summer.
Click HERE to see details on individual incidents from the database. If you know of or were involved in a current-related incident that is not in the database, fill out our incident submission form.
For references, click HERE.
Overview
The number of current related incidents on the Great Lakes this swim season was above the average of 11 fatalities per year (GLCID, 2002-2014). This year there 15 drowning fatalities, with a majority of them on Lake Michigan. In addition, the Great Lakes saw at least 68 rescues. This is higher than any year (even last year), though it is likely a function of increased media attention and coverage of current related incidents.
Current related incidents from 2002-2011.
As is typical, Lake Michigan had the majority of the incidents, with 60 reported rescues and 10 drowning fatalities related to dangerous currents. There were more incidents in Lake Ontario than is typical, likely due to increased media attention to dangerous currents. Incidents in the past were likely underreported, with only 1 drowning and 1 rescue attributed to dangerous currents in the database prior to this year. This year there were 3 deaths and 1 rescue.
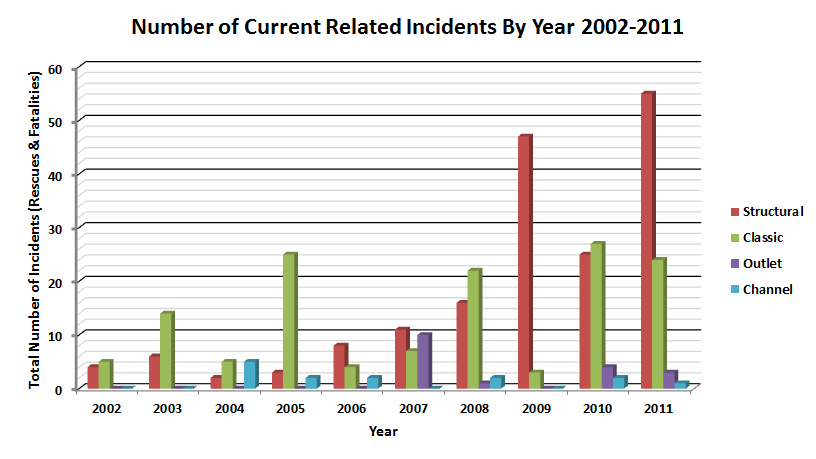
Fig. 1. Number of current related incidents by Lake 2002-2011. Lake Michigan had the highest number of
drowning deaths and rescues due to dangerous currents. GLCID, 2011.
Dangerous currents occur near shoreline structures, river mouths, and within sandbars-especially during high waves. Figure 2 below shows beaches where some of this years incidents occurred.
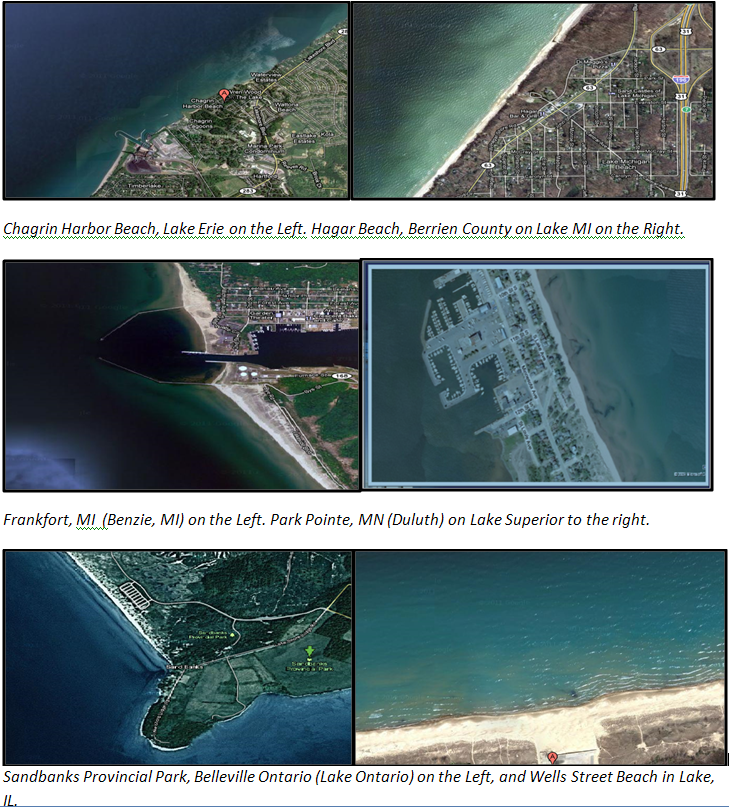
Fig. 2. Beaches where some of this summer's incidents occurred.
Images from Googlemaps.com.
Conditions Observed During and Prior To Current-Related Incidents
Wave heights
Most of the incidents took place under moderate to high wave events (i.e higher than 3 feet). From 2002-2010, most of the incidents occurred when waves ranged from 2 to 4 feet. This year, it seemed most incidents were in the 1 to 3 feet and 4 to 7 feet ranges. This is because a majority of the incidents this year occurred near shoreline structures. Structural currents can occur with smaller wave heights, like the 1 to 3 feet range. Only four incidents had waves in the calm to 2 feet range, and two of them were associated with breakwalls.
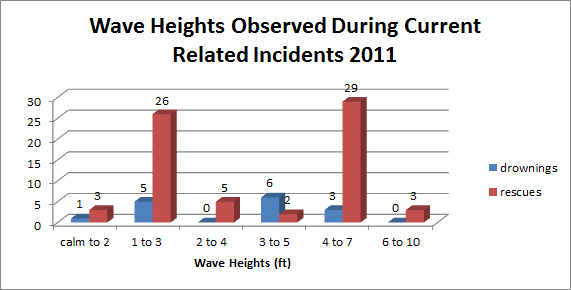
Fig. 3. The graph above shows the wave heights during each death/rescue incident. Most of the incidents
occurred under the 4 to7 ft range and the 1 to 3 ft range. GLCID 2011.
In contrast to previous years, current related incidents often occurred as wave heights were increasing (i.e they had lower wave heights up to 12 hours prior to the incident). Most of the current-related incidents in the past occurred as wave heights were decreasing or when wave heights were relatively steady through the day.
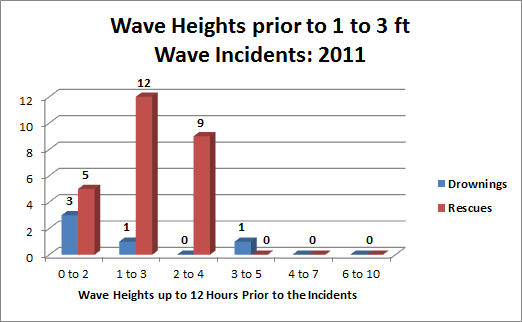
Fig. 4. Most wave heights prior to 1 to 3 feet range incidents were still in the 1 to 3 feet height range
before the incident. Data from the GLCID, 2011.
Wind Speeds
Observed wind speeds from the time of the incident most often ranged from 15 to 25 mph. The secondary spike in the 5 to 15 miles per hour range was a result of the large number of structural current incidents.
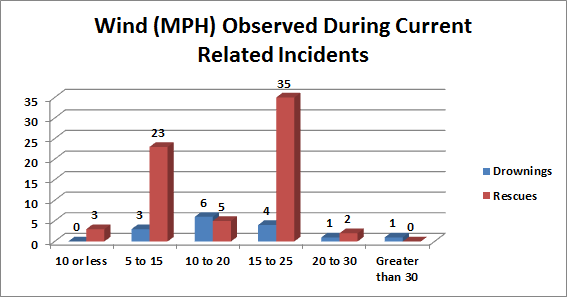
Fig. 5. Observed winds at the time of the incidents.GLCID, 2011
Victim Demographics
Gender
As is typical in drowning rescue and fatality data across the globe, 83% of the victims involved in the incidents were male (17% were female, and for 33% the gender was unknown). The average age of the victims was 22 years old, which is also typical of current related incidents.
Most Noteable Case from 2011
August 3, 2011: 1 Drowning Fatality and 28 Rescues Attributed to Dangerous Currents
Location: Holland, MI (Ottawa County) and Pentwater, MI (Oceana County).
On this day, over 30 rescues were made by the Coast Guard located in Ottawa, MI. Out of the 30 total rescues at Holland State Park, 28 were related to structural currents. The other two were related to personal watercraft. Another girl in Pentwater, MI (north of Holland) drowned when she was swept out into the lake by a structural current near the breakwall.
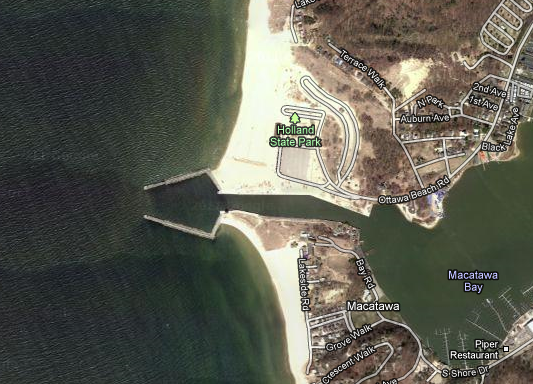
Fig. 6. Holland State Park (Ottawa, MI). Structural current was on the north side of the pier. Image from Google Maps (2011).
The night before, a cold front had swept across Lake Michigan, and high pressure was moving in from the west. As a result, winds were 15 to 25 miles per hour out of the northwest. Knowing this to be a typical set up for strong current development, the National Weather Service in Grand Rapids, MI had a high swim risk posted on their web page. The beaches were crowded, with mostly sunny skies and temperatures in the upper seventies and low eighties. At Holland State Park, the red flags were flying, warning swimmers to stay out of the water. No doubt, park officials recalled a similar day in 2009, where in a five hour period; 23 people had to be rescued near the north pier. Conditions on that day were almost the same as August 3, with winds 15 to 25 miles per hour out of the northwest and waves in the 2 to 5 feet range.
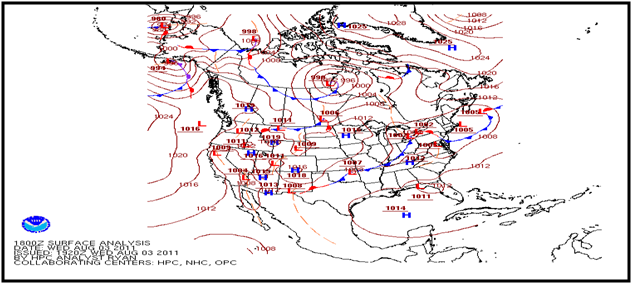
Fig. 7. Hydrologic Prediction Center (HPC) weather map from 2:00 PM EDT on August 3, 2011.
High pressure is seen to the west, and the cold front to the south east.
By 8:00 PM EDT that evening, the Department of Natural Resource staff closed the beach due to the high number of rescues. As winds were northwest, the longshore current moved parallel to the beach in a southerly direction, intersecting piers on the north sides and jetting out into the lake as a structural current. One rescued girl told NWS Marquette in an interview, "We were not swimming near the pier, but we got pulled towards it because of the current (longshore current). We were to the right [north] of Holland State Park Beach. We were just behind the buoys that mark the spot where swimming is prohibited, when we were pulled out further into the lake along the breakwall (Structural current)." When asked which was the most prohibitive to her swimming (or getting back to shore), the waves or the current, she replied, "The current was the worst. Hands down."
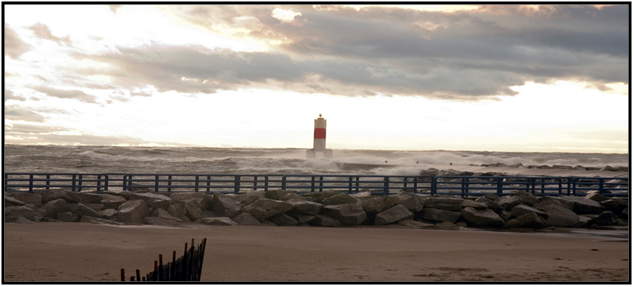
Fig. 8. Photo of the North Pier at Holland State Park, Ottawa county, MI. This photo was not taken August 3, 2011.
Photo released at: https://home.waycom.com/PhotoByDan/Default.htm.
Further north up the beach, there was another rescue. A 13 year old girl was caught up in the structural current along the northern pier near Charles Mears State Park. She went under, but a 29 year old man from Newaygo, MI was able to reach her. A few days later, the girl died at a hospital in Grand Rapids, MI. Conditions were slightly different than at Holland, with northwest winds at 10 to 20 miles per hour, though for the evening prior to the incident, the winds were 15 to 25 miles per hour. Waves ranged from 3 to 5 feet at the time of the incident (using the northern Lake Michigan Buoy). At the beach, witnesses indicated that the waves may have been more like 6 to 8 feet.
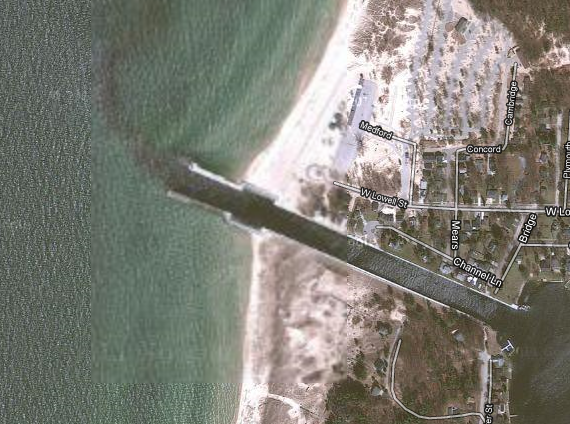
Fig. 9. Beach at Charles Mears State Park, Pentwater, MI (Oceana County). Photo from Googlemaps.com.
Channel Current Drowning Fatality
July 26, 2011: 7 year old boy drowns at Barracks Beach, Presque Isle
Location: Presque Isle (Barracks Beach) in Erie, Pennsylvania
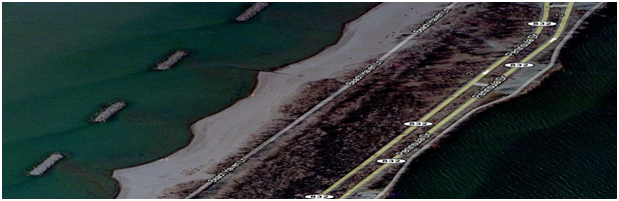
Fig. 10. Presque Isle, Erie Pennsylvania: The channel current at Barracks beach played a part in the death of a 7 yr old boy.
Image from Googlemaps.com
A 7 year old boy went ahead of his parents and into Lake Erie with his siblings for a swim around 9:00 PM EDT. A short time later, the boy could not be found. The head lifeguard (not present during the event) said what likely happened was the boy went into the water and was pushed off the sandbar. He also mentioned that once winds get above 10 miles per hour, the current in that location picks up and people usually start to struggle to stay on the sandbars. That night, winds were west at 15 to 25 miles per hour and waves were in the 1 to 3 feet range. According to the Lake Erie Buoy, the mean wave direction was out of the north, likely allowing for strong currents to move through that general beach. The lifeguard added, "If the beach had been open later, it would have been a yellow flag day. Those currents likely contributed to the death of the boy."
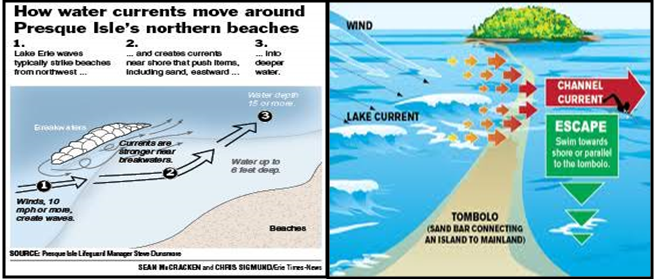
Fig. 11. The left image was taken from the Presque Isle Lifeguard Manager Steve Dunsmore, explaining how the channel currents
work in that area, which is similar to the diagram from Michigan SeaGrant (right).
Summary:
This year we had 83 incidents related to dangerous currents. 15 of the 83 incidents were fatalities. Overall, it was an above average year, though it did not compare to the 30 current related drowning deaths across the Great Lakes in 2010.
Click HERE to see details on individual incidents from the database. If you know of or were involved in a current-related incident that is not in the database, fill out our incident submission form.
For references, click HERE.
Overview
2015 was another below average year for current-related rescues and fatalities. Six fatalities and nine rescues were confirmed, for a total of fifteen incidents. Unfortunately, a variety of factors can play a role in the number of current-related incidents that occur each year.As a result, we can only speculate as to why incidents this year were below the average of 12 fatalities and 23 rescues.
This swim season was marked by average air temperatures or slightly below the mean, and near normal water temperatures on Lake Michigan. Precipitation was near or slightly above normal for the summer season in many locations along the Great Lakes shoreline. Generally, when air and water temperatures are cooler, less people venture into the water for a swim (this was likely the case in 2013, 2014). Since conditions were near average for this season, this may not have had a large impact on the number of incidents.
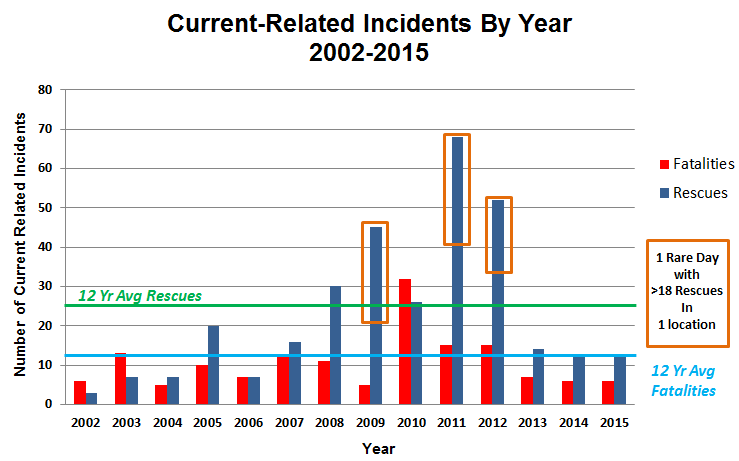
Fig. 1. Graph depicting the number of current-related incidents (rescues and fatalities) each year. The gold boxes represent single days with greater than 18 rescues in one location. These can make it look like incidents were increasing dramatically, even though they were just rare examples of 'perfect storm' conditions for dangerous currents. In recent years, incidents have been below the average, GLCID (2015).
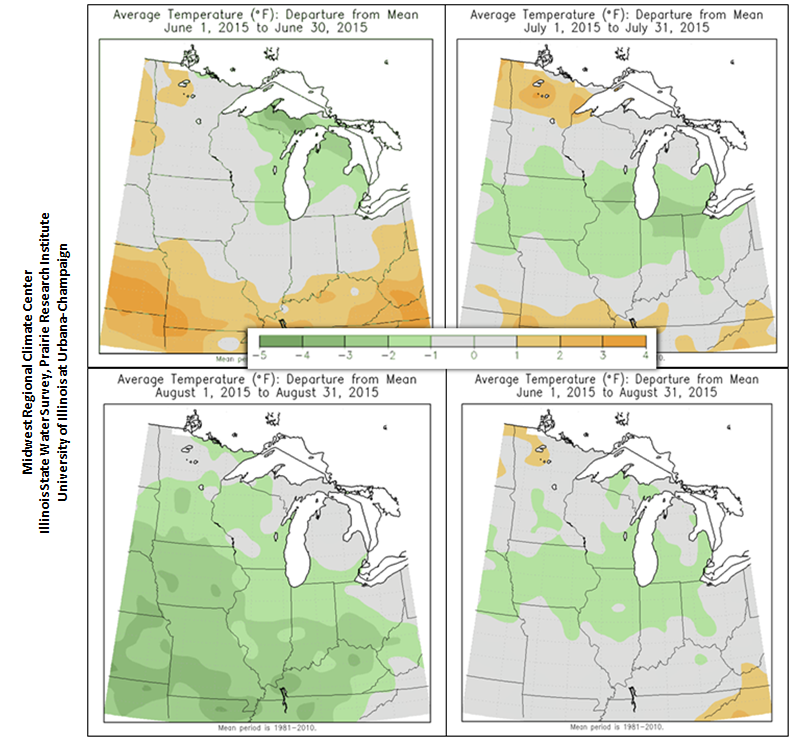
Fig. 2. Graphs from the Midwest Regional Climate Center (MRCC) showing how this summer the temperatures were slightly below the mean.
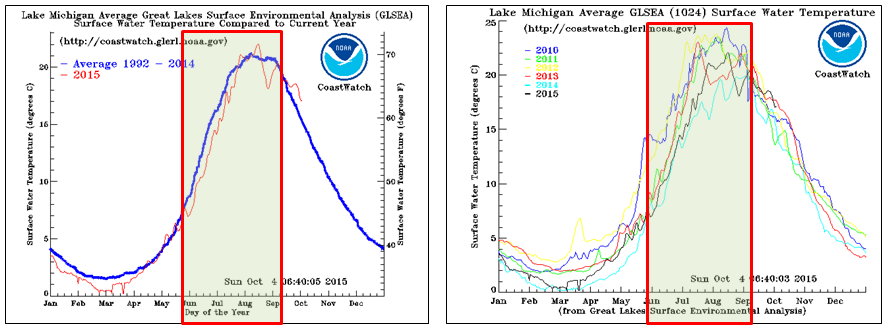
Fig. 3. Graphs of Lake Michigan average water temperatures compared to long-term averages (left) and Lake Michigan average water temperatures from 2010-2015 (right). Data from GLERL statistics page.
Increased Beach Safety
Recent improvements in beach safety practices may be a factor in the below normal number of incidents in recent years, though this is impossible to measure using the incident statistics. Since 2013, new water safety task force groups developed to address beach safety issues in local areas, and there have been several grant efforts focused on improving the availability of beach rescue equipment and Great Lakes-specific beach hazards outreach and education.
Where the Incidents Occurred
Most of the incidents occurred on Lake Michigan and Lake Erie, as is typical. This year, however, it appears classic rip currents were responsible for a majority of the incidents. This differs from previous years where most of the incidents were a result of structural currents.Conditions may have been more favorable for classic rip current development this year than in past years. It also depends on where people are swimming, so it is possible there were less people swimming near piers, breakwalls, and other shoreline structures.
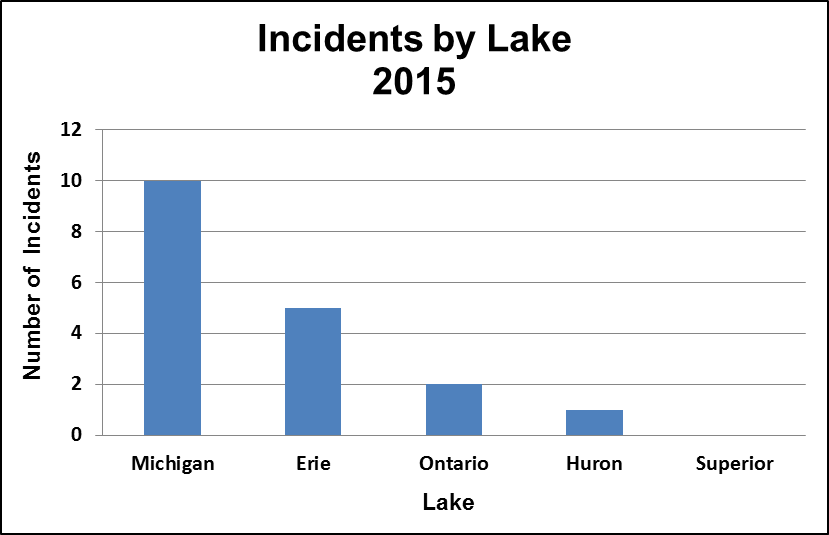
Fig. 4. Graph of Current-Related Incidents by Lake(GLCID, 2015).
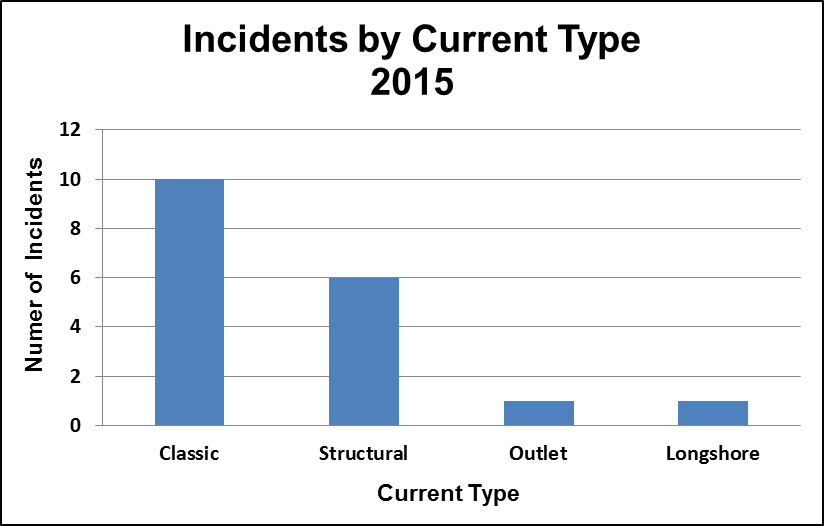
Fig. 5. Graph of Current-Related Incidents by Current Type. This year, there were more classic rip current incidents (Classic) than structural, outlet, or longshore currents (GLCID, 2015). There were no channel current incidents this year.
Weather and Wave Conditions During Current-Related Incidents
Dangerous currents develop when water 'piles up' near the beach (Shepard et al. 1941, Shepard and Inman 1950; Munk 1949). Water 'piles up' near the beach when waves are moderate to large in height, have longer periods (time in between each wave), and approach the shore at more direct (perpendicular) angles. This year, conditions during the incidents were supportive of classic rip current development. In 80% of the 2015 cases, the waves approached the shoreline at near-perpendicular (60 to 90 degree) angles. Wave heights during 73% of the cases were greater than three feet, and at times had longer wave periods of 6 to 7 seconds. A majority of incidents occurred surrounding the passage of a cold front, which is typical of current-related incidents on the Great Lakes as a whole (GLCID, 2002-2014).
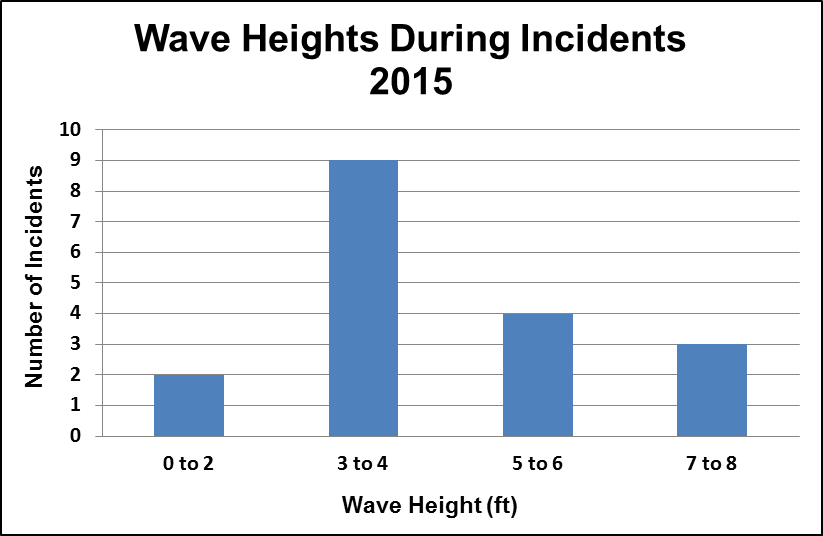
Fig. 6. Graph of wave heights during the 2015 incidents.(GLCID, 2015).
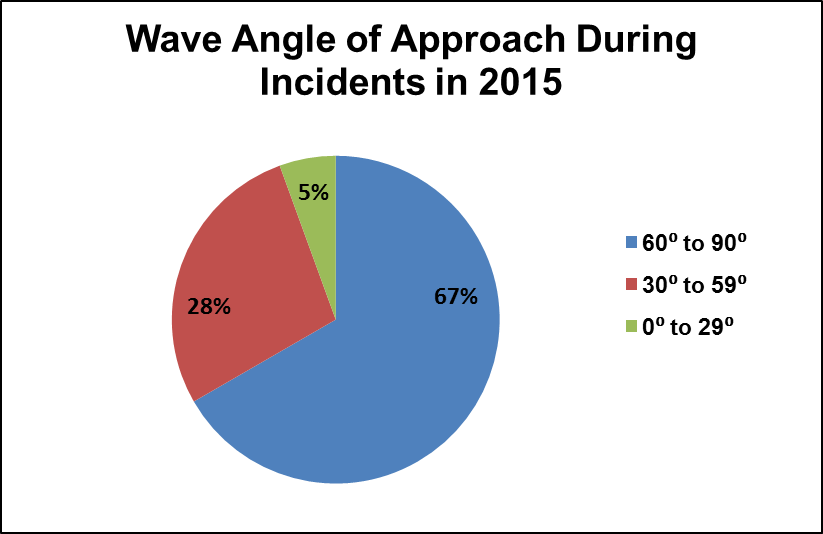
Fig. 7. Graph of the wave angles of approach relative to shore during current related incidents in 2015. Direct approaches were classified as within 30 degrees of perpendicular (or 60 to 90 degrees relative to shore). Near parallel approaches were classified as approaching the beach between 0 and 29 degrees. (GLCID, 2015).
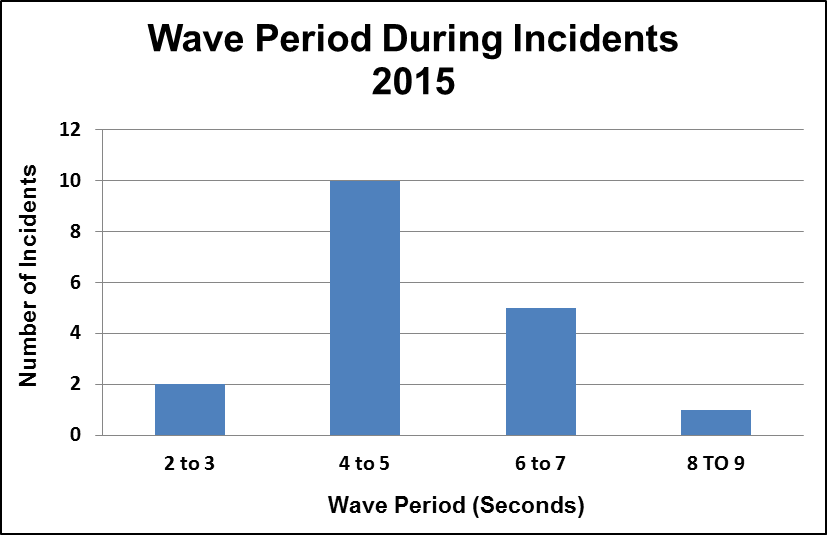
Fig. 8. Graph of Wave Periods during Current-Related Incidents. The average wave period on the Great Lakes is around 4 seconds, which is why the majority of incidents in 2015 saw wave periods in the 4 to 5 second category (GLCID, 2015).
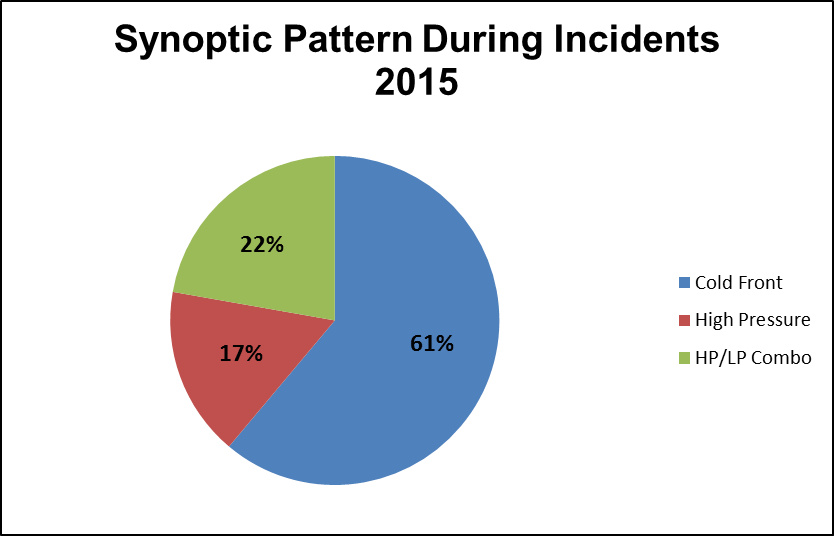
Fig. 9. Graph depicting the broader-scale (synoptic) weather pattern during current-related incidents in 2015. A majority of incidents occur surrounding the time of a cold front passage. HP/LP combination means that onshore flow was created within the gradient between high/low pressure systems, and that no real front was present nearby(GLCID, 2015).
Victim Demographics
Normally, victims involved in current-related incidents are male because they are more likely to engage in risky behavior (Houser et al. 2011; Howland et al. 1996; Baker et al., 1992; Rowan et al., 2004). From 2002-2014, 70% of the victims were male. This year was an unusual split of male and female victims. As is typical, most of these victims were adolescent or young adults between the ages of 10 and 27. All but one of the victims lived within 90 miles of the beach where the rescue or fatality occurred, which is comparable to the 2002-2014 GLCID data.
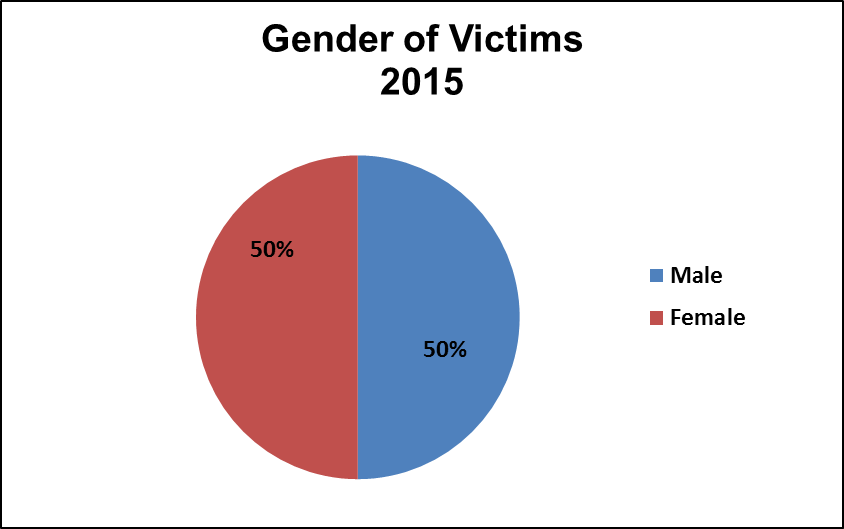
Fig. 10. Graph depicting the gender of victims involved in current-related incidents(GLCID, 2015).
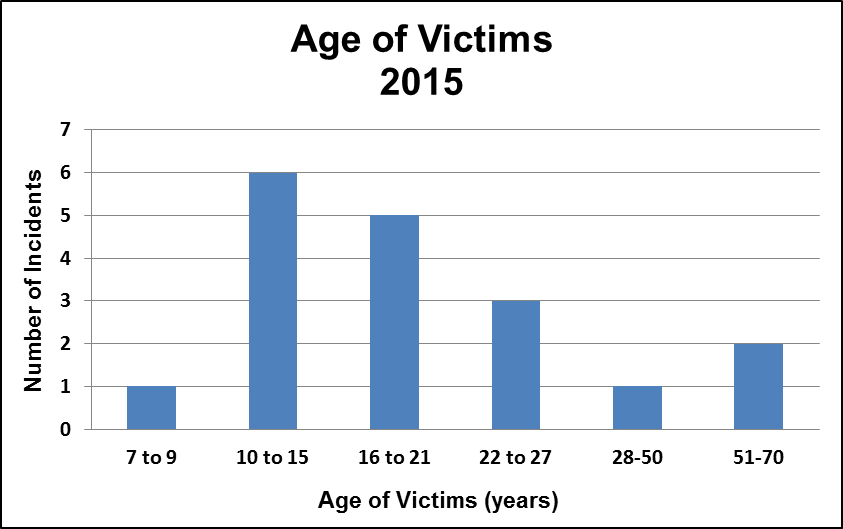
Fig. 11. Graph depicting the age of victims involved in current-related incidents(GLCID, 2015).
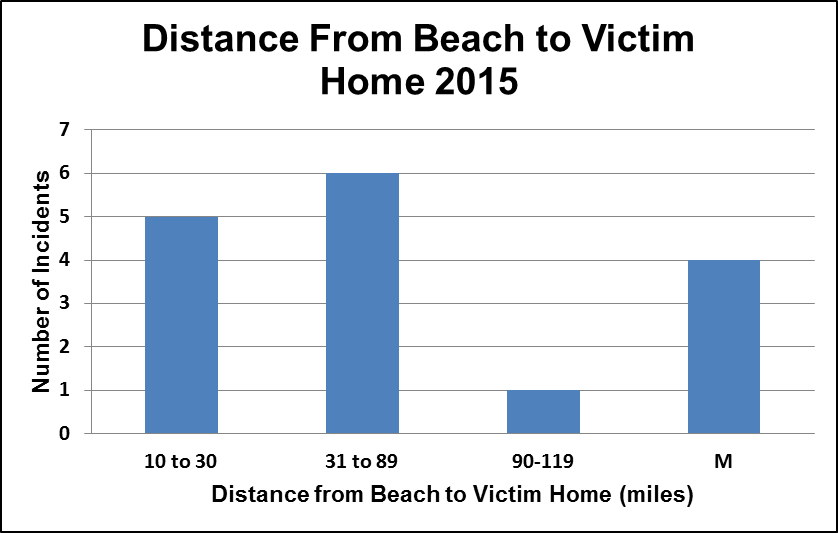
Fig. 12. Graph depicting how far each victim lived from the beach where the incident occurred. Most victims in 2015 lived within 90 miles of the beach where they drowned or were rescued at(GLCID, 2015).
Closing Thoughts
Overall, the 2015 swim season was below average in the number of current-related rescues and fatalities. This may have been because of the slightly below normal average high temperatures, slightly cooler water temperatures, near to above normal precipitation, or improvements in beach safety and education. To view the data from the Great Lakes current incident database, visit www.dangerouscurrents.org and click on "Incident Database."
Unfortunately, there were 8 rescues that occurred in Michigan where critical information, such as time and location, were unavailable. These may be added into the database at a later date if the details can be confirmed. There were also rescues that occurred in Ontario this year that have yet to be confirmed. These rescues will be added in at a later date once the details become available.
Click HERE to see details on individual incidents from the database. If you know of or were involved in a current-related incident that is not in the database, fill out our incident submission form.
For references, click HERE.
Overview
Current related rescues and fatalities were slightly above average for the 2016 swim season, with 16 fatalities and 34 rescues (two still in critical condition as of 12/22/17). The ten-year average from the Great Lakes Current Incident Database (GLCID) is 12 fatalities and 23 rescues per year (2002-2011). This is in contrast to the previous three years, where we've seen below average numbers (Fig. 1) due to cooler air and water temperatures and improved beach safety measures. Drowning fatalities due to other water safety concerns, like boating, waves, and pier washes were also higher than normal this year, according to the Great Lakes Surf Rescue Project.
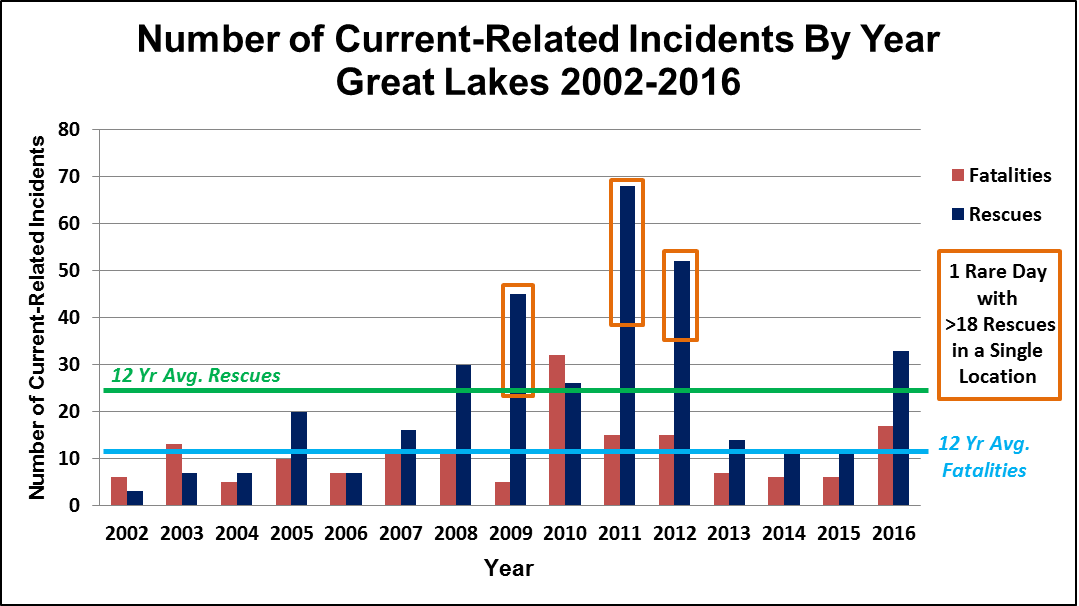
Fig. 1. Number of Current-Related Incidents by year (2002-2016). 2016 was slightly above the average of 12 fatalities and 23 rescues per year (GLCID, 2016).
Warm water and air temperatures, along with higher water levels were likely to blame for the greater than average number of current-related incidents. Higher water levels bring the potential for increased wave energy, and increased wave energy means more beach erosion and a favorable set-up for dangerous current development (Meadows et al., 1997). You can view the latest water levels Here. There are additional links to water level information in the references at the end of this summary. Warmer water and air temperatures bring swimmers to the water. Grand Haven alone saw over 2 million visitors from just May through September (Evanoff, 2016). Air temperatures across the Great Lakes averaged between 1-5°F above the mean during the summer months (June-August). August was a particularly warm month, with temperatures 3-6°F above average for several locations around the Great Lakes (Fig. 2). It was also the month where we saw a majority of current-related incidents this season (25/44 total incidents).
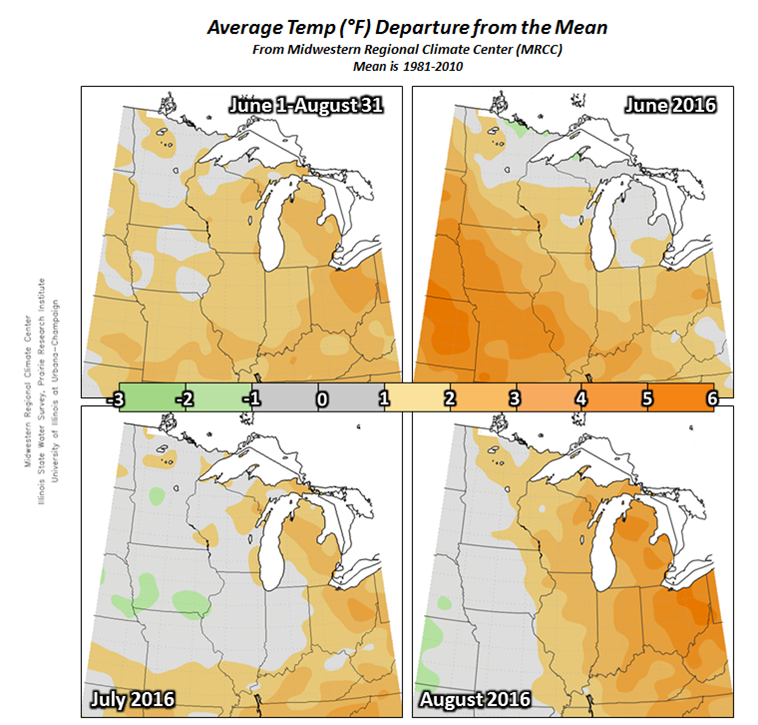
Fig. 2. Midwestern Regional Climate Center (MRCC). Average temperatures (departure from the mean) for June into August 2016 (upper left), June (upper right), July (bottom left), and August (bottom right).
Water temperatures during the 2016 swim season were well above average, especially when compared to the past three years. Lake Michigan is shown below (Fig. 3), which is where a majority of the incidents occurred this year. 2012 was the last year where water temperatures rivaled those of this year, particularly during the month of August when we traditionally have most of our incidents. 2012 was also the last time we had an above average number of current-related incidents.
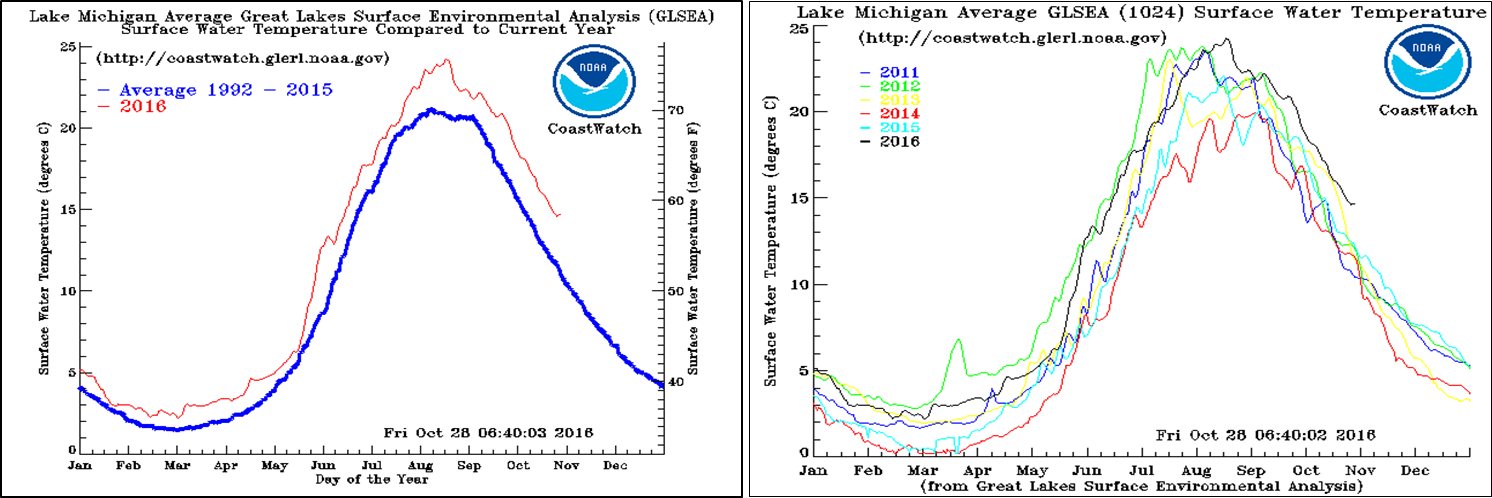
Fig. 3. Lake Michigan water temps from the Great Lakes Environmental Research Center GLSEA. Lake Michigan average water temperatures from 2016 as compared to the long term average (left) and the previous years (right).
Where Did the Incidents Occur?
An updated map of current-related incidents from 2002-2016 is shown below (Fig. 4A). A majority of current-related incidents this year occurred on Lake Michigan (which is normal), followed by Lakes Erie, Superior, and Ontario. There were no incidents reported to us from Lake Huron (Fig. 4b).
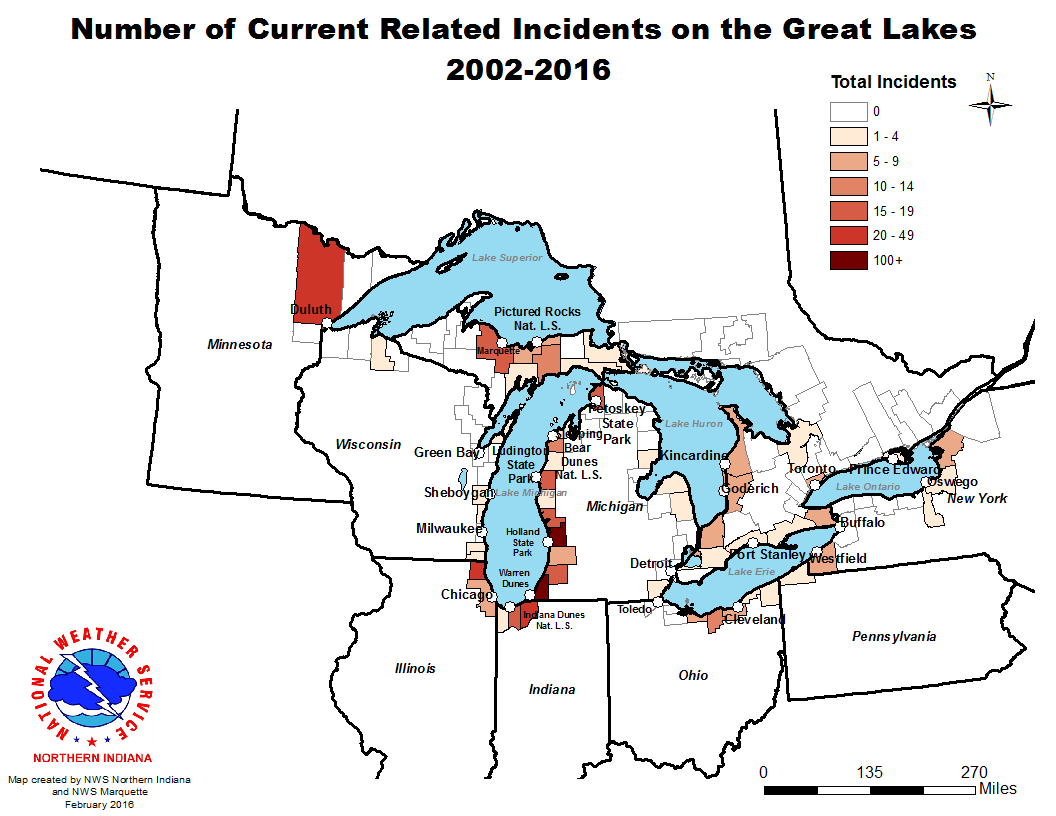
Fig. 4A. Map of Great Lakes current-related incidents (rescues and fatalities) from 2002-2016 An interactive version of this map can be found here. (GLCID, 2016).
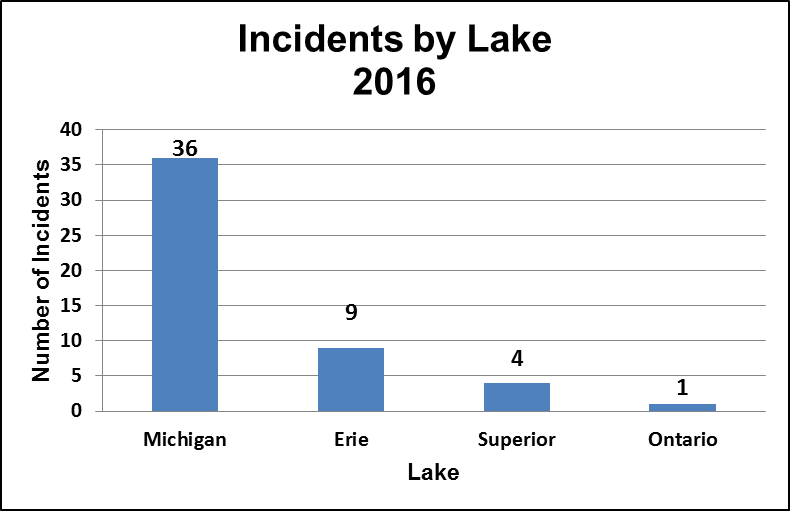
Fig. 4b. Number of current-related incidents by Lake in 2016(GLCID, 2016).
Current Type
In 2016, 46% of the incidents were related to rip currents (Fig. 5), which occur within gaps in the sandbars, usually during moderate to high waves. Approximately 48% of the incidents in 2016 were related to structural currents. To see a quick reference comparing the types of dangerous currents in the Great Lakes (as depicted in Fig. 5), visit Michigan Sea Grant's dangerous currents page.
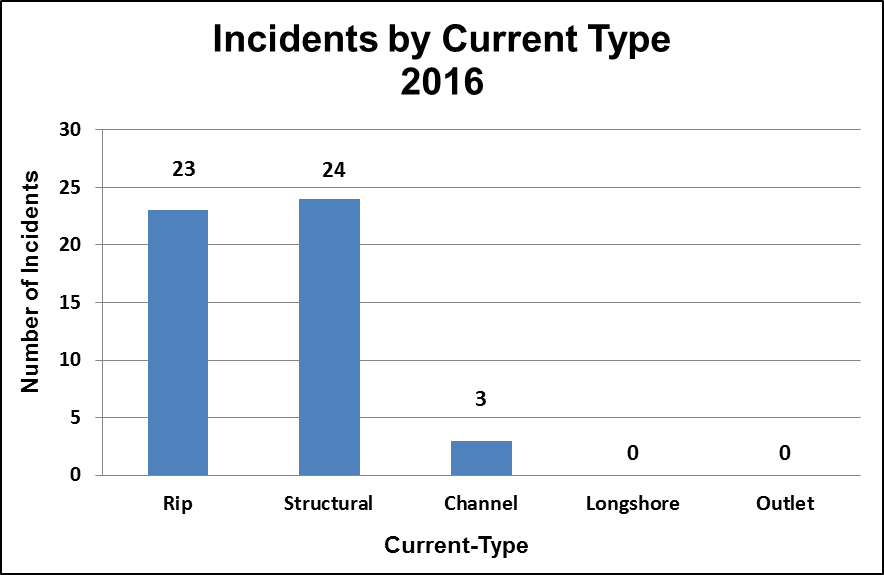
Fig. 5. Number of current-related incidents by current type in 2016(GLCID, 2016).
Conditions during Current-Related Incidents
All of the 2016 incidents occurred when wave heights were 3 to 6 ft or greater (Fig. 6). This is close to the normal distribution of wave heights observed during current related incidents, with the maximum numbers of incidents usually occurring in the 3 to 4 ft range. This is when dangerous currents are likely and the bulk of swimmers are not too intimidated by the waves to enter the water. Long term trends support this, as they show the number of incidents dropping off significantly after the 5 to 6 ft range.
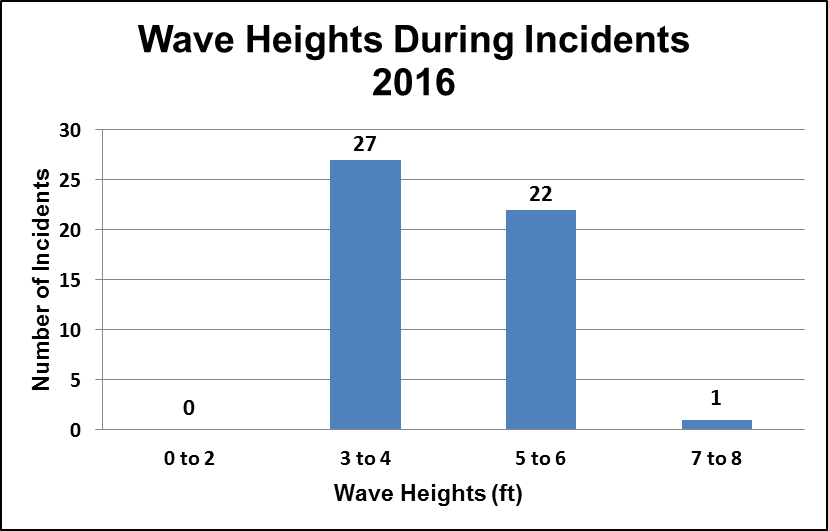
Fig. 6. Wave heights(ft) during current-related incidents in 2016(GLCID, 2016).
Waves approached the shore at a 60 to 90 degree angle during 64% of the incidents in 2016, and 32% of the incidents occurred when waves approached at a 30-59 degree angle relative to shore (Fig. 7). Research from both the ocean and the Great Lakes demonstrate that dangerous currents, particularly rip currents within the sandbars, are more likely as waves approach at more direct angles to the beach. This appears to be the case for 2016. The longer term incident data also suggests that a greater variety of currents may be present at these more direct angles of approach.
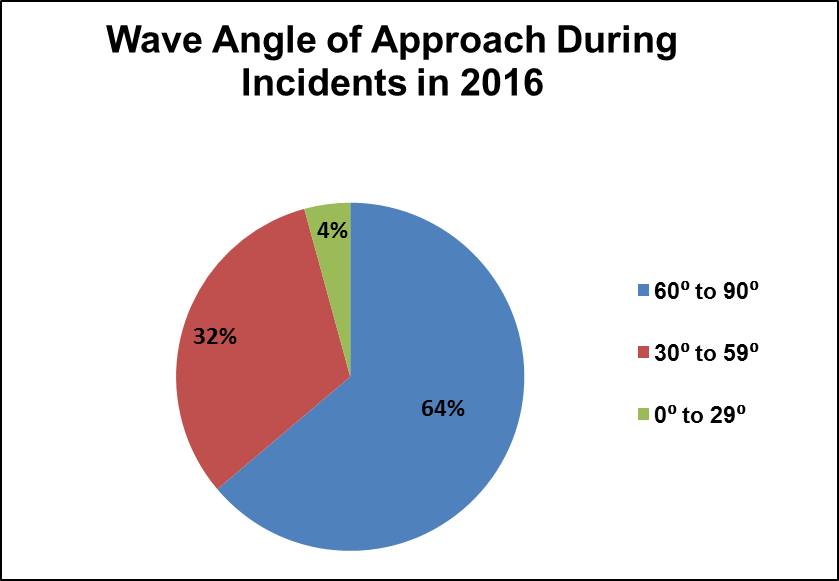
Fig. 7. Wave angle of approach (degrees relative to shore) during current-related incidents in 2016(GLCID, 2016).
Wave periods during current related incidents in 2016 were slightly longer than what we usually see each year, on the order of 6 to 7 seconds (Fig. 8). Longer wave periods bring a larger volume of water in to shore, which leads to an increased probability of current development. The longer periods may have contributed to the greater number of classic rip current cases in 2016.
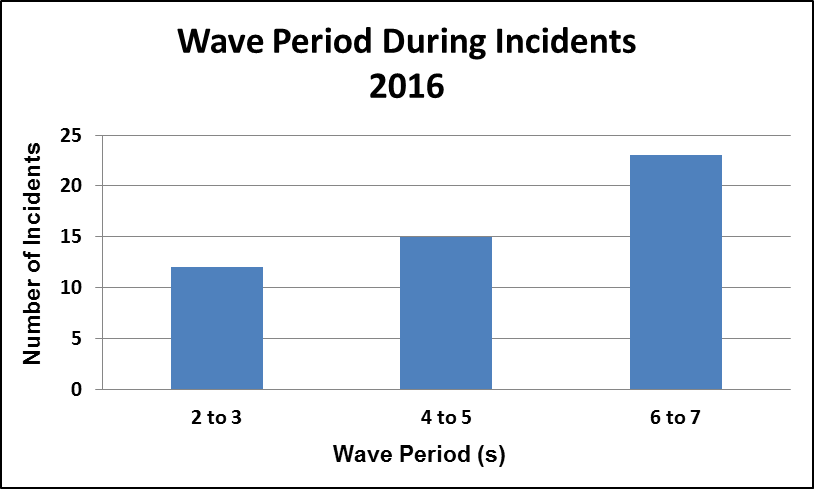
Fig. 8. Wave period(s) during current-related incidents in 2016(GLCID, 2016).
The weather pattern that brings hazardous lake conditions most often on the Great Lakes is the passage of a cold front (GLCID, 2002-2015). This was the case again in 2016, with nearly half of the incidents occurring either just prior to, during, or immediately after the passage of a cold front (Fig. 9). About 26% of the incidents occurred as a low pressure system (LP) was moving out (long after the cold front passed) and a strong high pressure system (HP) was building in, creating strong onshore winds and higher waves (HP/LP Combination).
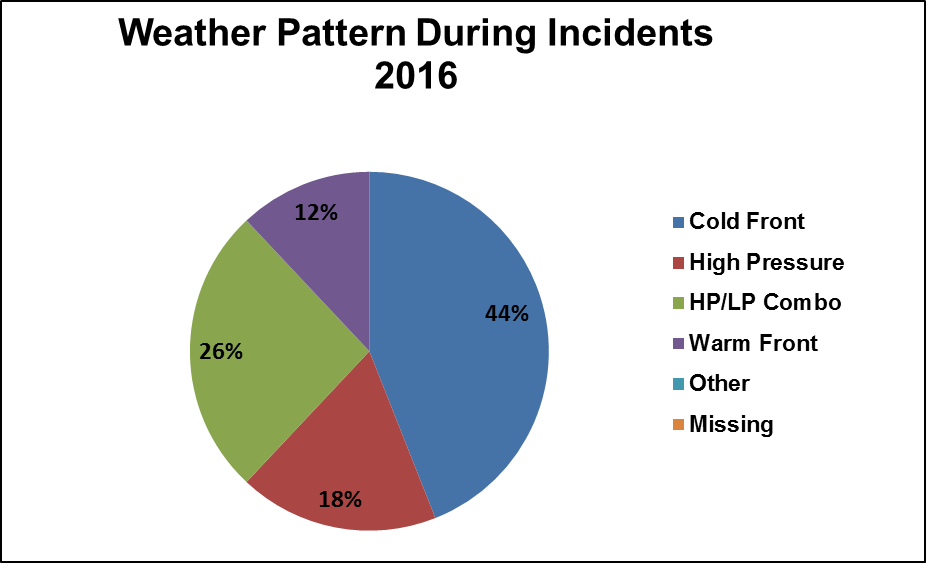
Fig. 9. Weather pattern during current-related incidents in 2016(GLCID, 2016).
Victim Demographics
GLCID data from 2002-2015 shows that a majority of victims involved in current-related incidents are adolescent- young adult aged males who live within 90 miles of the beach where the incident occurred. This year, 84% of the victims were male (Fig. 10) and between the ages of 10 and 27 (Fig. 11). The only difference between 2016 and the long term data was that there was more of an even distribution in the distance from the beach to the victim's hometown (Fig. 12). Note that there was a large portion of this data missing (a total of 14 incidents).
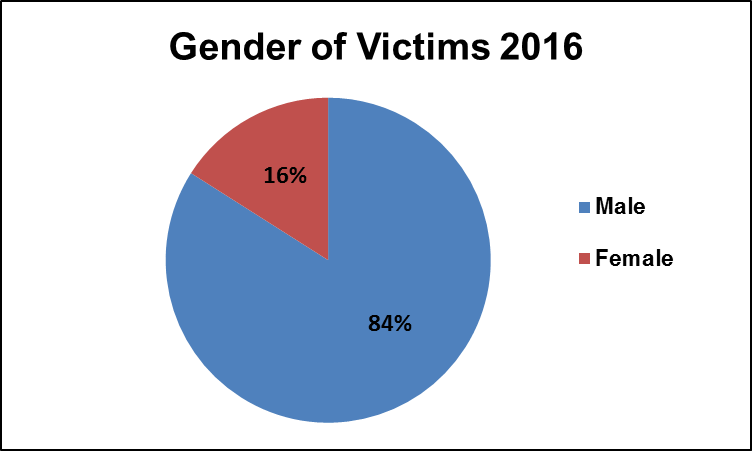
Fig. 10. Gender of victims involved in current-related incidents 2016(GLCID, 2016).
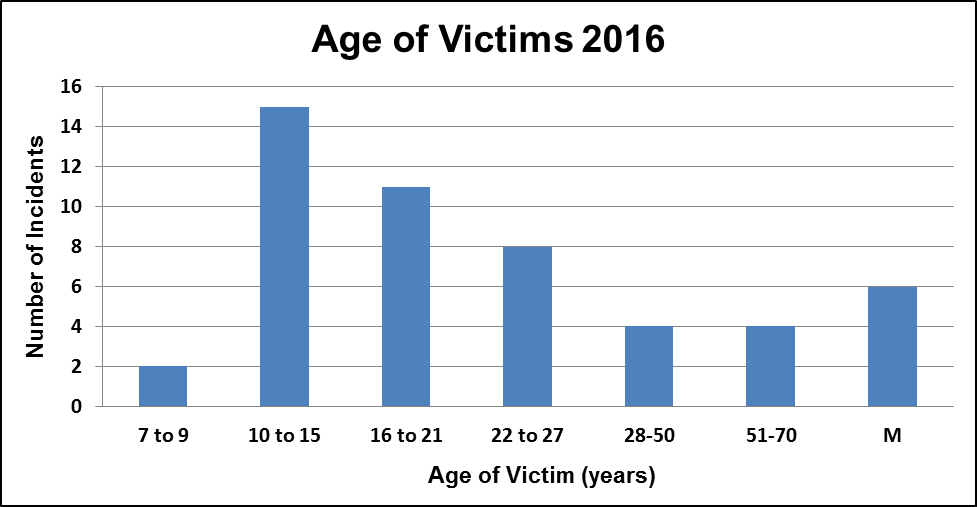
Fig. 11. Age of victims involved in current-related incidents 2016(GLCID, 2016).
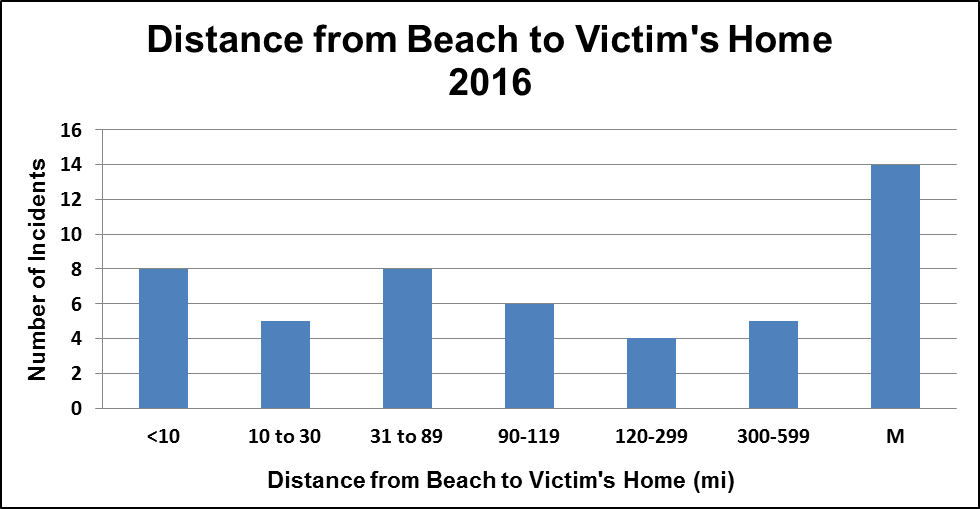
Fig. 12. Distance from beach where the incident occurred to the victim's hometown(GLCID, 2016).
Summary and Closing Thoughts
In summary, current related rescues and fatalities were slightly above average for the 2016 swim season, with 16 fatalities and 34 rescues (two still in critical condition as of 12/22/2017). Warm water and air temperatures, along with higher water levels were likely to blame for the greater than average number of current-related incidents in 2016. While numbers are slightly above average, it is important to recognize that the number of incidents has still decreased since the 2010-2012 time-frame, where air and water temperatures were comparable to this year (versus 2013-2015). I believe this is due to improvements in beach safety measures across the Great Lakes.
For beachgoers, note that the data is clear. To be safe on the Great Lakes, stay dry when waves are high and steer clear of the pier. Before you leave the beach, check the National Weather Service beach forecasts and watch for beach hazards statements, both of which will tell you when conditions are going to be inappropriate for swimming. This forecast is produced at least twice daily during the swim season each year (roughly Memorial Day to Labor Day).
To see a review of all the Great Lakes Current Incident Database statistics, click “about” at the top of this page. You will also find a summary of how the data is collected, where you can submit corrections or information about current-related incidents, and even search the database. For questions/comments/concerns, please contact megan.dodson@noaa.gov
References and Resources
Great Lakes Current Incident Database (GLCID, National Weather Service, 2017). https://www.weather.gov/iwx/beach_season_summaries
Great Lakes Environmental Research Center (GLERL/GLSEA, 2017): https://coastwatch.glerl.noaa.gov/statistic/
Great Lakes Surf Rescue Project: https://www.glsrp.org
Great Lakes Water Safety Consortium (2017): Get involved: https://greatlakeswatersafety.org/
Meadows, G.A., Meadows, L.A., Wood, W.L., Hubertz, J.M., & Perlin, M. (1997): Journral Ametsoc.
Midwestern Regional Climate Center (MRCC, 2016):https://mrcc.isws.illinois.edu/cliwatch/watch.htm#
Michigan Sea Grant (2016):https://www.dangerouscurrents.org
Evanoff, M. (2016). Michigan State Park Attendance: June-September 2016. Personal correspondence.
NWS Beach Forecast Page: https://www.weather.gov/greatlakes/beachhazards
Additional research on dangerous currents:https://www.weather.gov/iwx/beachpage_references
Great Lakes Water Levels Info
Overview
Current related fatalities were well below average for the 2017 swim season, with only 7 occurring through January 1, 2018. On the other hand, rescues were slightly above the average at 26. The ten-year average from the Great Lakes Current Incident Database (GLCID) is 12 fatalities and 23 rescues per year (2002-2011). It was an atypical year, with weather patterns favoring more easterly flow than what we normally see. This led to most of the current related incidents being on the western sides of the Great Lakes. Colder than average temperatures in mid-late August and increased water safety measures could have led to the lower than average number of drowning fatalities.
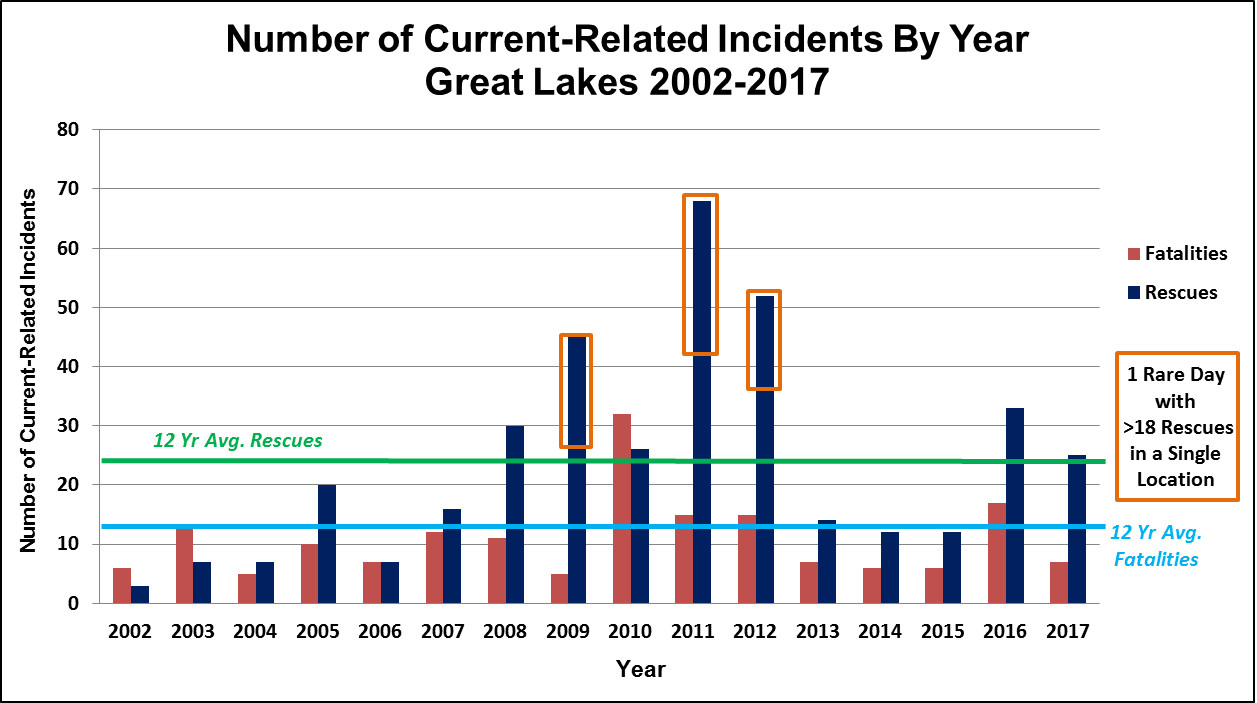
Fig. 1.Number of current-related incidents by year (2002-2017). 2017 had less current-related fatalities than average, and slightly more rescues than average (GLCID, 2017).
Air & Water Temperatures
Normally, we see a majority of current-related incidents in the month of August. This year, however, we saw fewer incidents than average during late August (defined as Aug 15-31st), possibly due to colder air temperatures at that time (Fig 2a). Most of our rescues and fatalities occurred in early July (defined as July 1st-July 15th). There were no current-related fatalities or rescues reported in October and November, which is pretty typical.
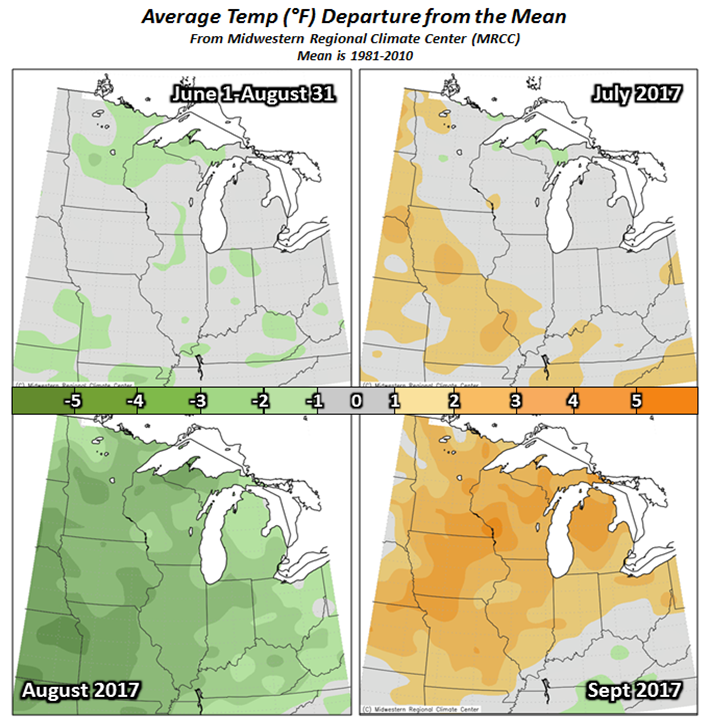
Fig. 2a. Midwestern Regional Climate Center (MRCC). Average temperatures (departure from the mean) for June 1 through August 31, 2017 (upper left), July(upper right), August (bottom left), and September (bottom right).
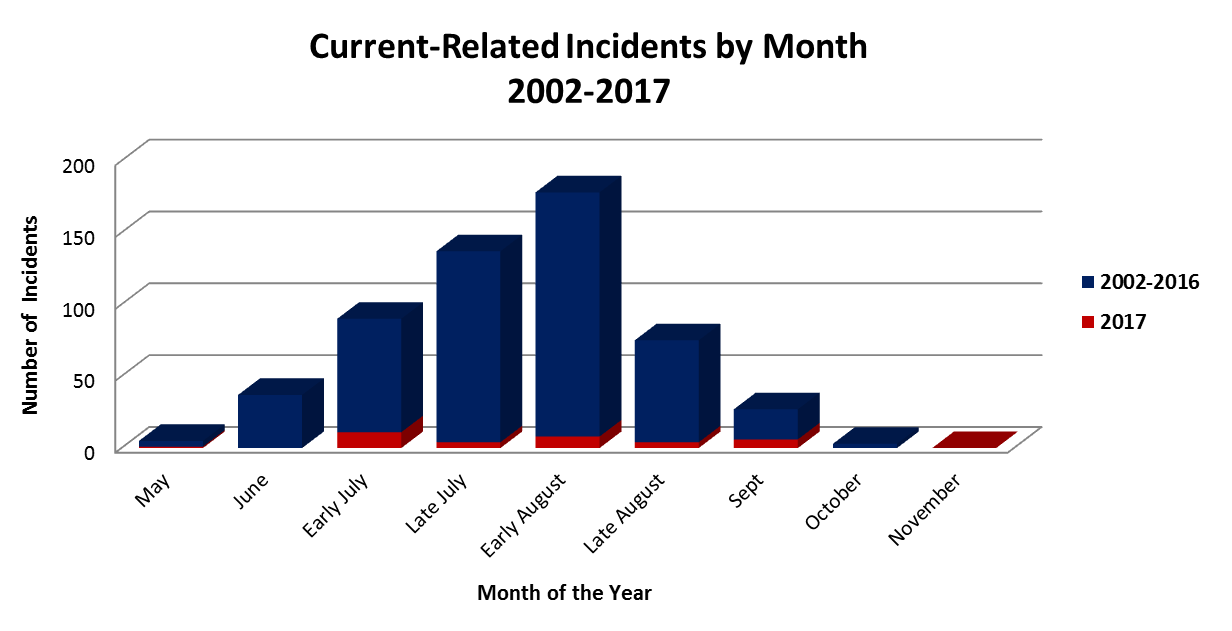
Fig. 2b. Current-related incidents by month, comparing 2002-2016 to 2017 (GLCID, 2017).
Water temperatures during the 2017 swim season were slightly above average (Fig. 3), with the exception of an unusual high spike in September-October. Lake Michigan water temperatures are shown below, which is where a majority of the incidents occurred this year (Fig. 5). It is surprising that despite the warmer water temperatures we still had a lower number of current-related fatalities.
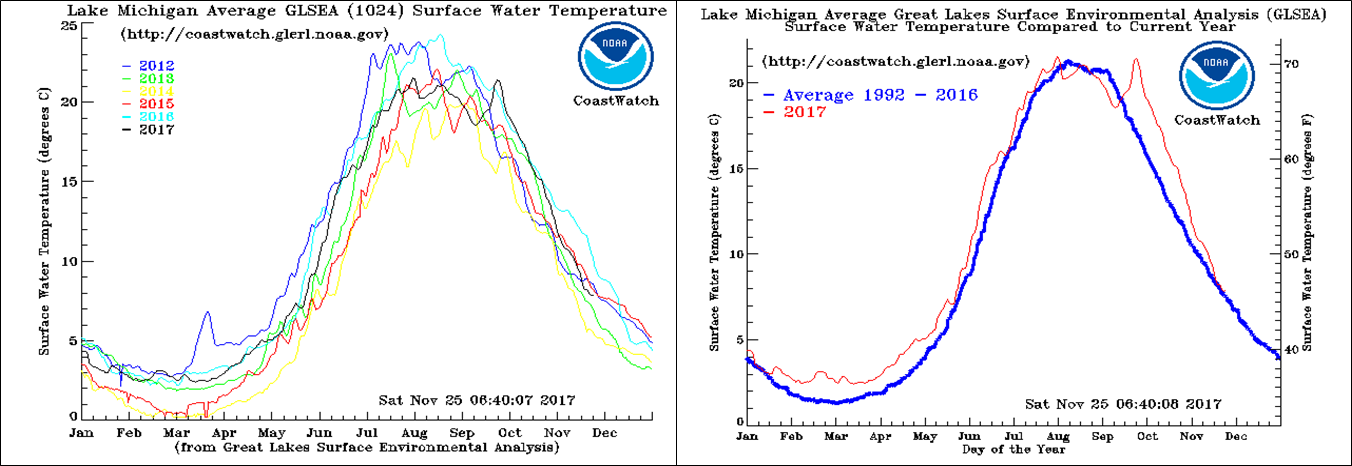
Fig. 3. Lake Michigan water temps from the Great Lakes Environmental Research Center GLSEA. Lake Michigan average water temperatures from 2017 as compared to the long term average (right) and the previous years (left).
Where Did the Incidents Occur?
An updated map of current-related incidents from 2002-2017 is shown below (Fig. 4). A majority of current-related incidents this year occurred on Lake Michigan (which is normal), followed by Lakes Ontario and Superior. There were no incidents reported to us from Lake Huron or Lake Erie (Fig. 5).
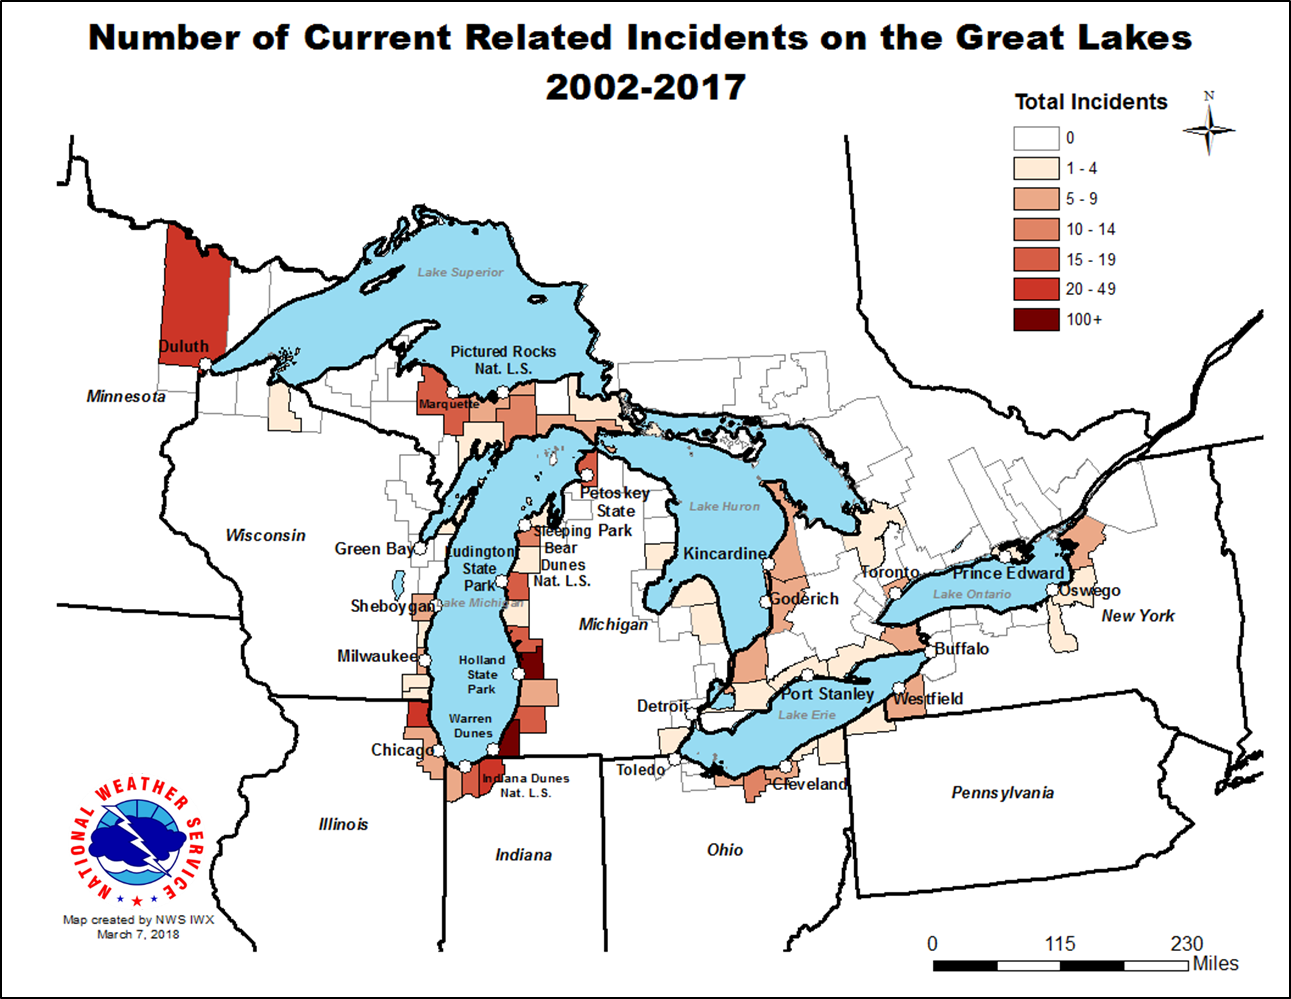
Fig. 4. Map of Great Lakes current-related incidents (rescues and fatalities) from 2002-2017 An interactive version of this map can be found here. (GLCID, 2017).
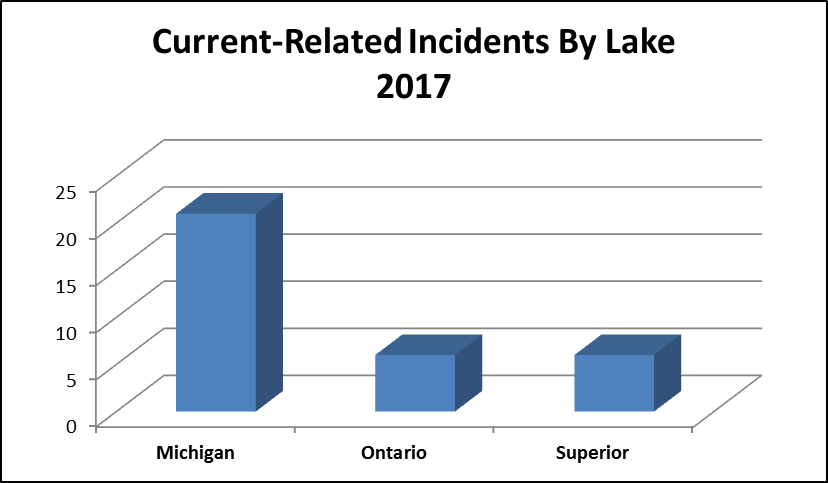
Fig. 5. Number of current-related incidents by Lake in 2017(GLCID, 2017).
In 2017, we saw nearly equal numbers of structural and classic rip current related incidents. In the early years of data collection (2002-2012), the majority of current-related incidents (roughly 60%) occurred near shoreline structures. This was likely due to several rare events where over 18 people were rescued from strong structural currents and waves in the same location on the same day (see fig. 1). I suspect in reality we probably see a more equal distribution of both current-types developing under similar conditions, though we can only speculate based on what we know about current development.
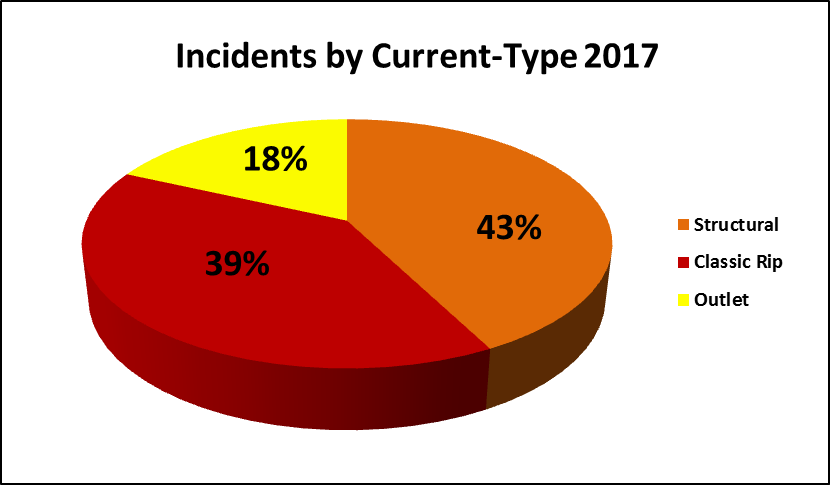
Fig. 6. Incidents by Current-Type in 2017(GLCID, 2017).
Conditions at the Time of Incidents
Conditions during the incidents were what would be expected given the 2002-2016 data. A majority of the incidents occurred with waves of 3 feet or greater (Fig. 7) approaching the shoreline at a 60-90 degree angle (Fig. 8), with periods of 4 to 5 seconds (Fig. 9).
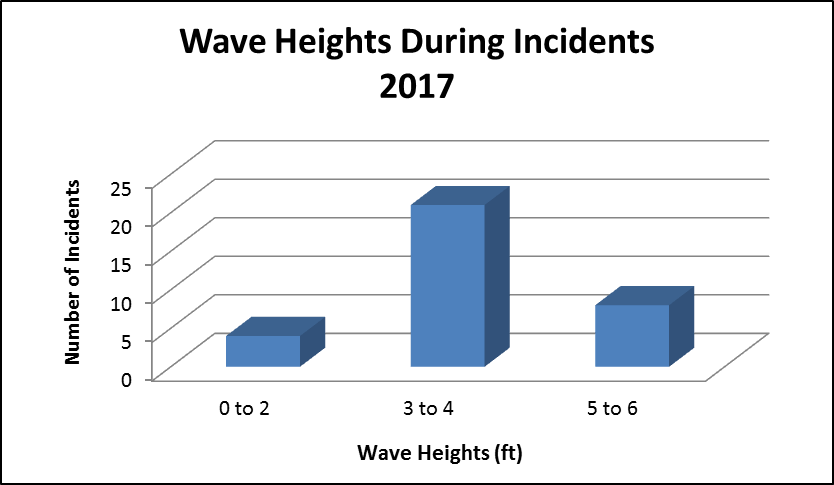
Fig. 7. Wave heights during incidents in 2017 (GLCID, 2017).
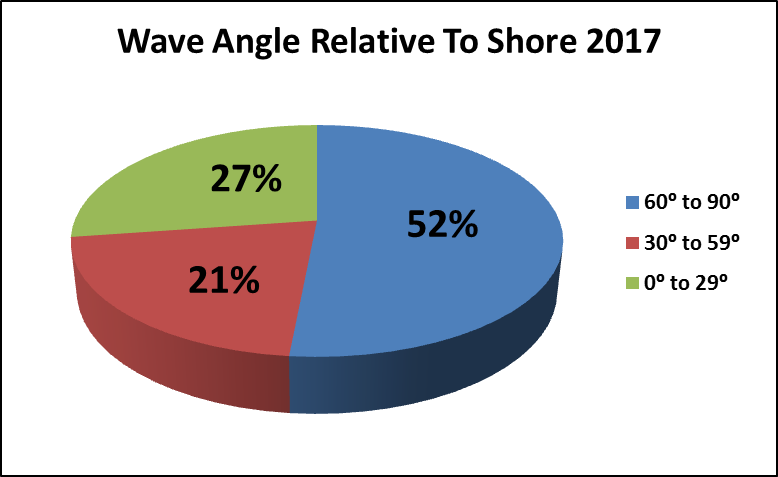
Fig. 8. Wave angle of approach relative to shore during incidents in 2017 (GLCID, 2017).
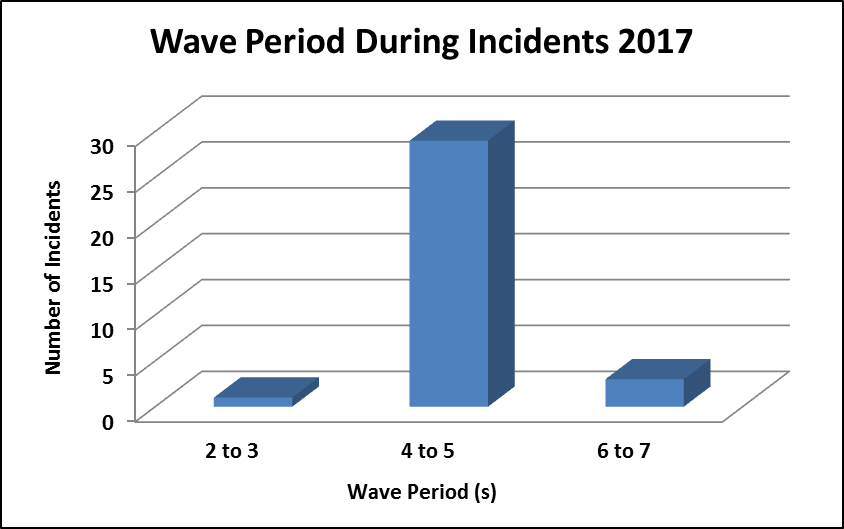
Fig. 9. Wave periods during incidents in 2017 (GLCID, 2017).
If you split up the incidents by current type for 2017, classic rip currents occurred with longer wave periods, more direct approaches, and generally higher wave heights than structural currents. All four incidents that occurred during wave heights of two feet or less were near shoreline structures, like piers and breakwalls.
The weather pattern during incidents was atypical this year. Usually we see a majority of incidents (around 60%) occur around the time when a cold front is crossing the lake where the incident occurred. This year, we saw a larger percentage of incidents occur when there was a high pressure system creating stronger onshore flow or even a warm front creating more direct onshore approaches on the western side of Lake Michigan (Figure 10a). When you compare the beaches where incidents occur from 2002-2017 (Fig 10b), you can see a large portion of the incidents occurred at westward facing beaches. This is expected given the prevailing winds in the US are the westerlies. This was similar to this year, where nearly half of the incidents were at westward facing beaches. The unusual aspect of 2017 was the higher percentage of beaches facing a NE or SE direction. While 2002-2016 data demonstrated that SE facing beaches saw only 4% of incidents, the 2017 data had nearly a quarter of the incidents at SE facing beaches.
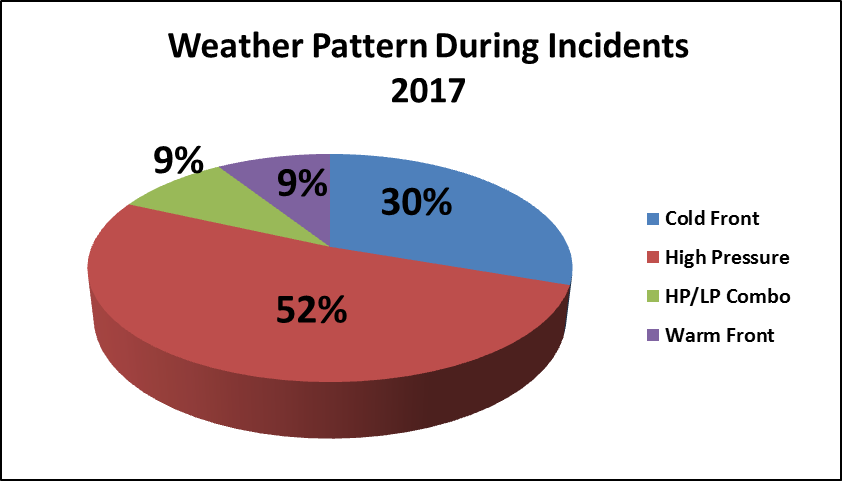
Fig. 10a. Weather pattern during current related incidents in 2017 (GLCID, 2017).
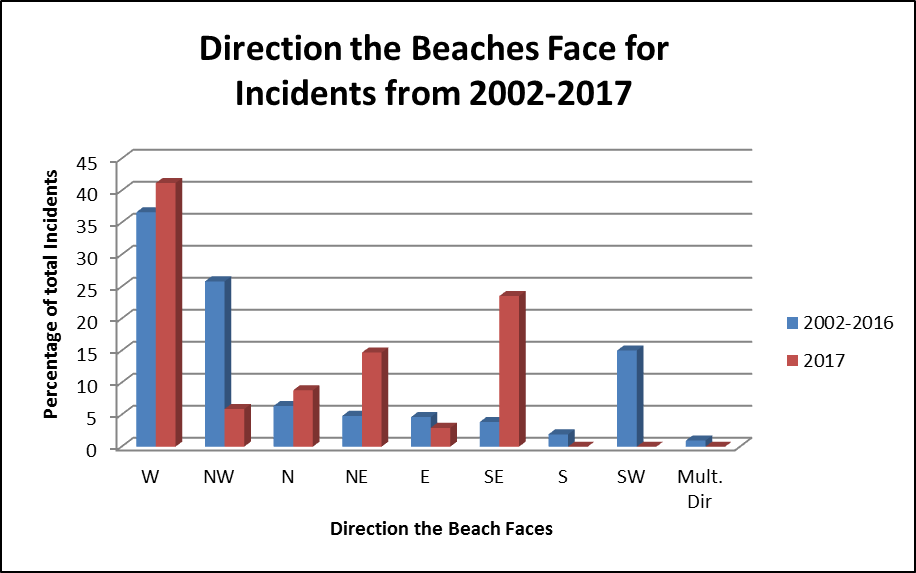
Fig. 10b. Percentage of incidents that occur at various beach-facing directions. For example, roughly 37% of incidents from 2002-2016 occurred at westward facing beaches (GLCID, 2017).
Victim Demographics
Another interesting aspect of 2017 was that we saw that more females than males were involved in current-related incidents (Fig. 11). In the 2002-2016 data, around 80% of victims are male.
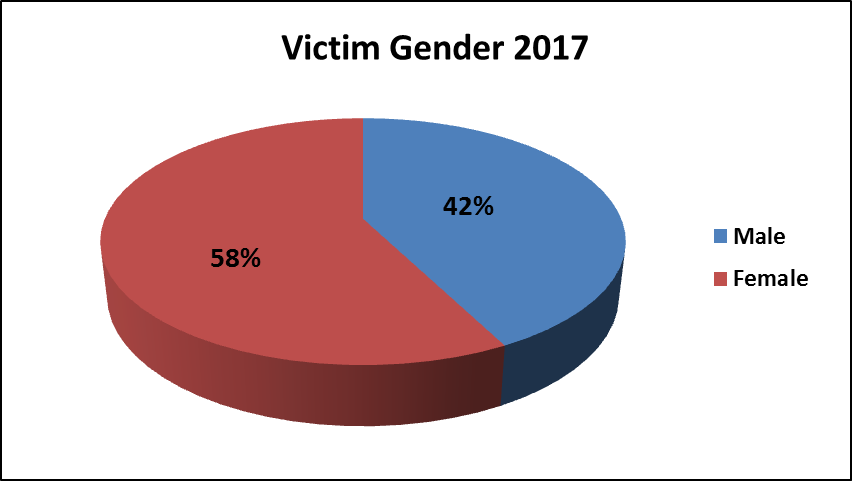
Fig. 11. Gender of victims involved in current-related incidents in 2017 (GLCID, 2017).
Unfortunately, I was unable to narrow down the details such as age and hometown for many of the rescue victims. I am still working with authorities to obtain the information as of March 7, 2018 and will update the graphs and this webpage as soon as I hear back from these agencies. However, the data I was able to collect regarding the age (Fig. 12) and distance from the beach to victim's hometowns (Fig. 13) is fairly typical of what we see annually. Victims were younger, mainly between the ages of 10 and 21. It was roughly half and half between victims who lived within 30 miles of the beach where the incident occurred, and those who were tourists (Defined as anyone who lives further than 30 miles from the beach).
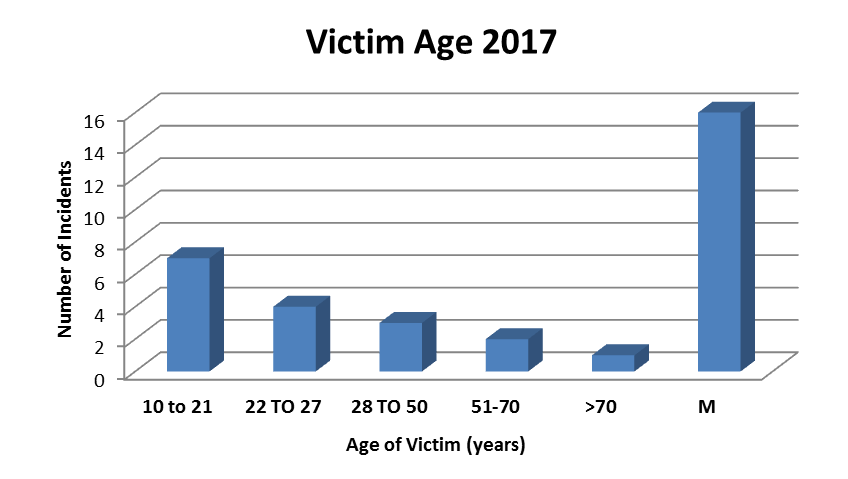
Fig. 12. Age of victims involved in current-related incidents in 2017 (GLCID, 2017).
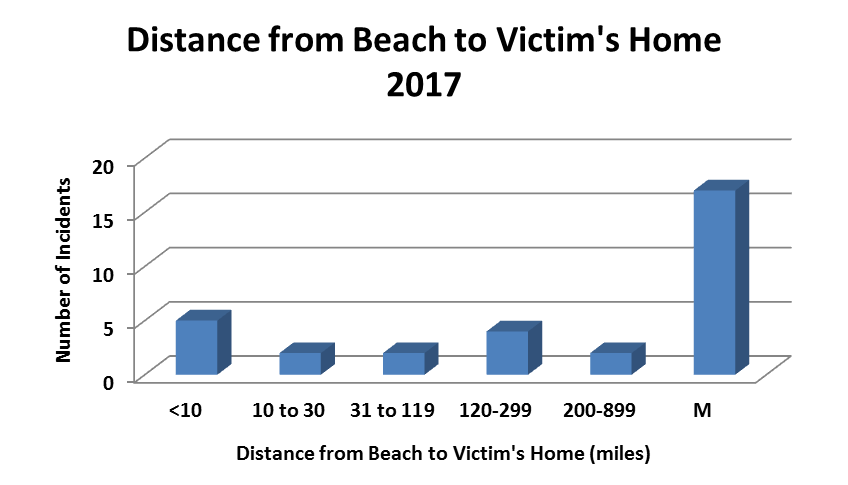
Fig. 13. Distance from beach where the incident occurred to the victim's hometown in 2017(GLCID, 2017).
Summary
In summary, 2017 was a below average year in terms of current-related fatalities. We can only speculate as to the reasons, but I suspect it relates to a colder than average August. Additionally, we know that at least four of the incidents were rescues due to water safety efforts, where recently installed lifesaving equipment was used for a quick rescue. Had we had four drownings that day instead of rescues, this year would have been closer to average. One final note is that as of 12/22/17 I am still working to confirm or rule out currents as being a partial cause of one fatality. Unfortunately, due to difficulties reaching those who were eyewitnesses or involved in rescue/recovery operations, it may be some time before these are added to the database. If these are confirmed, it will bring the totals to 8 fatalities and 27 rescues. Should this occur, I will update the webpage graphs. It is also important to notice that the 2016 swim season summary was updated to include additional fatalities and rescues that were sent to us over the winter of 2016-2017. The graphs on our overview page were also updated to account for the 2016 and 2017 swim season updates. If you know of a current-related rescue or drowning that is not included in the 2002-2017 data, please fill out this form. This will send megan.dodson@noaa.gov a direct email with the information needed to add it to the database. Thank you to those who provided data for the Great Lakes Current Incident Database during the 2017 swim season. The data helps us to get a handle on the weather and water conditions present during incidents, and hopefully fulfill our mission of protecting lives (and ending drowning on the Great Lakes).
References and Resources
Great Lakes Current Incident Database (GLCID, National Weather Service, 2017). https://www.weather.gov/iwx/beach_season_summaries
Great Lakes Environmental Research Center (GLERL/GLSEA, 2017): https://coastwatch.glerl.noaa.gov/statistic/
Great Lakes Surf Rescue Project: https://www.glsrp.org
Great Lakes Water Safety Consortium (2017): Get involved: https://greatlakeswatersafety.org/
Meadows, G.A., Meadows, L.A., Wood, W.L., Hubertz, J.M., & Perlin, M. (1997): Journral Ametsoc.
Midwestern Regional Climate Center (MRCC, 2016):https://mrcc.isws.illinois.edu/cliwatch/watch.htm#
Michigan Sea Grant (2016):https://www.dangerouscurrents.org
Evanoff, M. (2016). Michigan State Park Attendance: June-September 2016. Personal correspondence.
NWS Beach Forecast Page: https://www.weather.gov/greatlakes/beachhazards
Additional research on dangerous currents:https://www.weather.gov/iwx/beachpage_references
Great Lakes Water Levels Info
https://www.glerl.noaa.gov/data/dashboard/GLWLD.html
https://www.glerl.noaa.gov/data/wlevels/#overview
Overview
According to the Great Lakes Surf Rescue Project., 2018 was a record year for drowning on the Great Lakes, with 117 fatalities reported. Above normal air and water temperatures were likely contributors, drawing larger crowds to the beach. Despite this, the number of current-related fatalities ended up at the ten-year average of 12 fatalities, with a slightly above average number of rescues (27). A majority of the incidents (rescues and fatalities) occurred on Lake Michigan. Figure 1 shows the number of current-related incidents per year since the database began (2002).
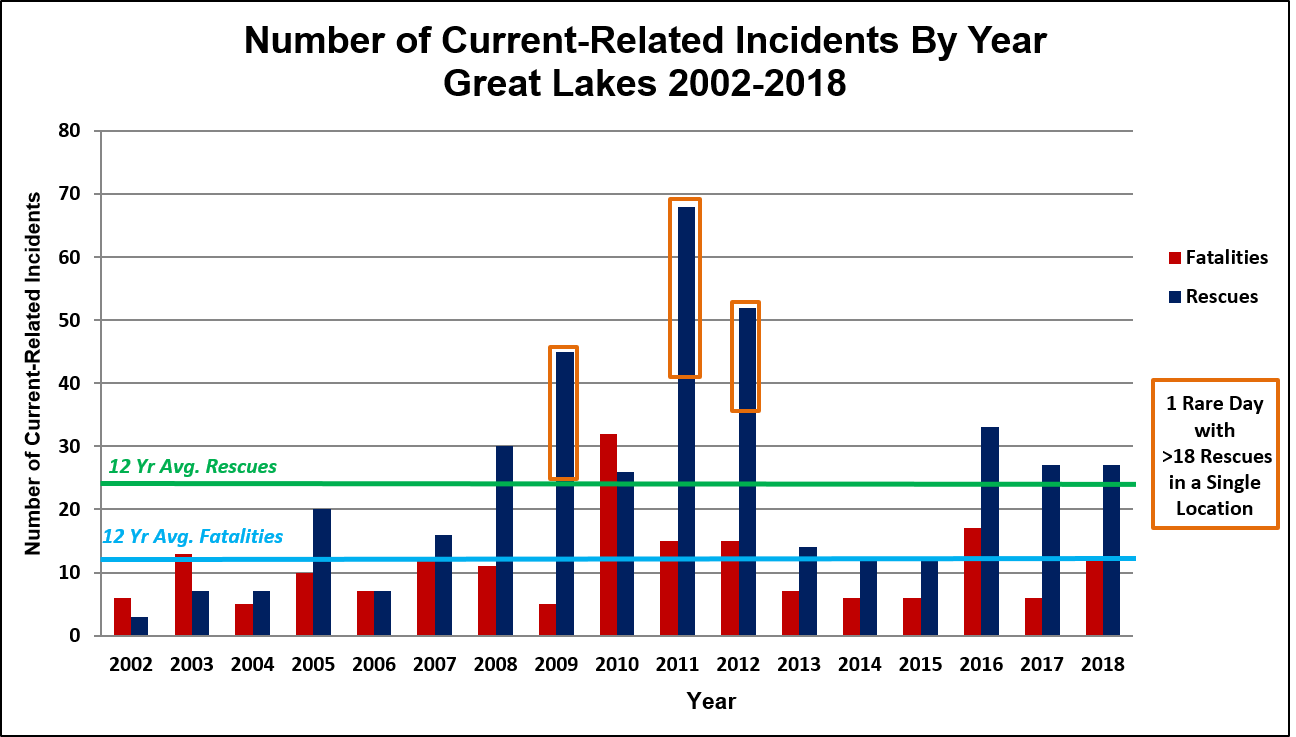
Fig. 1. Current-related incidents from 2002-2018 (GLCID, 2018).
Air and Water Temperatures
Air and water temperatures during the 2018 swim season (May-September) were above average, especially for the month of August. The above-average water temperatures (Fig. 2), in concert with above-average air temperatures (Fig. 3), likely contributed to the higher number of drownings in 2018 (117 fatalities altogether, 12 current-related). During the 2016 season we saw similar trends in air and water temperature, and that was also a record breaking year for fatal drownings (99 fatalities, 16 current related). Water temperatures this year remained near average until late June, just in time for the Independence Day Holiday weekend, and remained above until October. We had our first rash of current-related incidents between the dates of June 30th-July 6th, 2018. Daily temperature records were broken in several locations around Lake Michigan that week, with highs ranging from the mid to upper 80s to the 90s. The end of July began the stark rise to well-above average water temperatures, which continued into late August.
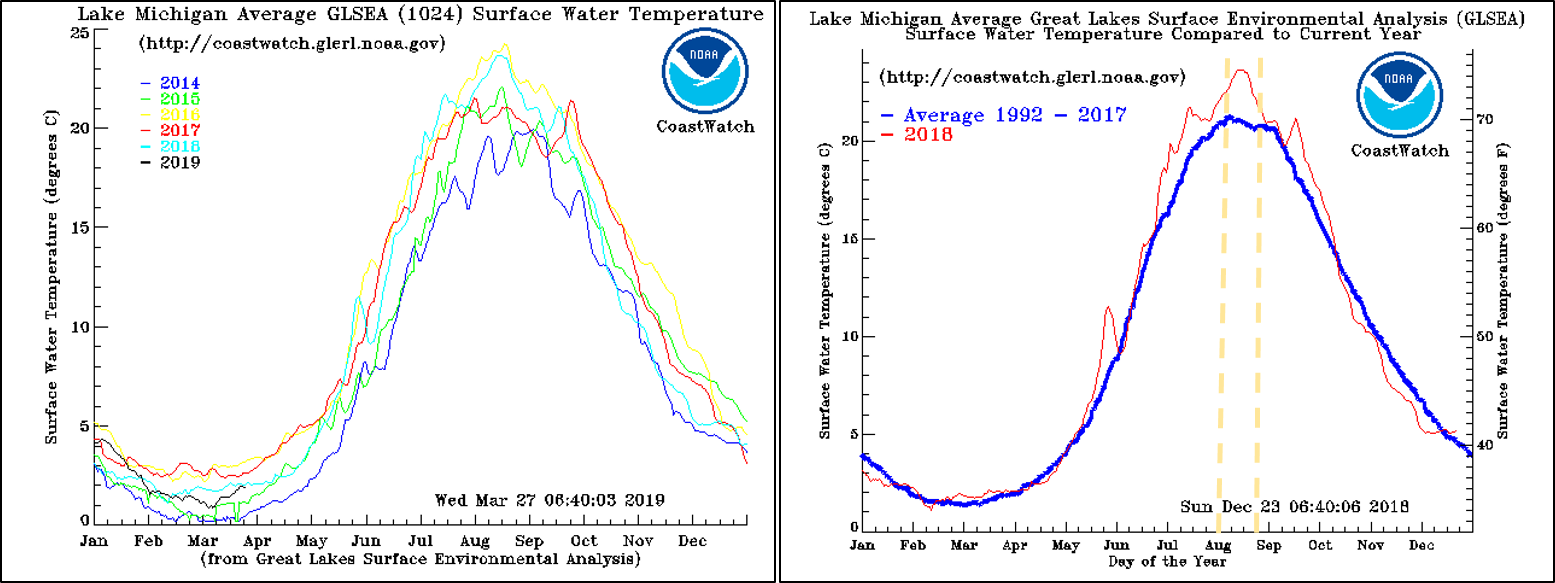
Fig. 2. Lake Michigan Water Temps (2014-2019 Yearly comparison on left, 2018 vs. 1992-2017 average on the right). Image from GLSEA.
A majority of the 2018 incidents occurred in mid-late August(Fig. 4a), which is typical for the Great Lakes (Fig. 4b). From late July into August we generally see our warmest water and air temperatures of the year, and people are travelling for their final summer vacation before school begins. We can also get stronger cold fronts moving over the warm lake in August, creating instability and rapidly building waves. The quick increase in wave heights often catches swimmers off guard.
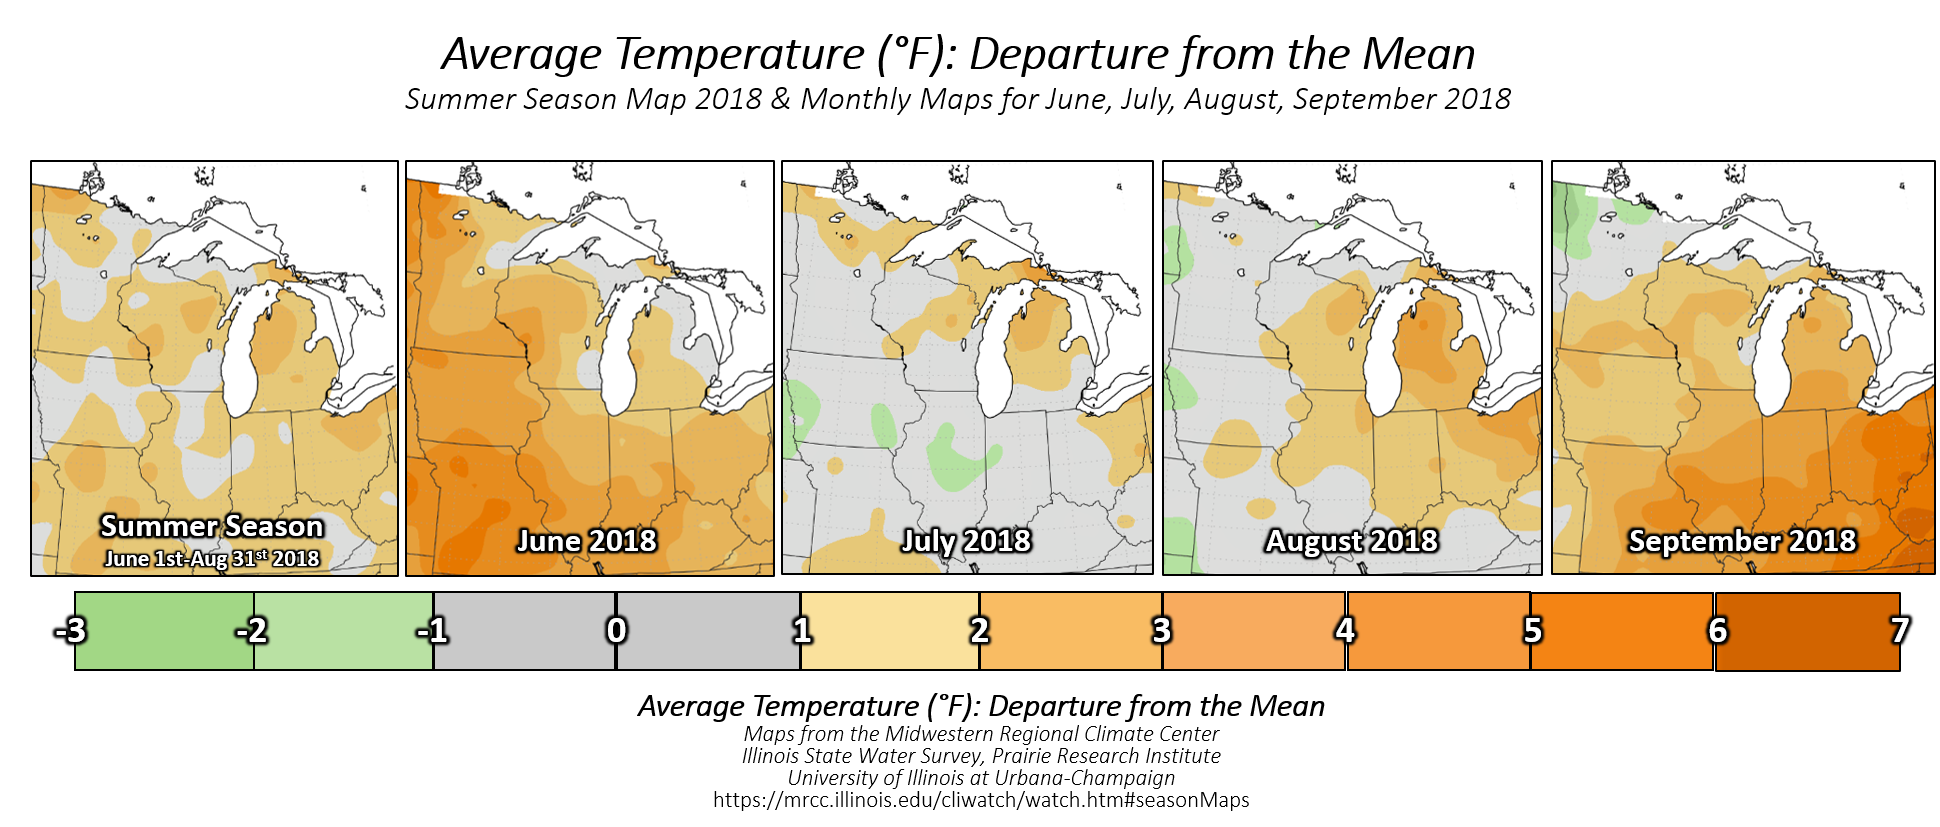
Fig. 3. Midwestern Regional Climate Center (MRCC). Average Temperature (F) Departure from the Mean for Summer 2018 (both seasonal and monthly maps).

Fig. 4a. 2018 Current-Related Incidents by Month (GLCID, 2018).
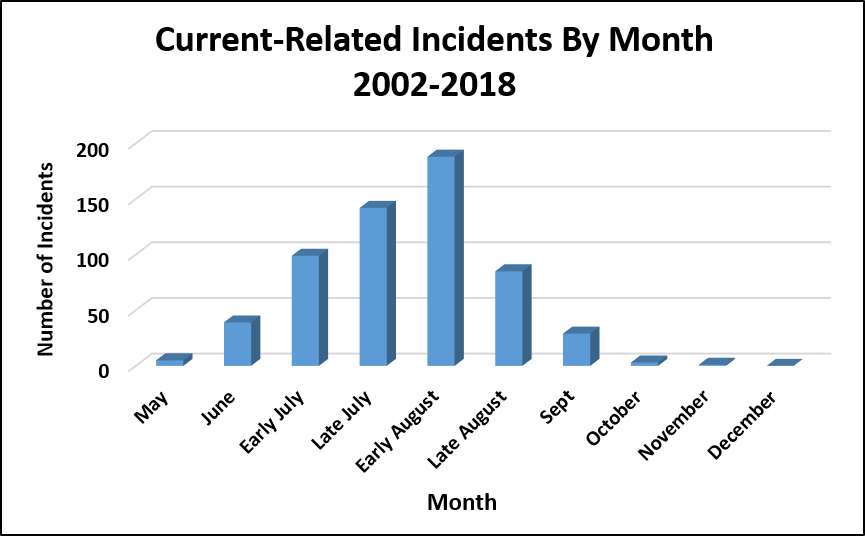
Fig. 4b. 2002-2018 Current-Related Incidents by Month (GLCID, 2018).
Where Did the Incidents Occur?
A majority of the current-related incidents this year occurred in Lake Michigan (Fig. 5), which is normal, followed by Lake Ontario. There were no confirmed current-related incidents on Lakes Erie, Superior, or Huron in 2018; which is unusual when compared to the 2002-2017 data. Looking at the breakdown by state/province, most of the incidents in 2018 occurred in Michigan and Wisconsin. A map of all confirmed current-related incidents from 2002 to 2018 is shown in Figure 7.
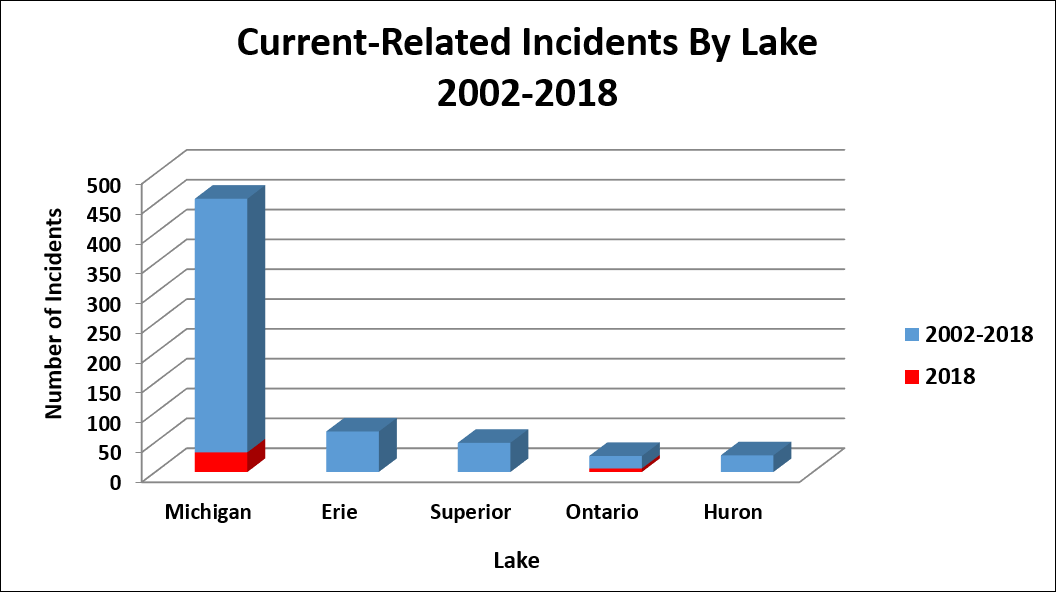
Fig. 5. Current-Related Incidents by Lake 2002-2018. A majority of current-related incidents occurred on Lake Michigan in 2018, which is normal (GLCID, 2018).
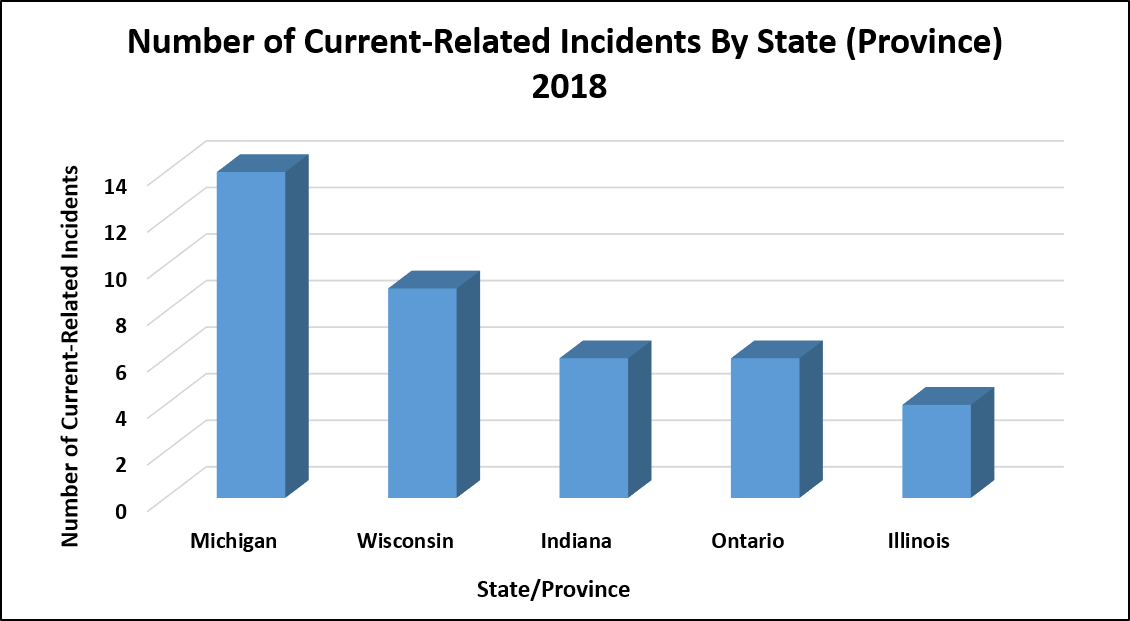
Fig. 6. Current-Related Incidents by State/Province for 2018. A majority of current-related incidents occurred in Michigan and Wisconsin (GLCID, 2018).
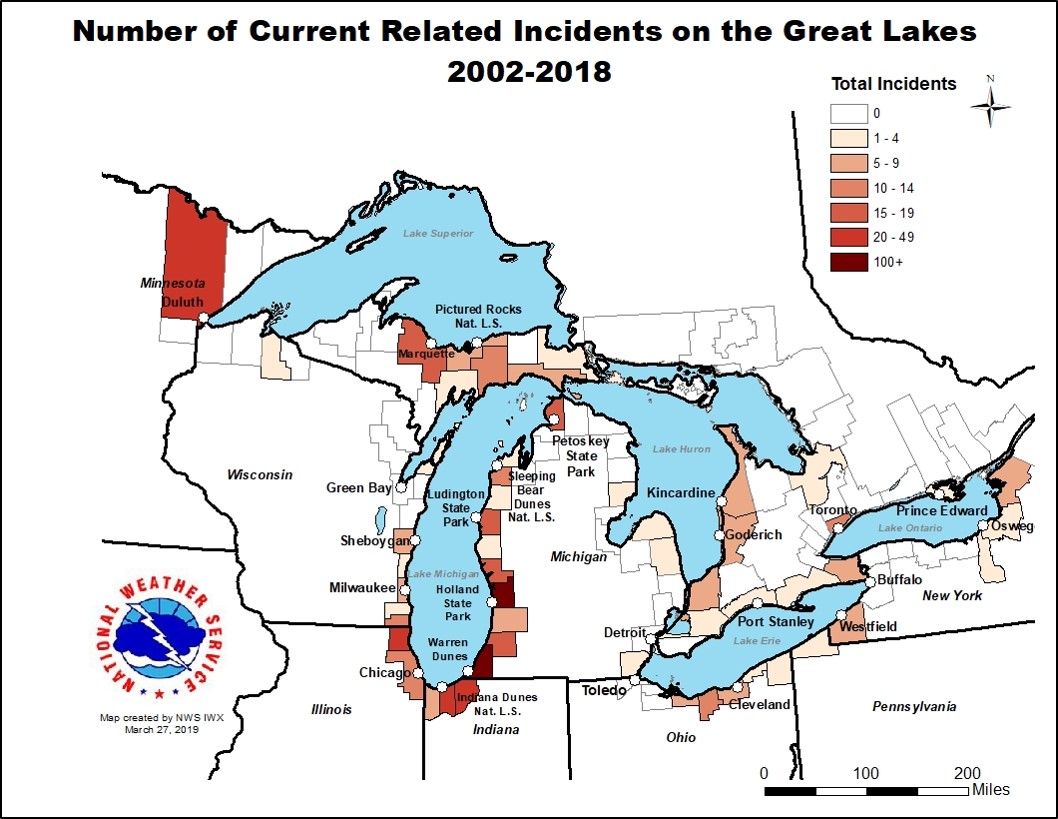
Fig. 7. A map of confirmed Current-Related Incidents from 2002-2018. For an interactive version of this map, visit (this website).
Current Type
In 2018, 46% of the incidents were related to structural currents (Fig. 8), which occur near shoreline structures like piers, breakwalls, or peninsulas. Classic rip currents, which form within gaps in the sandbars, accounted for 33% of the incidents. This is comparable to previous years. To see a quick reference comparing the types of dangerous currents in the Great Lakes, visit (Michigan Sea Grant's Dangerous Currents Page).
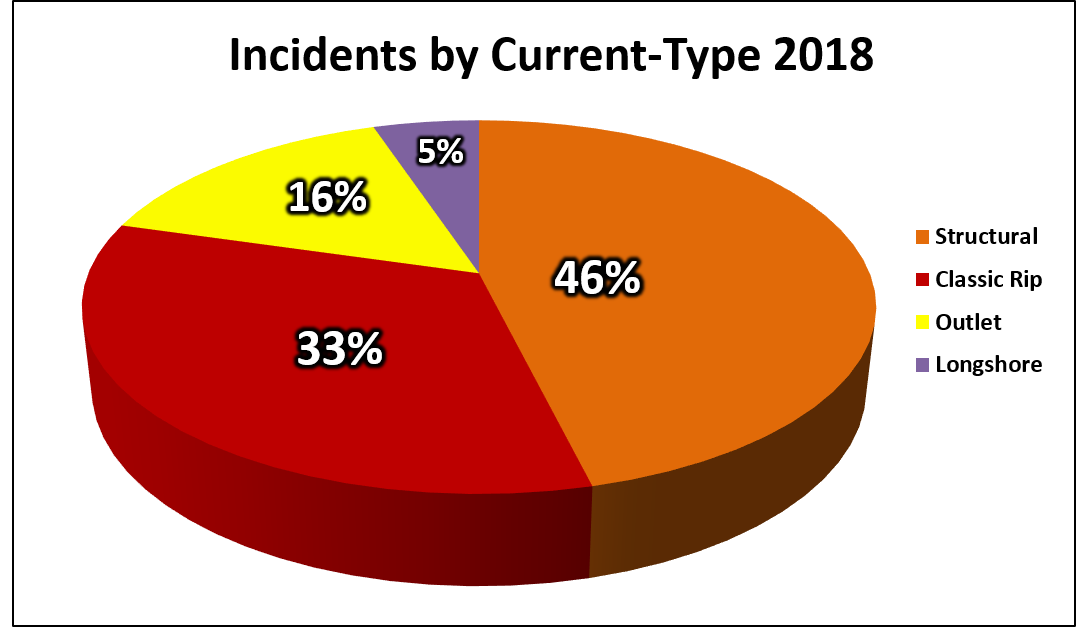
Fig. 8. 2018 Current-Related Incidents by Current-Type (GLCID, 2018).
Conditions During Current-Related Incidents
Wave conditions we know are favorable for dangerous currents include: direct, onshore wave approaches relative to shore (with a greater variety of currents present at beaches with additional features like breakwalls and river outlets), wave heights of 3 feet or greater, and long wave periods (the time between each passing wave, measured in seconds). Other factors, like water level fluctuations (seiches, meteotsunamis) can lead to current development or a strengthening of existing currents. These factors are reviewed below.
Wave Heights
Wave heights were 3 feet or greater during 77% of the current-related incidents in 2018, which is normal (Fig. 9, left). All of the classic rip current incidents in 2018 occurred once wave heights were 3 feet or greater (Fig. 9, right), which is expected. Most of the cases where the wave heights were 2 feet or less this season occurred near river outlets or shoreline structures, like piers and breakwalls. This is why water safety experts recommend that beachgoers not swim in these areas: because the currents are always present in some form, even during seemingly benign conditions. Wave heights were building (increasing in height) during most of the 2018 incidents, which may have caught swimmers off guard and thus contributed to their struggle.
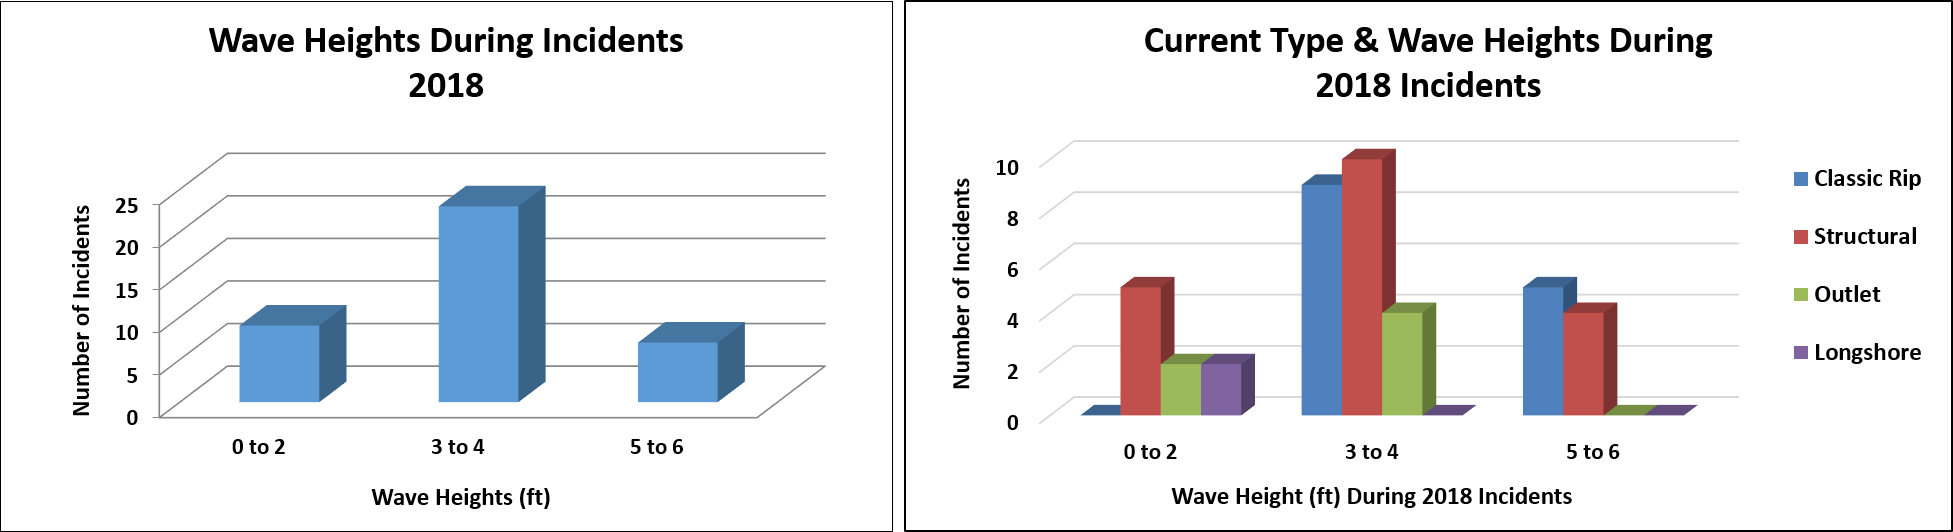
Fig. 9. Left: Wave Heights during 2018 Current-Related Incidents. Right: Wave Heights during 2018 Incidents-Classified by Current-Type (GLCID, 2018).
Wave Angle of Approach
When waves approach the shoreline directly (at a 90 degree angle), water is able to ‘pile up’ more efficiently, making dangerous currents more likely (especially classic rip currents). The strongest longshore currents and structural currents are usually observed at more oblique angles, ranging from 30 to 59 degrees (longshore current speed is maximized at 45 degrees). At lesser angles, structural currents and longshore currents are most likely-especially at beaches with shore-parallel sandbars. Shore-parallel sandbars have been shown to increase the longshore current speed. During the 2018 season, 49% of the current-related incidents occurred when waves approached at a 30-59 degree angle (Fig. 10a). The outlet current-related incidents were the only incidents that occurred with angles of approach less than 30 degrees (Fig. 10b). All six of the outlet-current related incidents occurred at the same location over the span of two days. According to the local Fire Chief who assisted with the rescue and recovery in these incidents, the river had been “swollen because of the unusually wet summer.” This would increase the strength of the outward flowing current (and the extent of the flow out into Lake Michigan), independent of wave factors like the angle of approach.
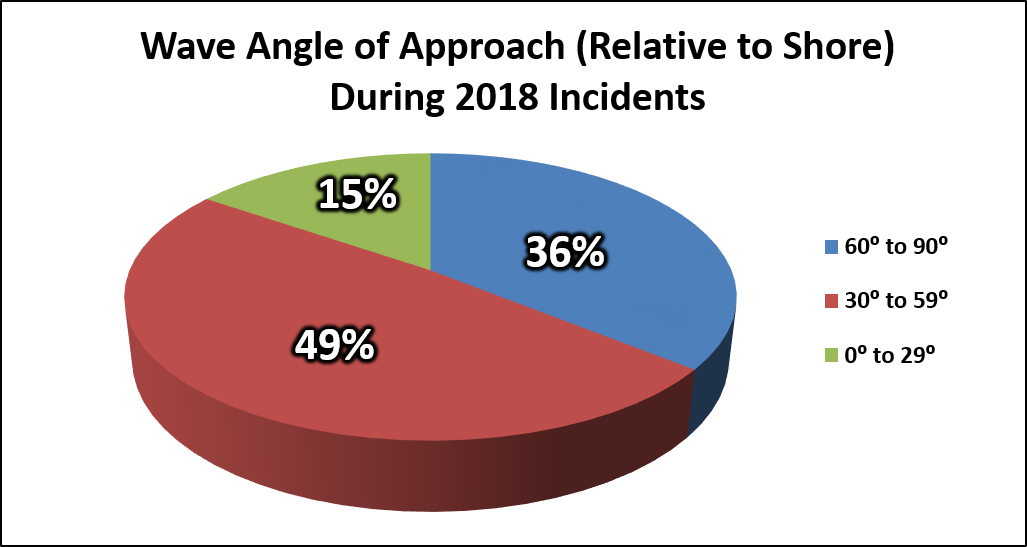
Fig. 10a. Wave angle relative to shore for the 2018 Current-Related Incidents (GLCID, 2018).
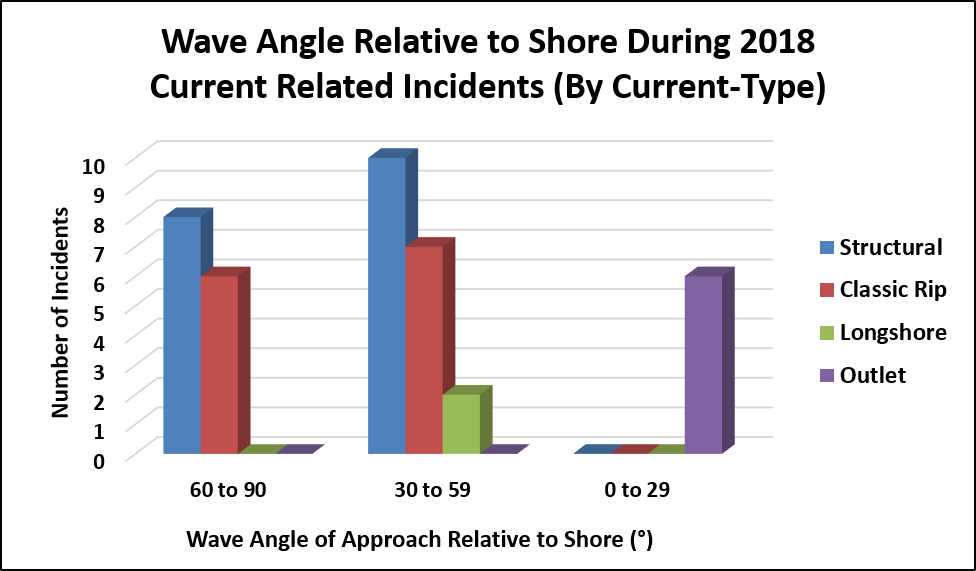
Fig. 10b. Wave angle of approach relative to shore during the 2018 current-related incidents, classified by current type (GLCID, 2018).
Wave Period
Water is able to ‘pile up’ more efficiently with longer wave periods (time between each passing wave), making dangerous currents more likely (especially classic rip currents). The average wave period on the Great Lakes is 4 seconds. During the 2018 season, wave periods observed during 90% of the current-related incidents were 4 seconds or greater (Fig. 11). This is comparable to the 2002-2017 data.
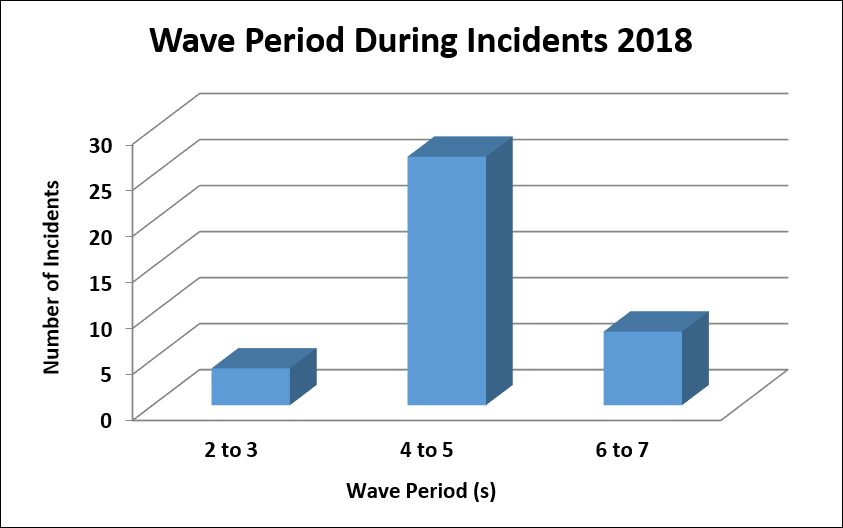
Fig. 11. Wave Period during Current-Related Incidents in 2018(GLCID, 2018).
Weather Pattern
The 2002-2017 data indicates that the passage of a cold front is the most commonly observed weather pattern during current-related incidents on the Great Lakes. The 2018 swim season differed from the norm, with 49% of incidents occurring with onshore flow due to a surface high pressure system, and only 15% were correlated with a cold front (Fig. 12).
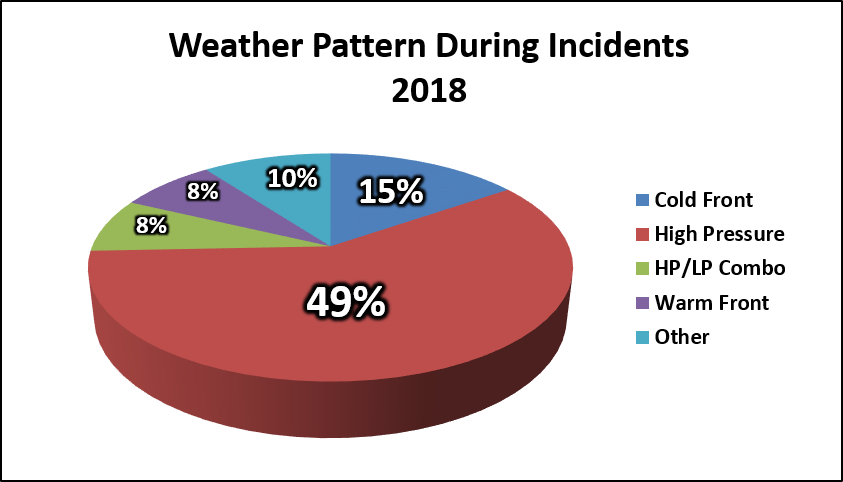
Fig. 12. Weather Pattern during Current-Related Incidents in 2018. HP/LP indicates high pressure/low pressure combination(GLCID, 2018).
Victim Demographics
A majority of the victims involved in current-related incidents during the 2018 season were male (Fig. 13), living within 100 miles of the beach where they drowned (Fig. 14). This is normal for the Great Lakes, based on the 2002-2017 data.
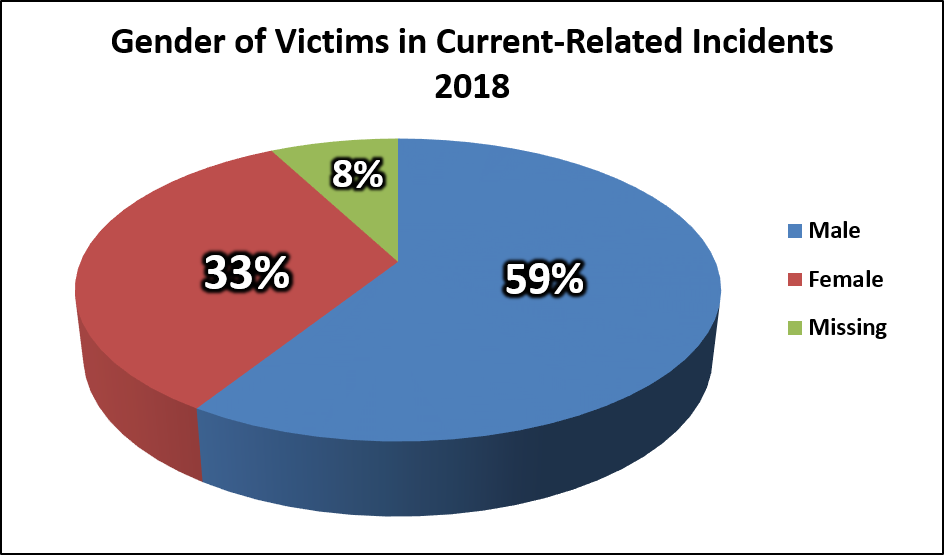
Fig. 13. Gender of victims involved in current-related incidents during the 2018 Swim Season. Unfortunately, we were unable to obtain information on the victim’s gender in 3 of the 39 cases (GLCID, 2018).
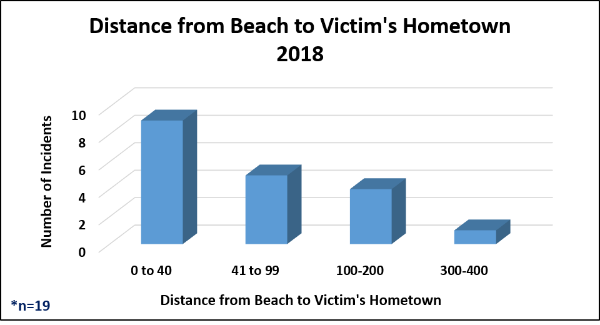
Fig. 14. Distance from Beach to Victim’s Hometown for current-related incidents 2018. Unfortunately, we were only able to get data on the victim’s hometown in 19 of the 39 cases (GLCID, 2018).
The age of the victims varied, with teenagers comprising a large portion of the incidents (Fig. 15). There were also a significant number of young to middle aged adults.
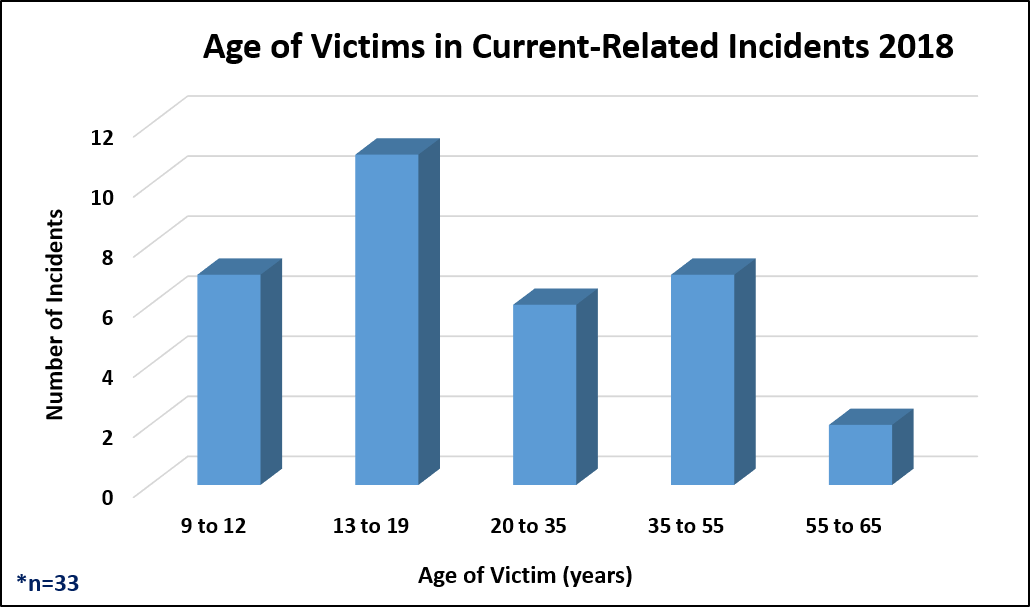
Fig. 15. Age of the victims involved in current-related incidents during the 2018 swim season. We were only able to get information about the victim’s ages in 33 of the 39 cases (GLCID, 2018).
Seven of the victims were “would be rescuers”—meaning they attempted a rescue and either drowned themselves or ended up needing rescue. Four of the would-be rescuers were in the 35 to 55 year age category, two were in the 13 to 19 year category, and one was in the 20 to 35 year age range. All but one of the would-be rescuers in the 35-55 year age category were trying to rescue their children from the conditions. This is why water safety experts suggest that anyone attempting rescue should be wearing a lifejacket, and have some kind of flotation device (lifejacket, ring, rescue board, or even beach ball) for the distressed person to grab onto. Often the initial victim is in such a panic that they grab onto the rescuer, pushing them underwater as they struggle for a breath.
Summary
In summary, 2018 was an average year in terms of current-related fatalities and slightly above average year for rescues. Statistics for the 2002-2018 data can be found on the “About” page (left on the orange tabs at the top of this page). If you’d like to see details on the individual incidents, you can search the GLCID here.
If you know of a current-related rescue or drowning that is not included in the 2002-2017 data, please fill out this form. This will send megan.dodson@noaa.gov a direct email with the information needed to add it to the database. If you have any corrections or missing information about an incident already in the database, just send a direct email to Megan.
Thank you to those who provided data for the Great Lakes Current Incident Database during the 2018 swim season. The data helps us to get a handle on the weather and water conditions present during incidents, and hopefully fulfill our mission of protecting lives (and ending drowning on the Great Lakes).
References and Resources
Great Lakes Current Incident Database (GLCID, National Weather Service, 2018). http://www.miseagrant.umich.edu/dcd/dcdsearch.php
Great Lakes Environmental Research Center (GLERL/GLSEA, 2018): https://coastwatch.glerl.noaa.gov/statistic/
Great Lakes Surf Rescue Project: https://www.glsrp.org
Great Lakes Water Safety Consortium (2019): Get involved: https://greatlakeswatersafety.org/
Meadows, G.A., Meadows, L.A., Wood, W.L., Hubertz, J.M., & Perlin, M. (1997): Journral Ametsoc.
Midwestern Regional Climate Center (MRCC, 2018):https://mrcc.isws.illinois.edu/cliwatch/watch.htm#
Michigan Sea Grant (2019):https://www.dangerouscurrents.org
NWS Beach Forecast Page: https://www.weather.gov/greatlakes/beachhazards
Additional research on dangerous currents:https://www.weather.gov/iwx/beachpage_references
Linares, Alvaro & Wu, Chin & J. Bechle, Adam & J. Anderson, Eric & A. R. Kristovich, David. (2019). Unexpected rip currents induced by a meteotsunami. Scientific Reports. 9. 10.1038/s41598-019-38716-2. https://www.researchgate.net/publication/331096172_Unexpected_rip_currents_induced_by_a_meteotsunami
Overview
There were a total of 33 drowning incidents the NWS confirmed to be current-related in 2019, with a total of 10 fatalities and 23 rescues, which is near the 10 year average (12 fatalities, 23 rescues). This accounted for roughly 10% of the 99 drowning fatalities reported by the Great Lakes Surf Rescue Project, who tracks drowning statistics for the Great Lakes region. A majority of the current-related incidents (drownings and rescues) occurred on Lake Michigan, which is typical. Figure 1 shows the number of current-related incidents per year since the NWS Great Lakes Current-Incident database began (2002).
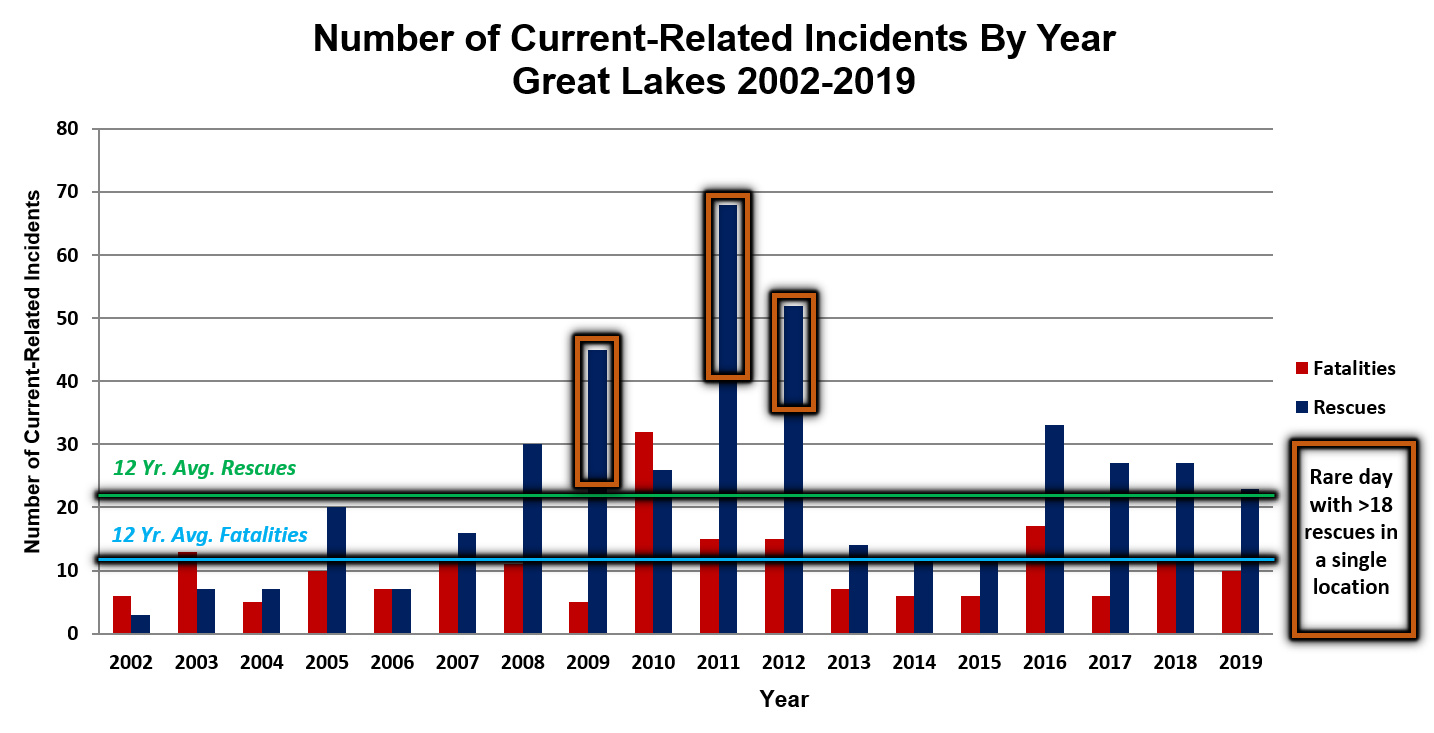
Fig. 1. Current-related incidents from 2002-2019 (GLCID, 2019).
Air and Water Temperatures
A majority of the current-related incidents in 2019 occurred throughout the month of July (Fig. 2, right). Normally we see the incidents peak in late July and early August (Fig. 2, left), but this year we had above average air temperatures in early July and a near average to slightly cooler than average August, especially on Lake Superior (Fig. 3). Water temperatures on Lake Michigan (Fig 4.) increased to above average in the late June and late July/early August time frame, so that may also have influenced beach attendance.
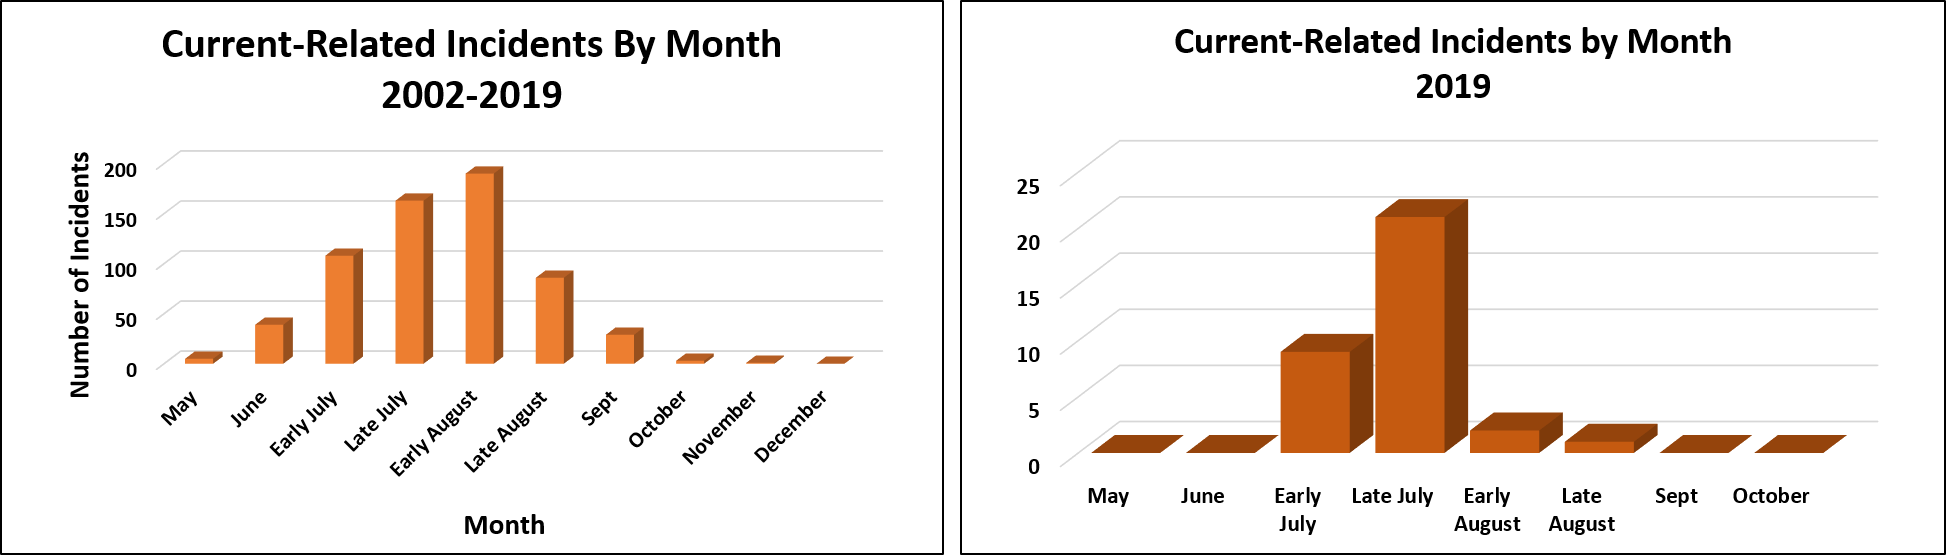
Fig. 2. Left: Number of current-related incidents by month from 2002-2019. Right: Number of current-related incidents by month for only 2019. Most incidents occurred in early to late July (GLCID, 2019).
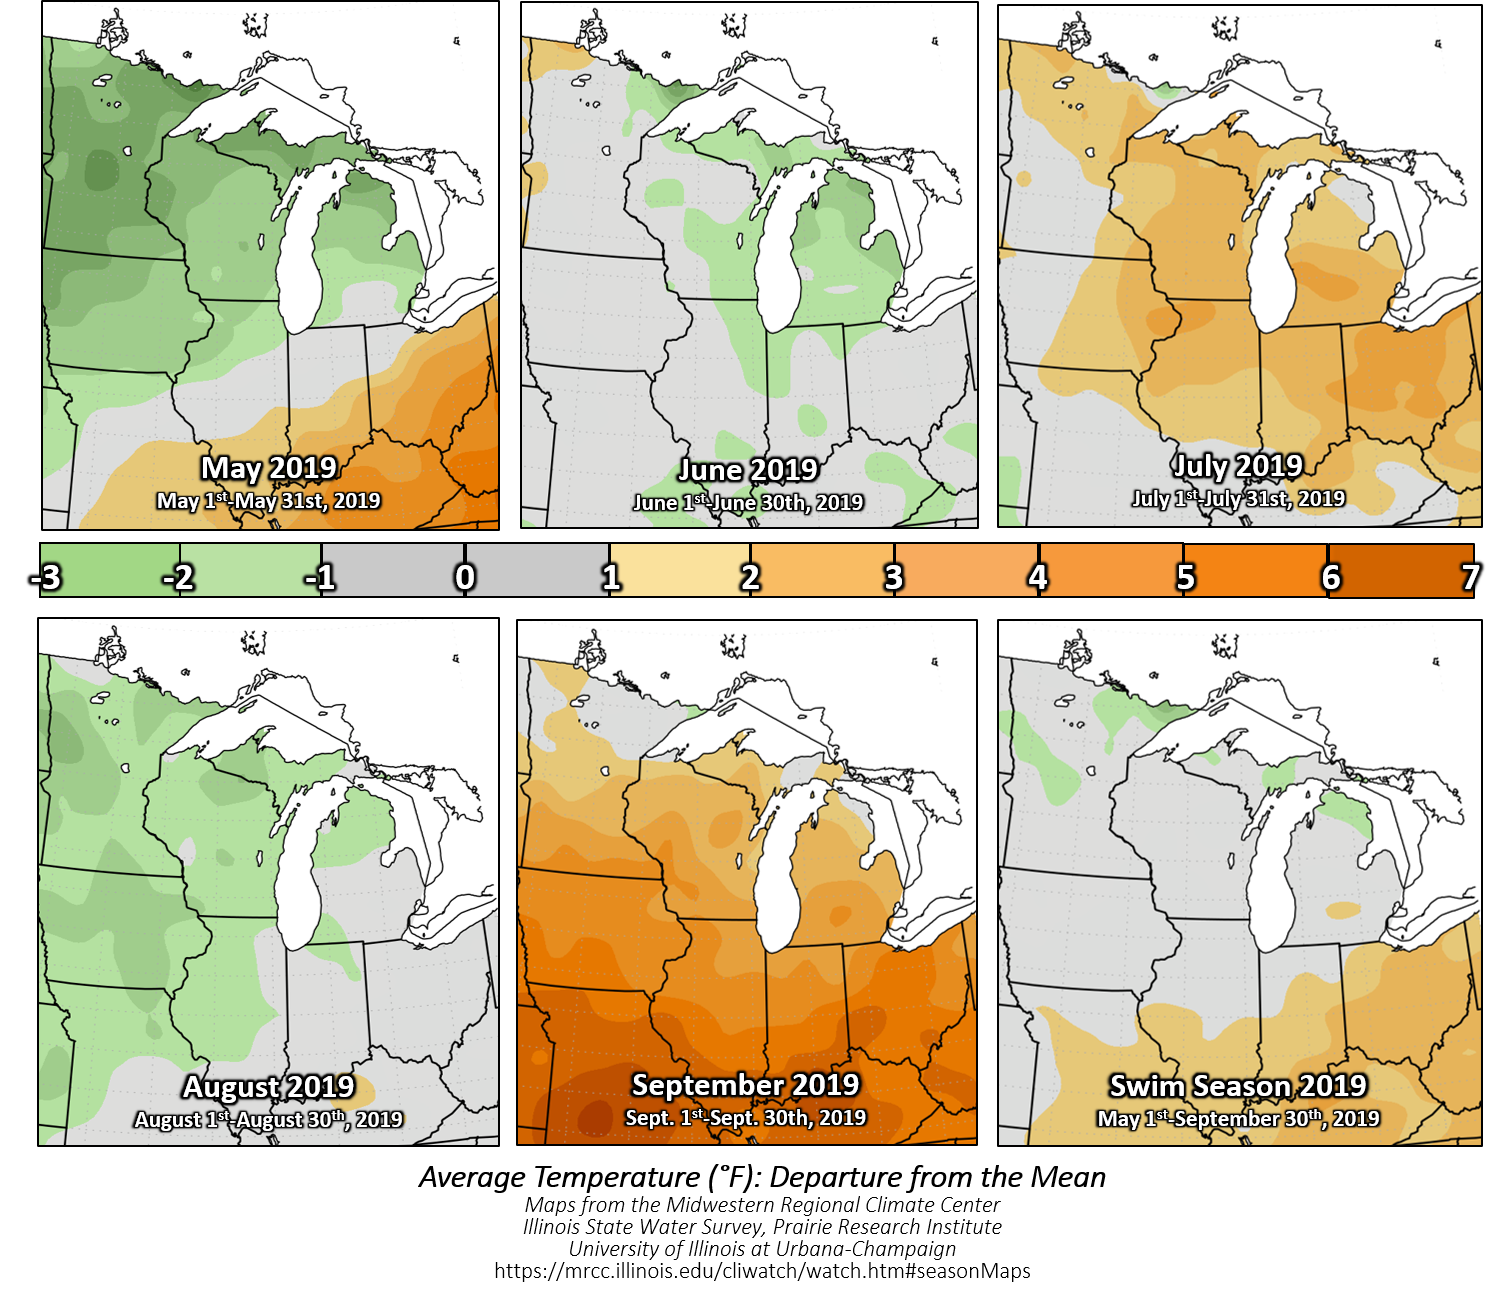
Fig. 3. Average Temp (F) Departure from the Mean by Month, and by Swim Season (May-Sept), 2019. Image from MRCC.
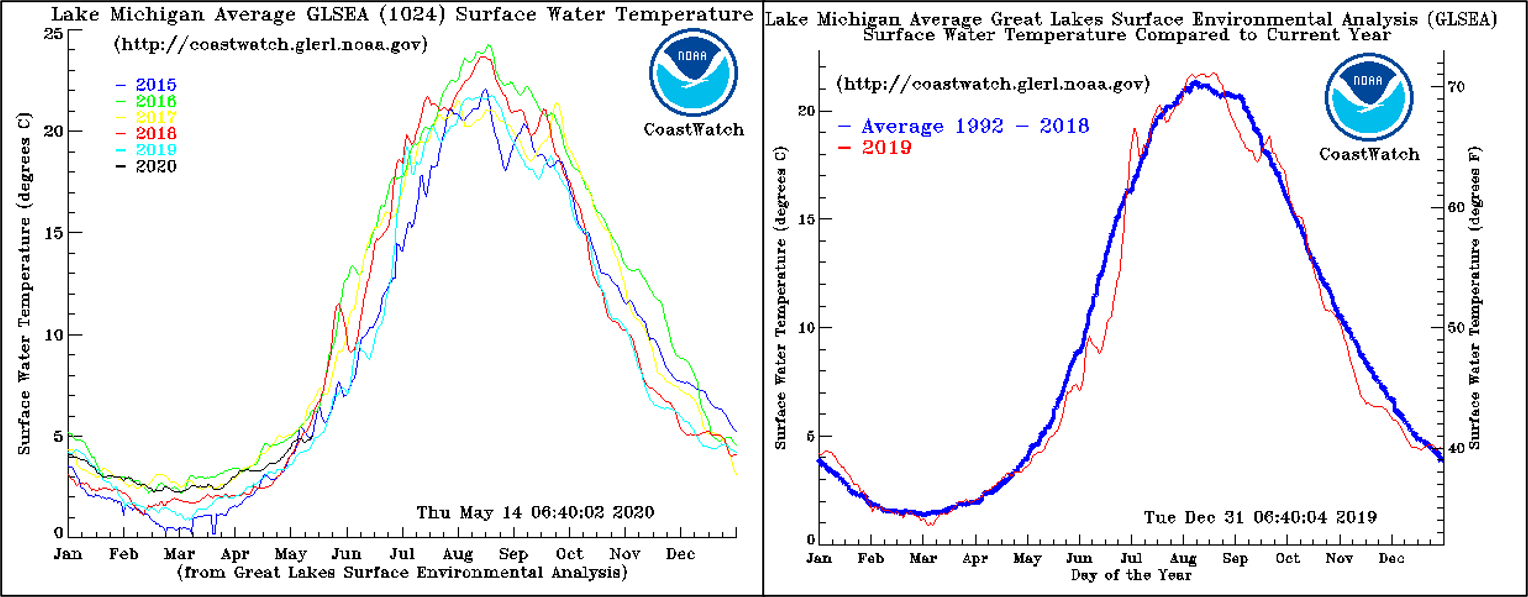
Fig. 4. Lake Michigan Water Temps (2015-2020 Yearly comparison on left, 2019 vs. 1992-2018 average on the right). Image from GLSEA.
Where Did the Incidents Occur?
A majority of the 2019 current-related incidents occurred in Lake Michigan, followed by Lake Erie (Fig. 5). The state with the greatest number of incidents was Michigan (Fig. 6). This is comparable to previous years, with Lake Michigan (and the state of Michigan) often seeing the majority of incidents thanks to tourism, shoreline orientation to the prevailing winds, and current-conducive beach features and conditions (see overview page). A map of confirmed current-related incidents from 2002-2019 is shown in figure 7.
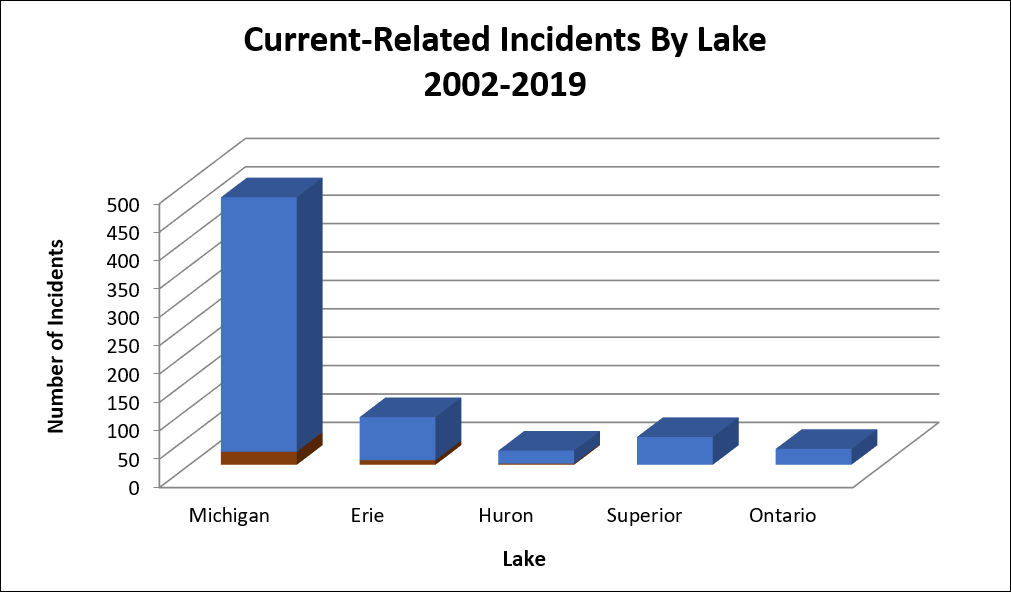
Fig. 5. Current-Related Incidents by Lake 2002-2019. A majority of current-related incidents occurred on Lake Michigan in 2019, which is normal (GLCID, 2019).
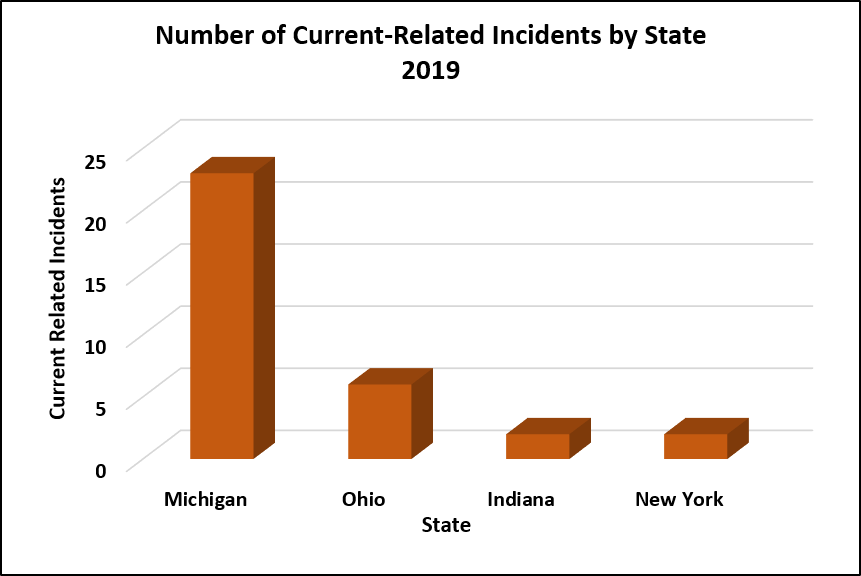
Fig. 6. Current-Related Incidents by State/Province for 2019. A majority of current-related incidents occurred in Michigan (GLCID, 2019).
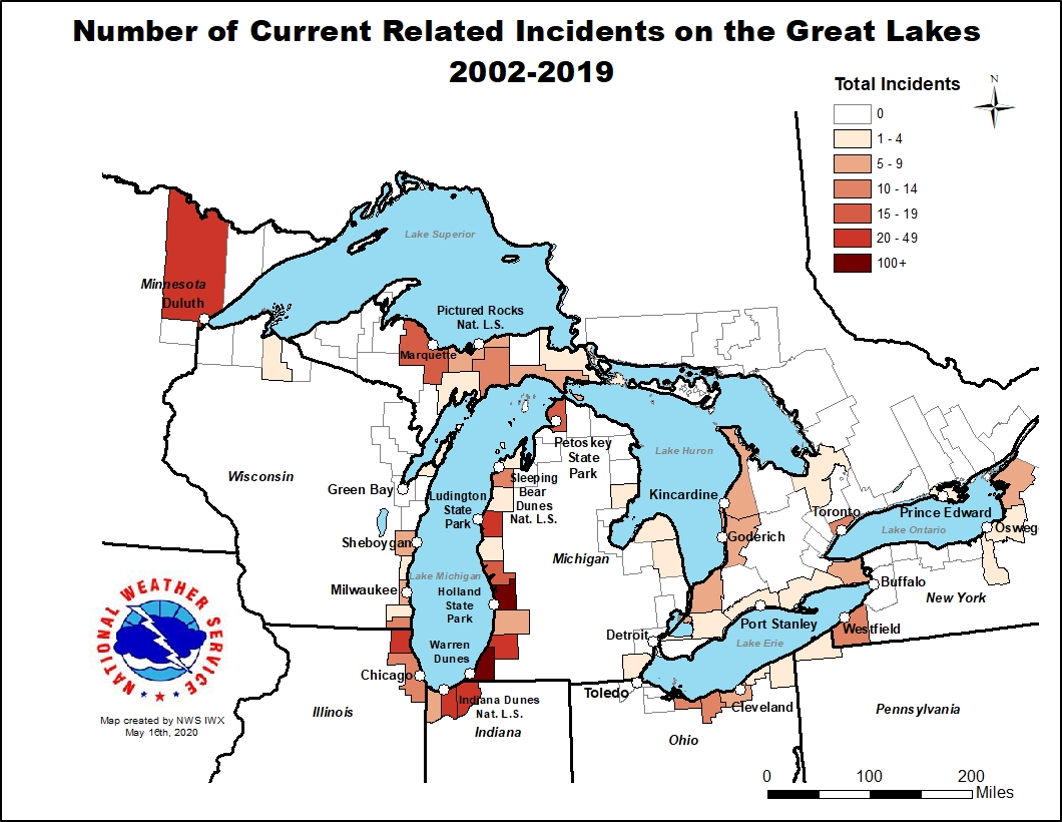
Fig. 7. A map of confirmed Current-Related Incidents from 2002-2019. For an interactive version of this map, visit (this website).
Current Type
Classic rip currents contributed to 43% of the current-related incidents in 2019, and outlet currents were involved in 39% of the incidents (Fig. 8). Usually, a majority of the incidents each year are caused by structural and classic rip currents, but this year there were an abnormally high number of outlet-current related incidents thanks to heavy rains that fell in the month of July, which caused stronger flow out of the rivers into Lake Michigan. Structural currents only accounted for 9% of the total (vs. the usual 40-50%).
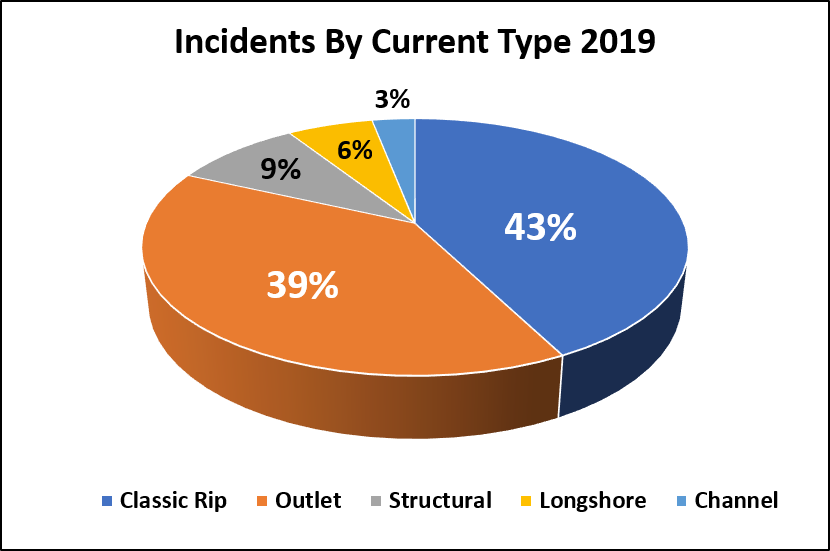
Fig. 8. 2019 Current-Related Incidents by Current-Type (GLCID, 2019).
Conditions During Current-Related Incidents
Wave conditions we know are favorable for dangerous currents include: direct, onshore wave approaches relative to shore (with a greater variety of currents present at beaches with additional features like breakwalls and river outlets), wave heights of 3 feet or greater, and long wave periods (the time between each passing wave, measured in seconds). Other factors, like water level fluctuations (seiches, meteotsunamis) can lead to current development or a strengthening of existing currents. These factors are reviewed below.
Wave Heights
As is typical, wave heights were observed to be 3 feet or greater during 67% of current-related incidents (Fig. 9, left). Most (11) of the classic rip current incidents in 2019 occurred once wave heights were 3 feet or greater (Fig. 9, right), which is expected. In one of the classic rip current cases where waves were 2 feet or less, waves were decreasing from an earlier high wave event. Most of the cases where the wave heights were 2 feet or less this season occurred near river outlets, shoreline structures (pier or breakwall), or a shallow sandbar connecting two land features. This is why water safety experts recommend that beachgoers not swim in these areas: because the currents are always present in some form, even during seemingly benign conditions.
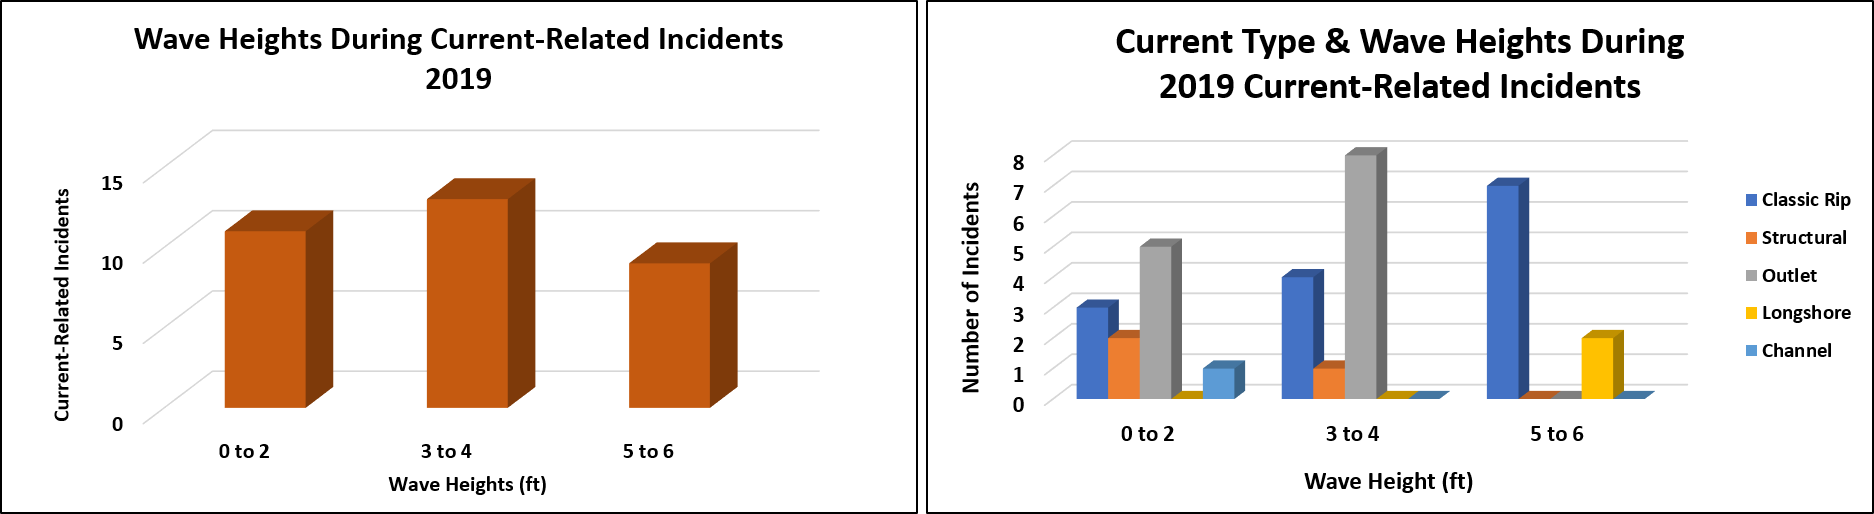
Fig. 9. Left: Wave Heights during 2019 Current-Related Incidents. Right: Wave Heights during 2019 Incidents-Classified by Current-Type (GLCID, 2019).
Wave Angle of Approach
When waves approach the shoreline directly (at a 90 degree angle), water is able to ‘pile up’ more efficiently, making dangerous currents more likely (especially classic rip currents). The strongest longshore currents and structural currents are usually observed at more oblique angles, ranging from 30 to 59 degrees (longshore current speed is maximized at 45 degrees). At lesser angles, structural currents and longshore currents are most likely-especially at beaches with shore-parallel sandbars. Shore-parallel sandbars have been shown to increase the longshore current speed. During the 2019 season, 43% of incidents occurred with a 60 to 90 degree wave angle of approach (Fig. 10). There were an unusually high number of incidents that occurred with a less than 30 degree angle of approach (shore parallel), but a majority of those incidents were because of rain-enhanced river flow from an outlet, which can act independently of wave factors like the angle of approach (Fig. 11).
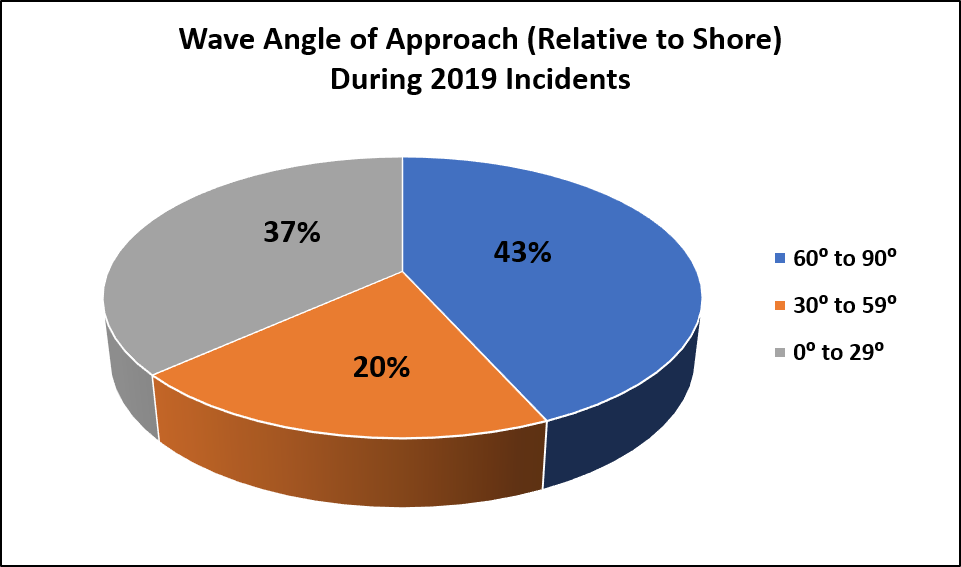
Fig. 10. Wave angle relative to shore for the 2019 Current-Related Incidents (GLCID, 2019).
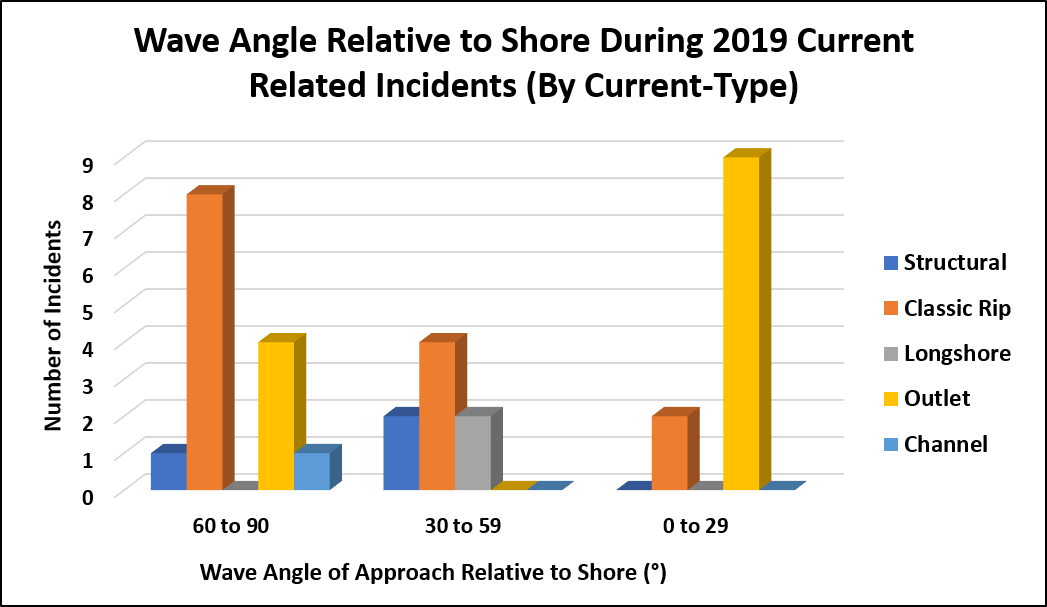
Fig. 11. Wave angle of approach relative to shore during the 2019 current-related incidents, classified by current type (GLCID, 2019).
Wave Period
Water is able to ‘pile up’ more efficiently with longer wave periods (time between each passing wave), making dangerous currents more likely (especially classic rip currents). The average wave period on the Great Lakes is 4 seconds. During the 2019 season, wave periods observed during 85% of the current-related incidents were 4 seconds or greater (Fig. 12). This is comparable to the 2002-2018 data.
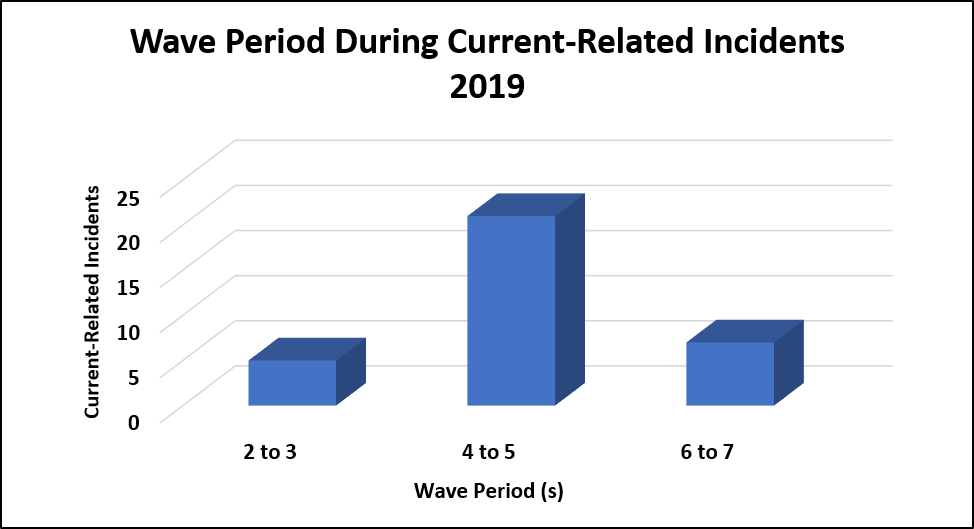
Fig. 12. Wave Period during Current-Related Incidents in 2019 (GLCID, 2019).
Weather Pattern
The 2002-2018 data indicates that the passage of a cold front is the most commonly observed weather pattern during current-related incidents on the Great Lakes. The 2019 swim season differed from the norm, with 58% of incidents occurring with onshore flow due to a surface high pressure system, and only about 15% were correlated iwth a cold front (Fig. 13).
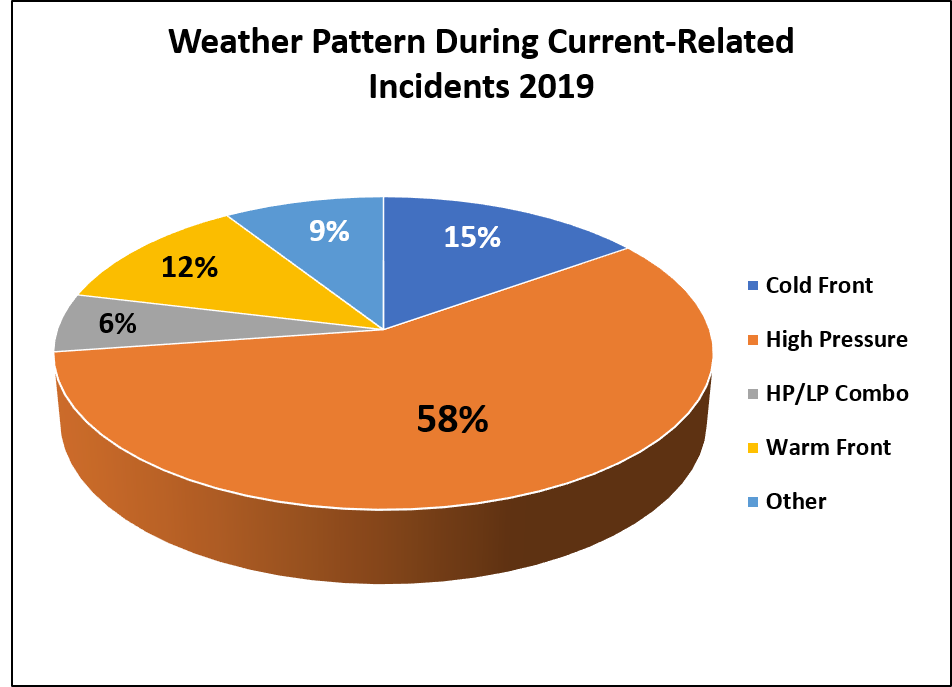
Fig. 13. Weather Pattern during Current-Related Incidents in 2019. HP/LP indicates high pressure/low pressure combination(GLCID, 2019).
Victim Demographics
A majority of the victims involved in current-related incidents during the 2019 season were male (Fig. 14), with roughly half living within 100 miles of the beach where they drowned (Fig. 15). The age of the victims varied, with most between the ages of 10-40 years old (Fig. 16).
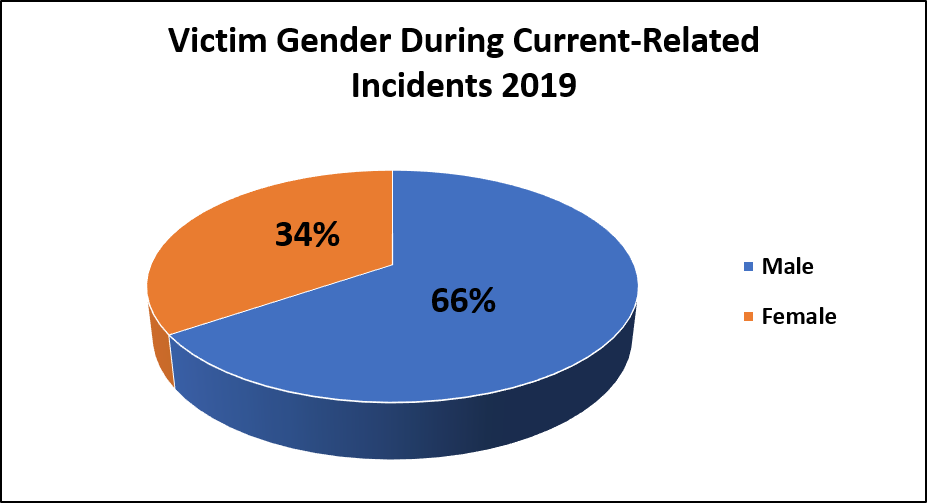
Fig. 14. Gender of victims involved in current-related incidents during the 2019 Swim Season. Unfortunately, we were unable to obtain information on the victims gender in 29 of the 33 cases (GLCID, 2019).
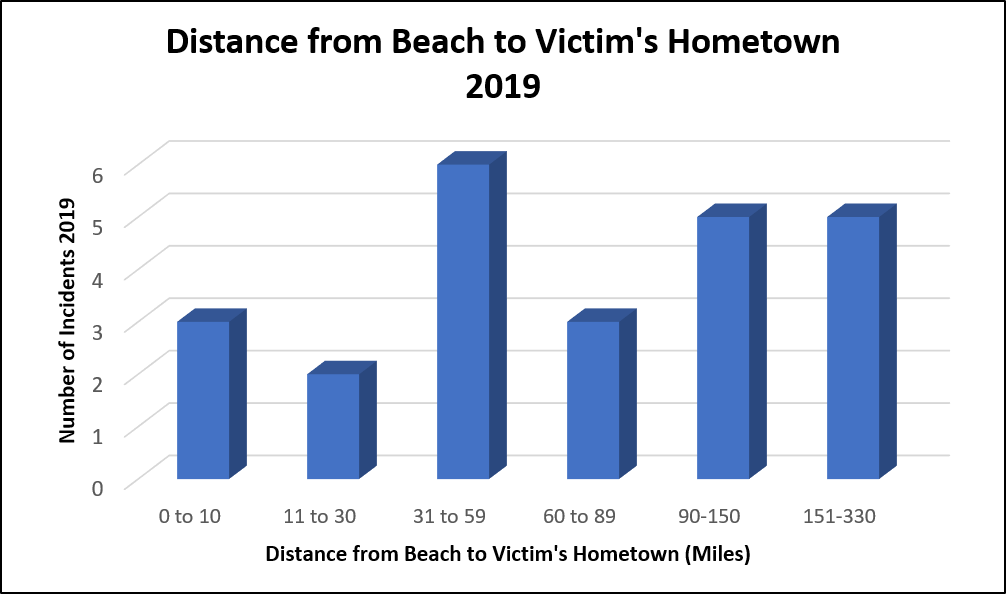
Fig. 15. Distance from Beach to Victims Hometown for current-related incidents 2019. Unfortunately, we were only able to get data on the victim's hometown in 24 of the 33 cases (GLCID, 2019).
The age of the victims varied, with most between the ages of 10-40 years old (Fig. 16). Unfortunately, we were only able to get data on the victim's age in 27 of the 33 cases (GLCID, 2019).
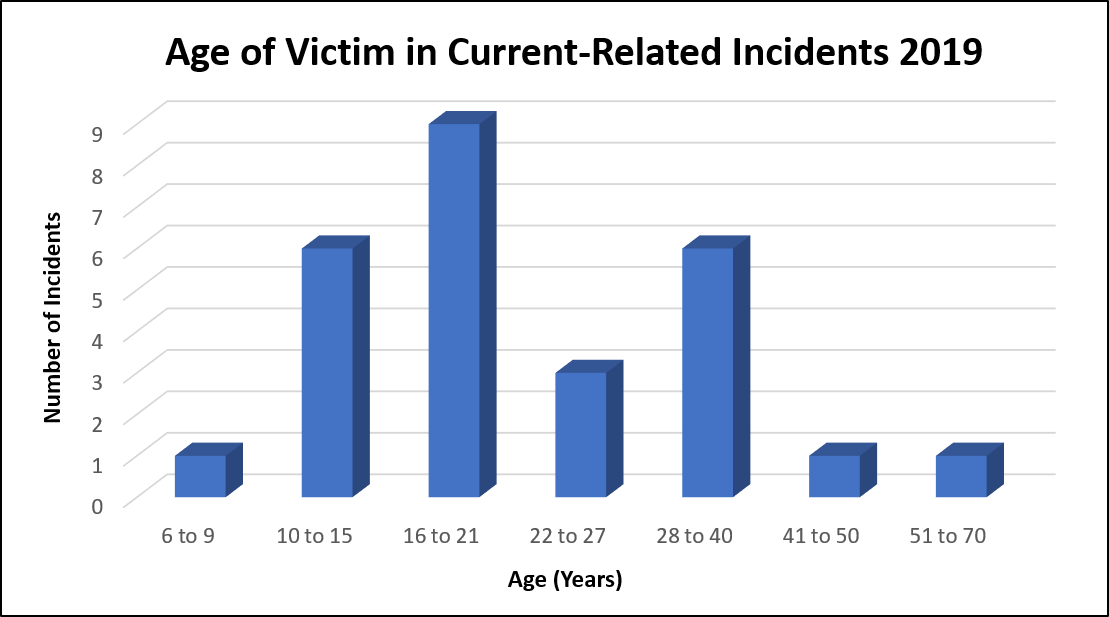
Fig. 16. Age of the victims involved in current-related incidents during the 2019 swim season. We were only able to get information about the victim’s ages in 27 of the 33 cases (GLCID, 2019).
There were 10 victims who were "would be rescuers"-meaning they attempted a rescue and either drowned themselves or ended up needing rescue along with the one they were attempting to save.
Summary
In summary, 2019 was a slightly below average year in terms of current-related fatalities and an average year for rescues. Statistics for the 2002-2019 data can be found on the “About” page (left on the orange tabs at the top of this page). If you’d like to see details on the individual incidents, you can search the GLCID here.
If you know of a current-related rescue or drowning that is not included in the 2002-2019 data, please fill out this form. This will send megan.dodson@noaa.gov a direct email with the information needed to add it to the database. If you have any corrections or missing information about an incident already in the database, just send a direct email to Megan.
Thank you to those who provided data for the Great Lakes Current Incident Database during the 2019 swim season. The data helps us to get a handle on the weather and water conditions present during incidents, and hopefully fulfill our mission of protecting lives (and ending drowning on the Great Lakes).
References and Resources
Great Lakes Current Incident Database (GLCID, National Weather Service, 2019). http://www.miseagrant.umich.edu/dcd/dcdsearch.php
Great Lakes Environmental Research Center (GLERL/GLSEA, 2019): https://coastwatch.glerl.noaa.gov/statistic/
Great Lakes Surf Rescue Project (2020): https://www.glsrp.org
Great Lakes Water Safety Consortium (2020): Get involved: https://greatlakeswatersafety.org/
Meadows, G.A., Meadows, L.A., Wood, W.L., Hubertz, J.M., & Perlin, M. (1997): Journral Ametsoc.
Midwestern Regional Climate Center (MRCC, 2018):https://mrcc.isws.illinois.edu/cliwatch/watch.htm#
Michigan Sea Grant (2020):https://www.dangerouscurrents.org
NWS Beach Forecast Page: https://www.weather.gov/greatlakes/beachhazards
Additional research on dangerous currents:https://www.weather.gov/iwx/beachpage_references
Linares, Alvaro & Wu, Chin & J. Bechle, Adam & J. Anderson, Eric & A. R. Kristovich, David. (2019). Unexpected rip currents induced by a meteotsunami. Scientific Reports. 9. 10.1038/s41598-019-38716-2. https://www.researchgate.net/publication/331096172_Unexpected_rip_currents_induced_by_a_meteotsunami
Overview
There were a total of 79 incidents confirmed to be current-related in 2020, with 28 fatalities and 51 rescues. This is well above the average of 12 fatalities and 23 rescues per year (Fig. 1a). The Great Lakes Surf Rescue Project, who has kept track of the fatal drowning statistics (regardless of cause) in the Great Lakes Region since 2010, reported 109 drowning fatalities for 2020. This rivaled the record drowning year of 2018, where there were 117 fatalities. Current-related incidents normally account for around 10 to 15% of the total drownings each year, but in 2020 they were confirmed to have played a role in 26% of the 109 drowning fatalities. The graph below (Fig. 1b) compares total drowning fatalities per year via GLSRP to confirmed current-related drowning fatalities in the NWS GLCID. This is a much higher percentage of the incidents observed each year since since 2010, which was the year with the most current-related fatalities since the GLCID began in 2002 (Fig. 1a).
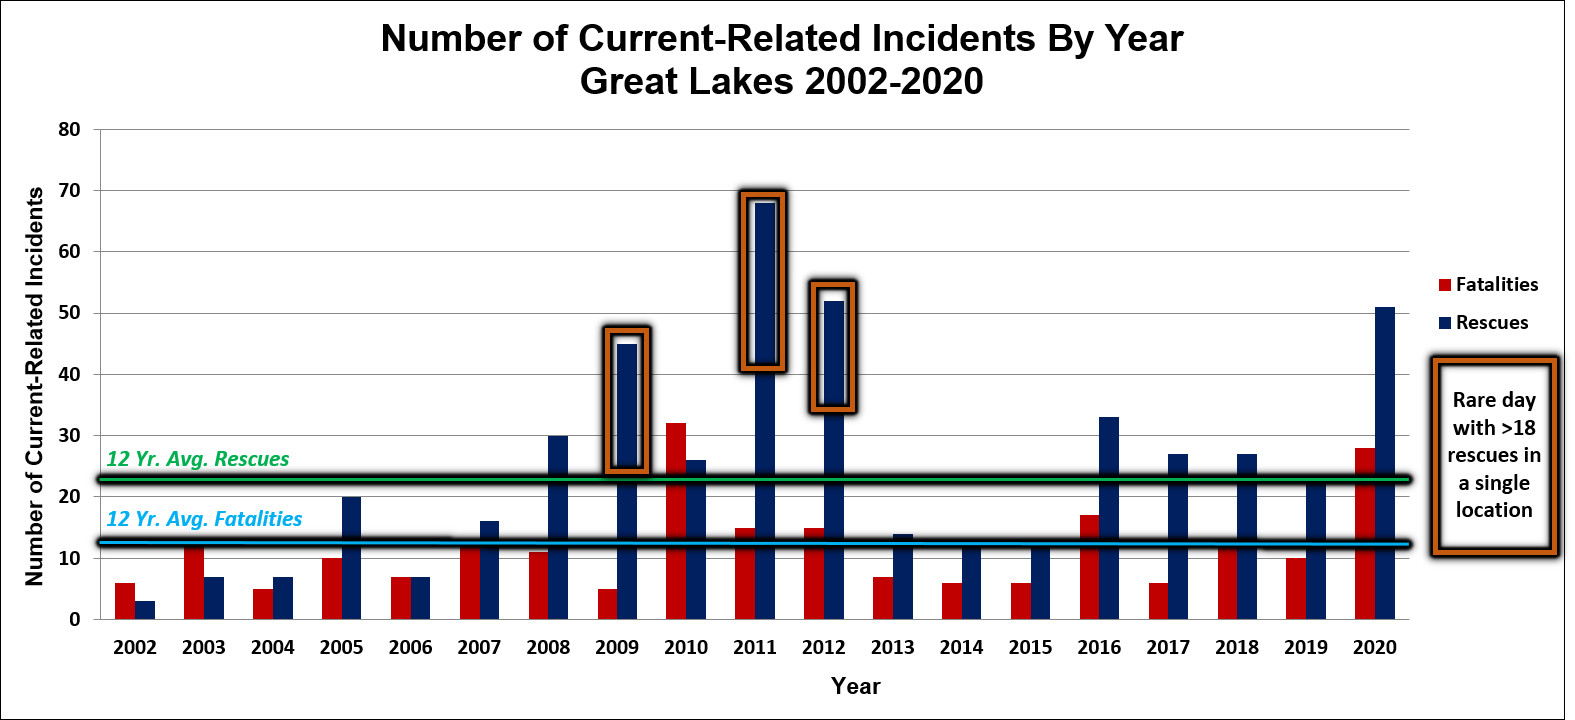
Fig. 1a. Current-related incidents from 2002-2020 (GLCID, 2020).
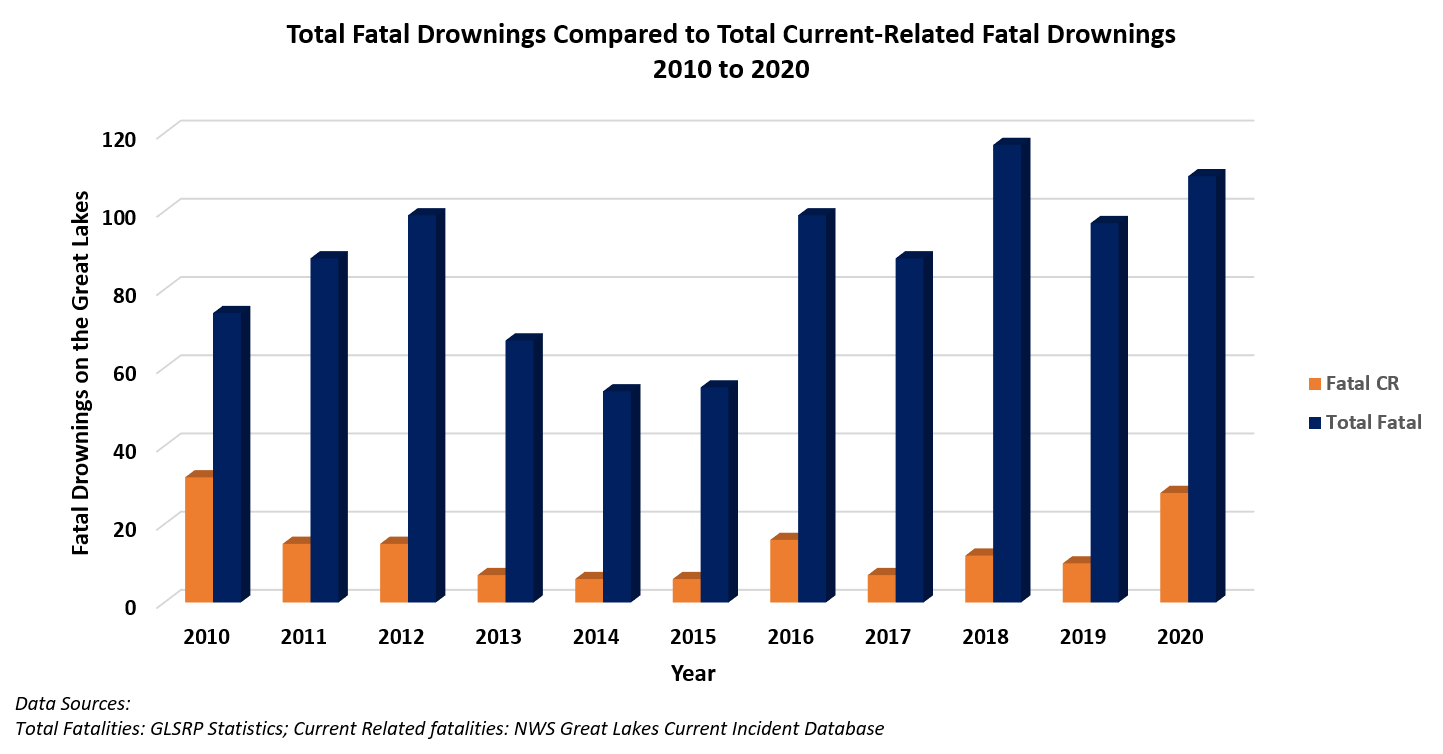
Fig. 1b. All fatal drownings compared to confirmed current-realted incidents on the Great Lakes from 2002-2020 (GLSRP, GLCID, 2020).
2020: The Year of Chaos: The Pandemic, Heated Politics, and Risk Taking
The COVID-19 Pandemic posed a unique challenge during the 2020 beach season, and likely played a role in increasing beach attendance and thus the total number of incidents. The pandemic began just prior to the 2020 swim season(technically defined as being from Memorial Day to Labor Day), so there were orders mandating mask wearing, social distancing, business and school closures or limitations, and quarantines from roughly March and continuing through the season. Travel for vacation was limited or cancelled all together, as well as many other traditional indoor and outdoor entertainment sources like concerts or going to the movie theater. There were quite a few beaches that completely closed, forcing people to swim elsewhere, or beaches that greatly reduced or removed beach staff and lifeguards due to budget constraints and out of concern for the staff getting COVID-19 (human contact like what occurs in a water rescue and CPR pose a greater COVID-19 risk). On an individual level, while we can only speculate, I would argue that the high stress levels experienced by people prior to and during the swim season from both the pandemic and the intense political climate in the US (upcoming presidential election, riots, etc.) drove people to seek out a stress free environment. Most Great Lakes residents, this Michigander included, would probably agree that visiting your favorite Great Lake provides an excellent opportunity for peace and rest. Sociological studies have shown that people tend to take more risks when they are on vacation, or even when they are bored or depressed. Before the swim season even began, people were getting cooped up in the house and not able to travel like normal. They might have gotten COVID-19, or lost someone close because of it. While I can't prove this with data, it seems reasonable to assume that levels of depression, anxiety, and boredom were especially high before and during the swim season 2020. If true, this would have played a role in the greater number of incidents, in addition to the fact that people were possibly swimming in unguarded and unusual locations, like jumping off harbor walls. However, more people at the beach doesn't always mean there are more people in the water, nor does it guarantee that if they go into the water or take a dangerous risk they will need rescue or drown. In part, it depends on the individuals swimming ability and their knowledge/experience in the water, whether the state of the lake is calm or dangerous at the time, what water safety measures that particular community or beach has implemented (signage, beach flags, rescue equipment, lifeguards, etc), and how lucky they are (it is not uncommon for a surfer, kayaker, or other swimmer to notice a person is struggling and rescue them before it's too late). On top of the abnormal sociological factors involved in the 2020 beach season, we know that the weather conditions and water temperatures also play a huge role in beach attendance. If warmer air and water temperatures are accompanied by gusty winds and waves of 3 feet or greater, the risk of an incident goes up even more. These other factors are discussed in detail below.
Air and Water Temperatures
Typically we see a higher number of incidents when air and water temperatures are above average for the season because it draws people to the beach, and this was likely the case in 2020. Water temperatures on Lake Michigan were average to above average through the swim season, particularly in early July (Fig 2). In fact, water temperatures rivaled those of the 2010 season where we had record warm water temperatures and the highest number of current-related fatalities since the GLCID began in 2002 (32 fatal). Similarly, water temperatures in 2018 were also well above average, similar to 2020, and it is the year GLSRP had the greatest number of fatalities from all hazards (117 fatalities). For comparision, the graph shows the cold water temperatures during 2013, which was a year with below normal fatalities (67 total fatalities, 7 current-related).
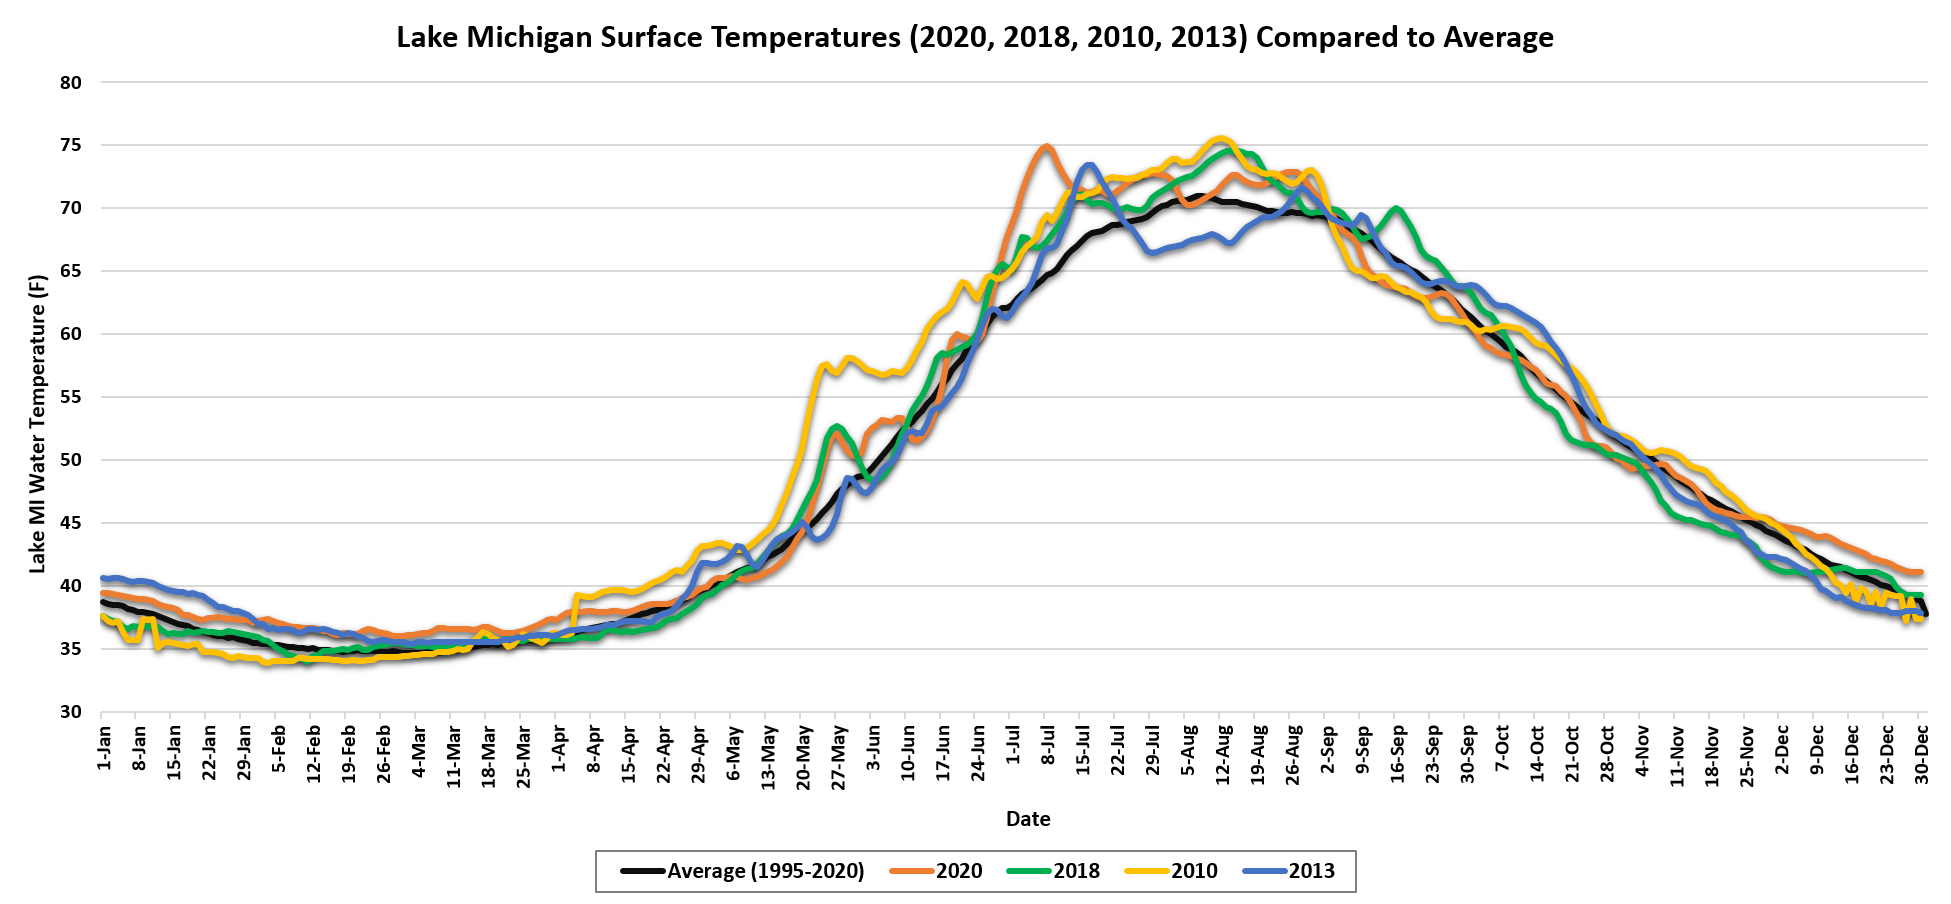
Fig. 2. Lake Michigan Water Temperature 2020 Vs. Average vs. Select Years. Image from GLSEA.
Air temperatures were 2 to 3 degrees above the mean during the summer of 2020, with the lower lakes seeing them continue into the fall season (Fig. 3). A majority of the current-related incidents (both fatalities and rescues) occurred in late July and late August this year, which is fairly typical compared to the longer term trends (Fig 4). Normally we see the incidents increase through early August, then drop down as people return to school in late August/early September and the air and water temperatures begin to cool, however this year we saw a drop in early August. Whether or not we have an incident really depends on whether the high beach attendance occurs at the same time that the weather and water conditions are conducive to dangerous current development, in addition to the individual and community risk factors described above. The slight variability from our usual trend in incidents for 2020 likely stems from the variation in the water conditions and local temperatures through the month (vs the overall monthly trends).
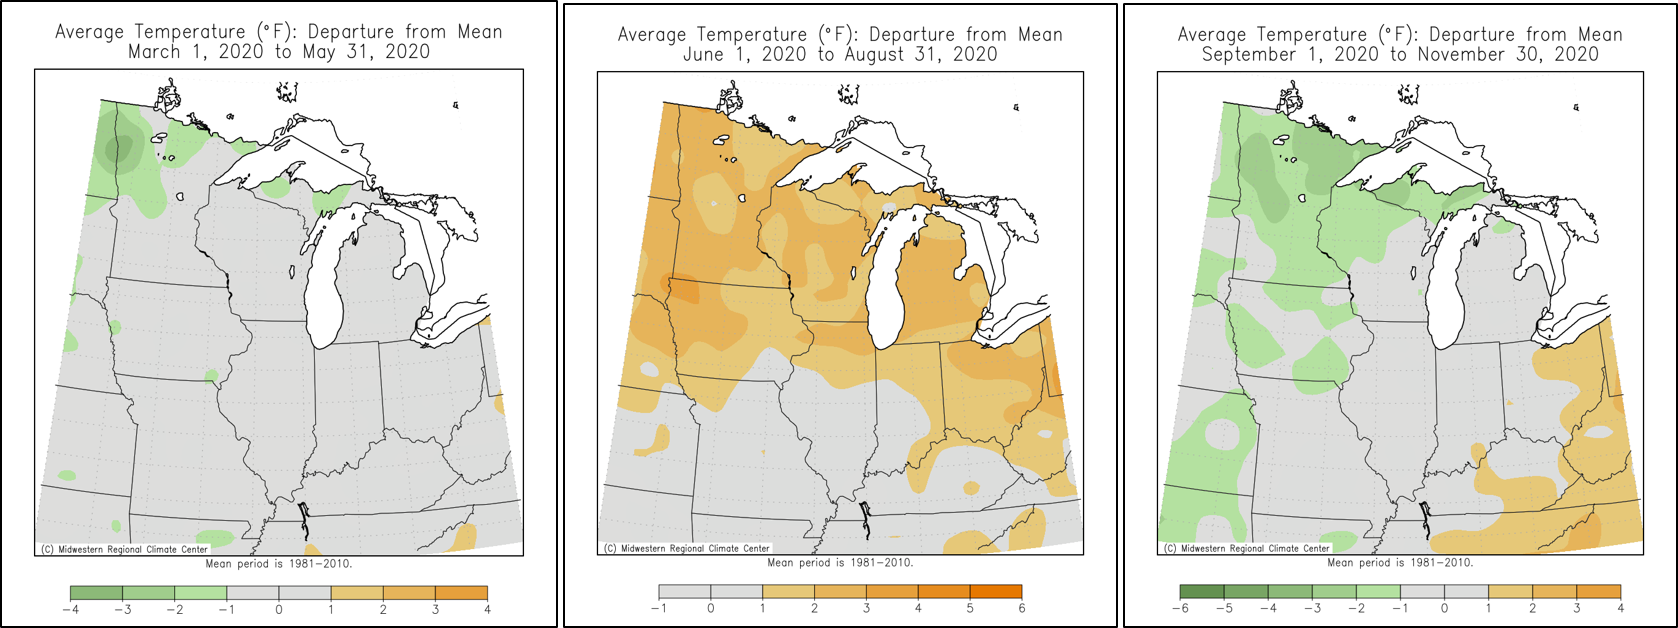
Fig. 3. Average Temp (F) Departure from the Mean by Season in 2020. Image from MRCC.
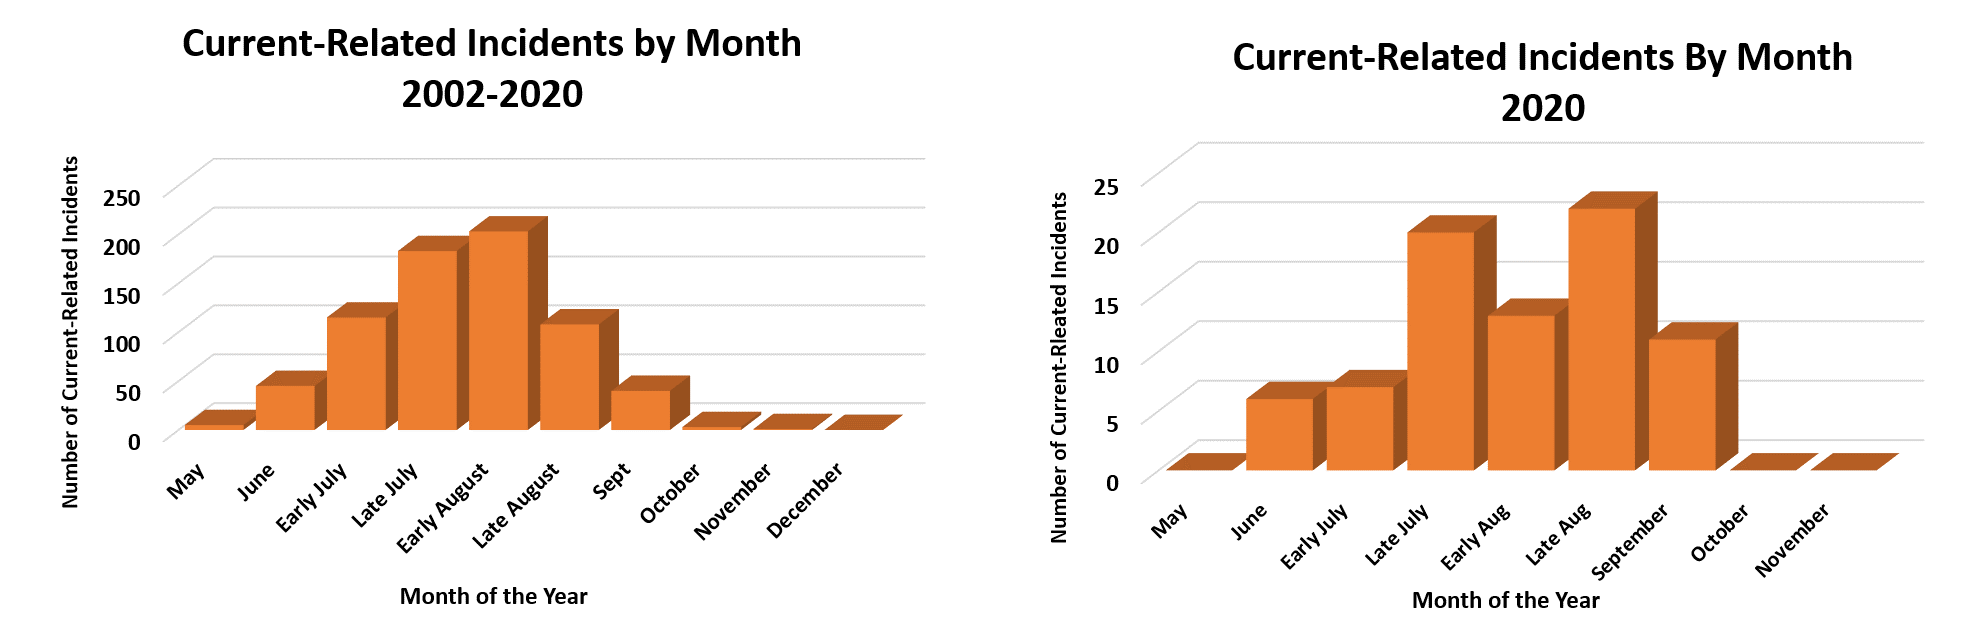
Fig. 4. Current-related incidents by month (2020 left, 2002-2020 right).
For example, in the Holland, Michigan area, normal high temperatures for July and early August are in the low 80s, then drop into the upper 70s from late August to early September. In 2020, Holland, MI recorded high temperatures in the mid to upper 80s and 90s for a large portion of July, and then again in mid to late August (Fig. 5). There was a brief "cool down" the first week of August with highs in the low 80s falling into the low to mid 70s for a couple days. Otherwise, air temperatures remained warm (near to above average) through early September. The incidents followed a similar trend with a dip in early August (unusual) and another bump up in mid-late August. In early September, the temperatures were cooler yet still near to above average, so warm air temperatures and Labor Day holiday traffic likely increased beach attendance. Unfortunately, hazardous water conditions were also present and we saw a bump in the number of incidents.
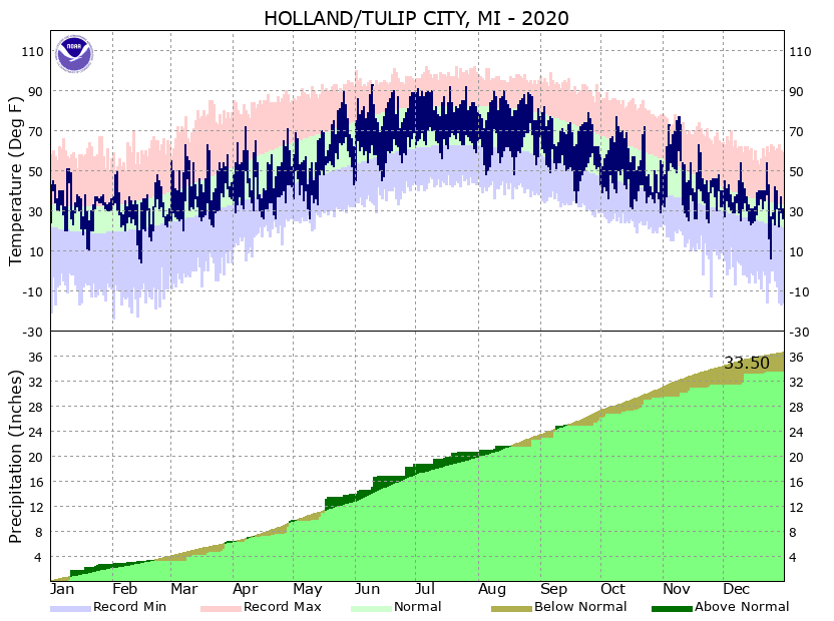
Fig. 5. 2020 Temperatures Relative to Average in Holland, MI. Image from NWS GRR Climate.
Sky Cover and Precipitation
We also tend to see greater beach attendance (and usually more incidents) when there is less cloud cover and preciptiation, but these are secondary or even tertiary factors when compared to air/water temperatures and water conditions. Beach attendance appears to fluctuate more based on the timing of when cloudy and rainy conditions are present. For example, a day that starts out cold with heavy rain that continues through early afternoon may deter people from considering the beach or swimming as an option that day, and they may decide to make other plans. However, if the day starts out warm and muggy with partly cloudy skies, people may go to the beach and even stay once rain and cooler temperatures arrive later in the day because they already made the trip out and may be reluctant to leave. If you're already swimming, a little bit of rain with cloudy skies and air temperatures in the 60s doesn't really matter so long as the water is warm. As far as cloud cover goes, 39% of current-related incidents in 2020 occurred when skies were clear to mostly clear, and 56% occurred when skies were partly to mostly cloudy. Only 5% occurred with cloudy skies. As far as precipitation goes, 91% of the current-related incidents in 2020 occurred when it was dry. Overall, 2020 was a dry summer for many locations around the Great Lakes (Fig. 6), with the accumulated precipitation from June to August 2020 below average for southwest Lower Michigan (tourist hot spot so usually see the most incidents there), and in IL/IN/OH. The US Drought Monitor issued in late July 2020 (Fig. 7) showed those locations in addition to parts of PA/NY in abnormally dry or moderate (D1) to severe drought (D2).
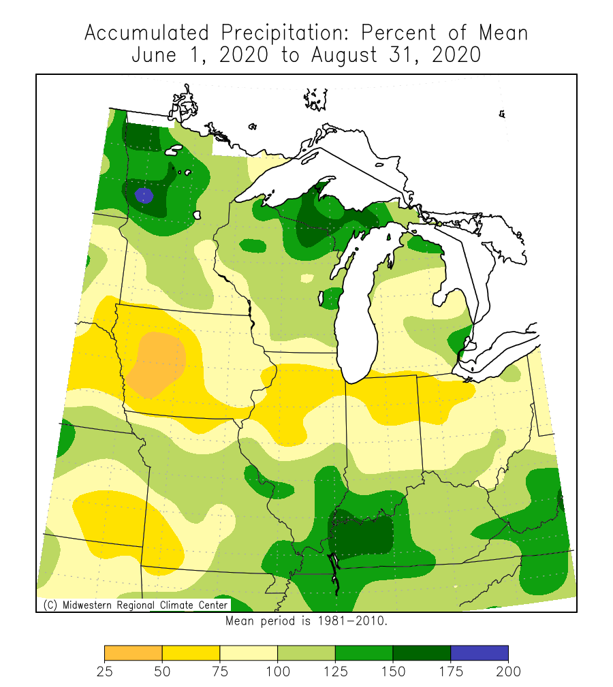
Fig. 6. Precipitation for the 2020 summer season: Percent of mean. Image from MRCC.

Fig. 7. 2020 Drought Monitor from July 28th, 2020. Image from US Drought Monitor.
Water Levels
In 2020, we saw record-high water levels on the Great Lakes (Fig. 8) shows Lake Michigan-Huron water levels for 2019-May 2021). Higher water levels on the Great Lakes in general have been known to cause an increase in drowning fatalities and rescues (all other factors considered equal). For example, water is more likely to wash over the pier and take those walking or fishing off the pier into the water. However, exactly how the longer-term water levels impact current development is a bit more mysterious. Researchers in the Great Lakes have traditionally thought it to be more favorable for increased current activity because dangerous currents are more likely when water accumulates (or 'piles up') near the beach. When water levels are high, there is an increased volume of water near the beach. On the short term water level side of things, low tides (vs high tides) on the ocean increase current strength and likelihood of development as water recedes from the beach leaving a wider surf zone and less distance between the top of the sandbar and the surface of the water (meaning current strength in channels would be stronger). Certainly seiches and meteotsunamis have a similar effect on current development the Great Lakes as tides do on the ocean, but they are more of a short lived event (hours to days) versus long term water level increases like we saw in 2020. The long term water levels from 1918 to 2021 for Lake Michigan-Huron is below (Fig. 9). While we saw a greater number of incidents in 2020 when water levels were well above their monthly mean level, we saw an even higher number of current-related fatalities in the year 2010 (mostly on Lake MI) but the levels were below the monthly mean. Long story short, it's uncertain how much of a role the increased water levels played in the increased number of current-related incidents in 2020.
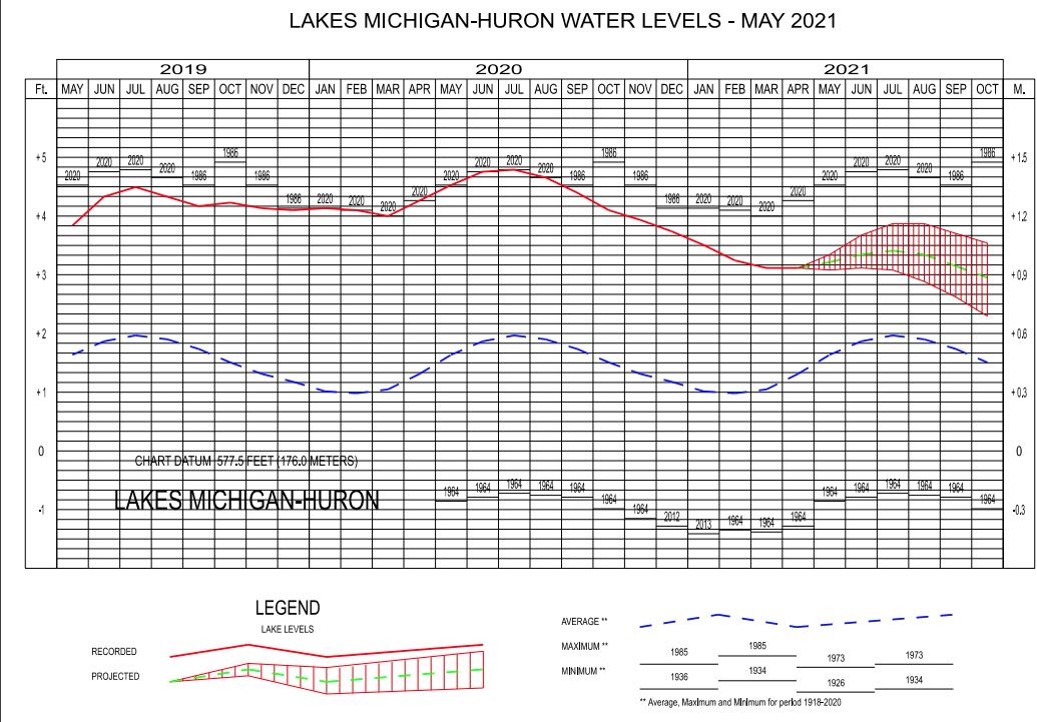
Fig. 8. Lake Michigan-Huron Water Levels 2019-May 2021. Image from USACE.
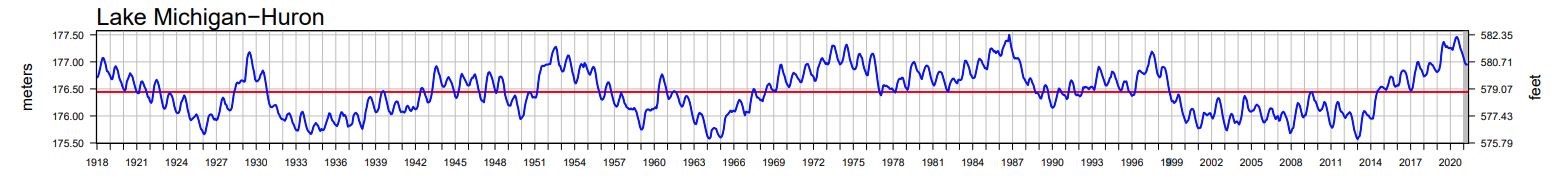
Fig. 9. Long-Term Water Levels for Lake Michigan-Huron. Image from USACE.
Where Did the Incidents Occur?
As is often the case, most incidents occurred on Lake Michigan (Fig. 10) because of the prevailing westerly winds, favorable beach features, and high tourism. Michigan was the state that saw the majority of current-related rescues and fatalities, with Ontario following close behind (Fig. 11). Since data collection for the GLCID began, it has been a struggle to get specifics on Canadian incidents, so the number of confirmed current-related incidents from Ontario was limited in previous years. However, in 2020 we were able to closely collaborate with a few of the beaches in Ontario and get confirmation of current involvement for several rescues and fatalities. This likely inflated the number of incidents in 2020, in combination with the other factors described in this summary. We plan on coordinating with a few beaches in Ontario that keep records of fatalities and rescues to improve the 2002-2019 data gaps in the GLCID where possible. One final note is that there were a greater number of days with west and southwest wind and wave directions, which often cause a greater number of incidents on the Canadian sides of Lakes Huron, Erie, and Ontario.
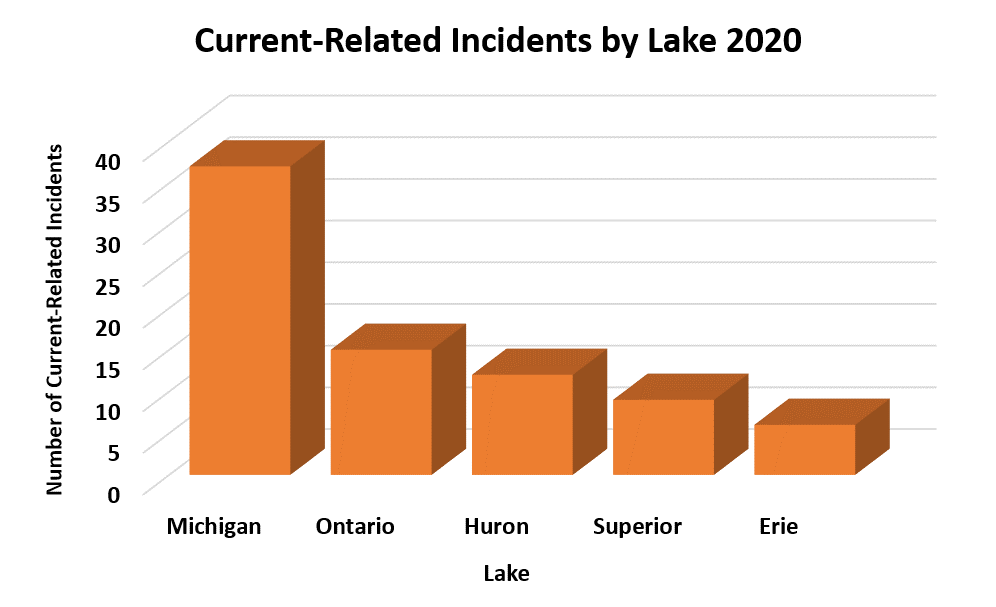
Fig. 10. Current-Related Incidents by Lake 2002-2020. A majority of current-related incidents occurred on Lake Michigan in 2020, which is normal (GLCID, 2020).
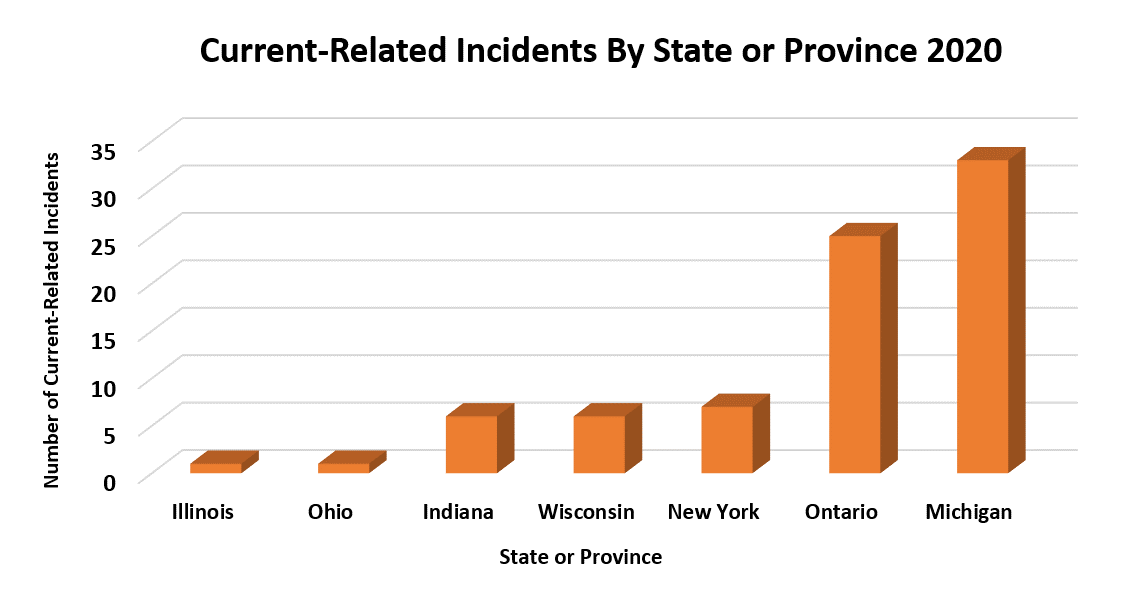
Fig. 11. Current-Related Incidents by State/Province for 2020. A majority of current-related incidents occurred in Michigan, with Ontario close behind (GLCID, 2020).
Current Type
Around 50% of the current-related incidents in 2020 were rip current related, and 34% were structural currents (Fig 12). This is normal, as most of the time the structural and rip currents are the most common currents to cause issues, with 45% of incidents from 2002-2020 attributed to structural currents, and 40% of them contributed to rip currents (Fig. 13).
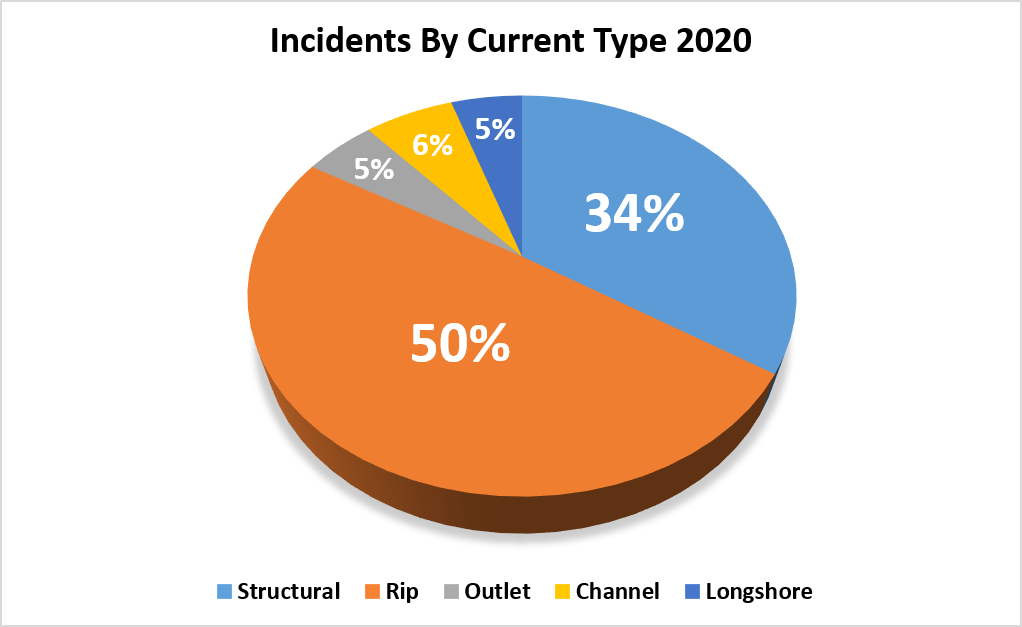
Fig. 12. 2020 Current-Related Incidents by Current-Type (GLCID, 2020).
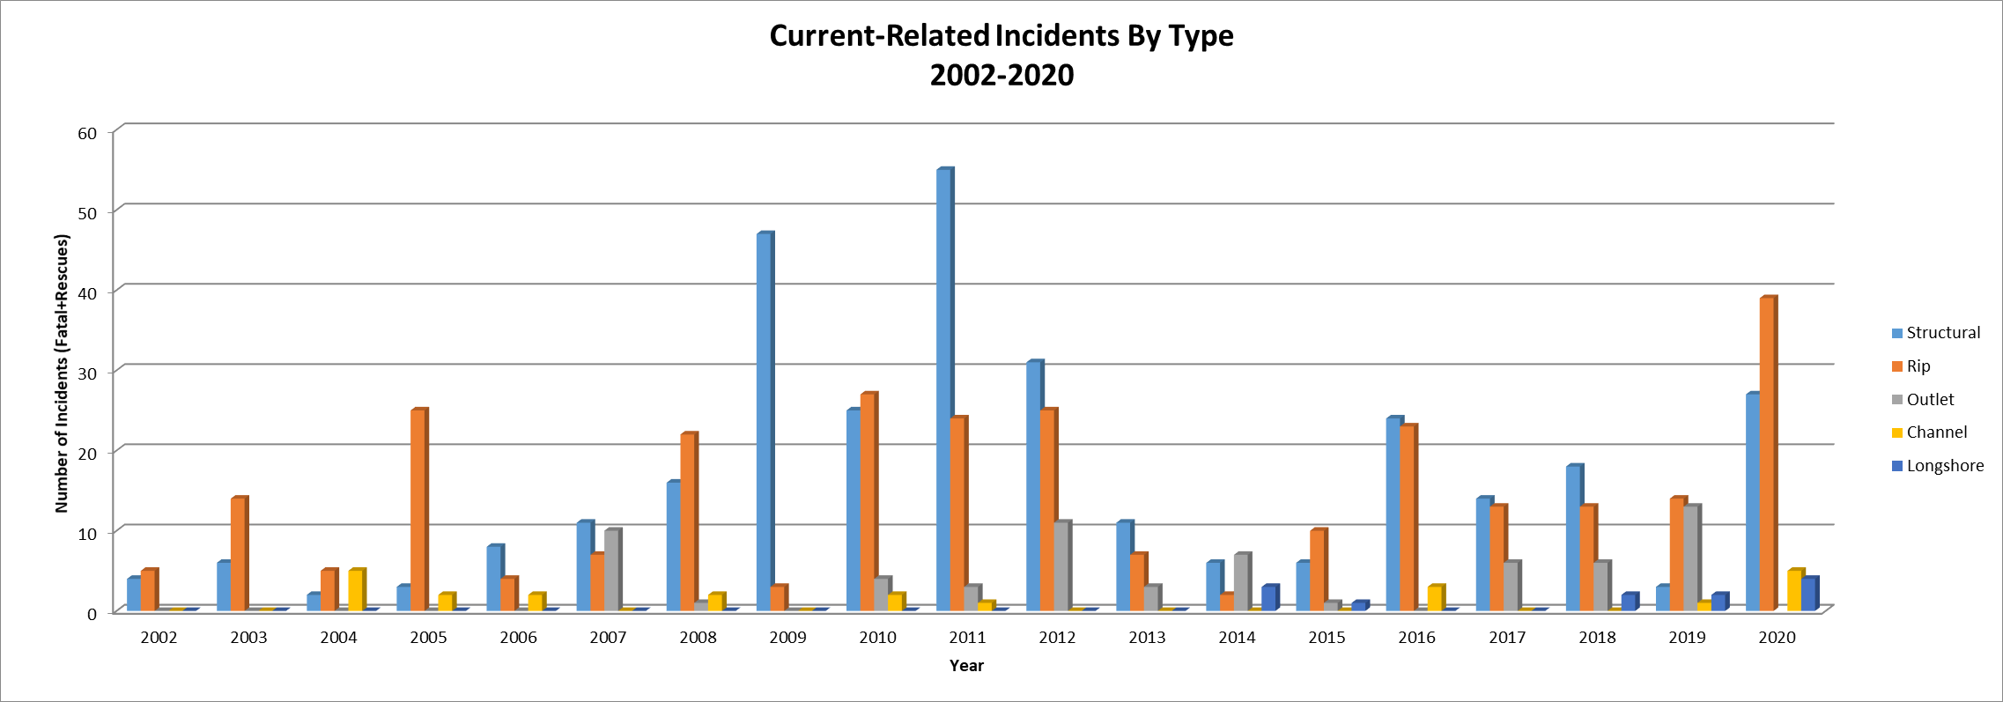
Fig. 13. 2002 to 2020 Current-Related Incidents by Current-Type (GLCID, 2020).
Conditions During Current-Related Incidents
Wave conditions we know are favorable for dangerous currents include: direct, onshore wave approaches relative to shore (with a greater variety of currents present at beaches with additional features like breakwalls and river outlets), wave heights of 3 feet or greater, and long wave periods (the time between each passing wave, measured in seconds). Other factors, like water level fluctuations (seiches, meteotsunamis) can lead to current development or a strengthening of existing currents. These factors are reviewed below.
Wave Heights
Around 84% of current-related incidents on the Great Lakes (2002-2020) occur when wave heights are 3 feet or greater, and this was the case this year. Wave heights during a majority of the incidents were 3 to 6 feet (Fig. 14, left), with a few above and below those thresholds. Most swimmers are intimidated by wave heights of greater than 6 feet, which is why the total number of incidents drops off for the highest wave height ranges (despite the worst conditions as far as waves and current activity go). On the other hand, waves of 3 to 6 feet are not as intimidating for people so they go into the water, but conditions are still conducive to currents, so we see a peak in the incidents. Dangerous currents are still possible with lower wave heights, particularly outlet, structural, and channel currents. This is because despite lower wave heights, water can still pile up near features like breakwalls, river outlets, and tombolos (sandbar connecting an offshore feature to the beach). Though rip currents are possible with lower wave heights, they are stronger and more likely with moderate to high wave action. We saw this in the 2020 data (Fig 14, right) where incidents that occurred with waves of 2 feet or less were either caused by a structural, outlet, or longshore current. Rip currents were more likely as waves increased in height.
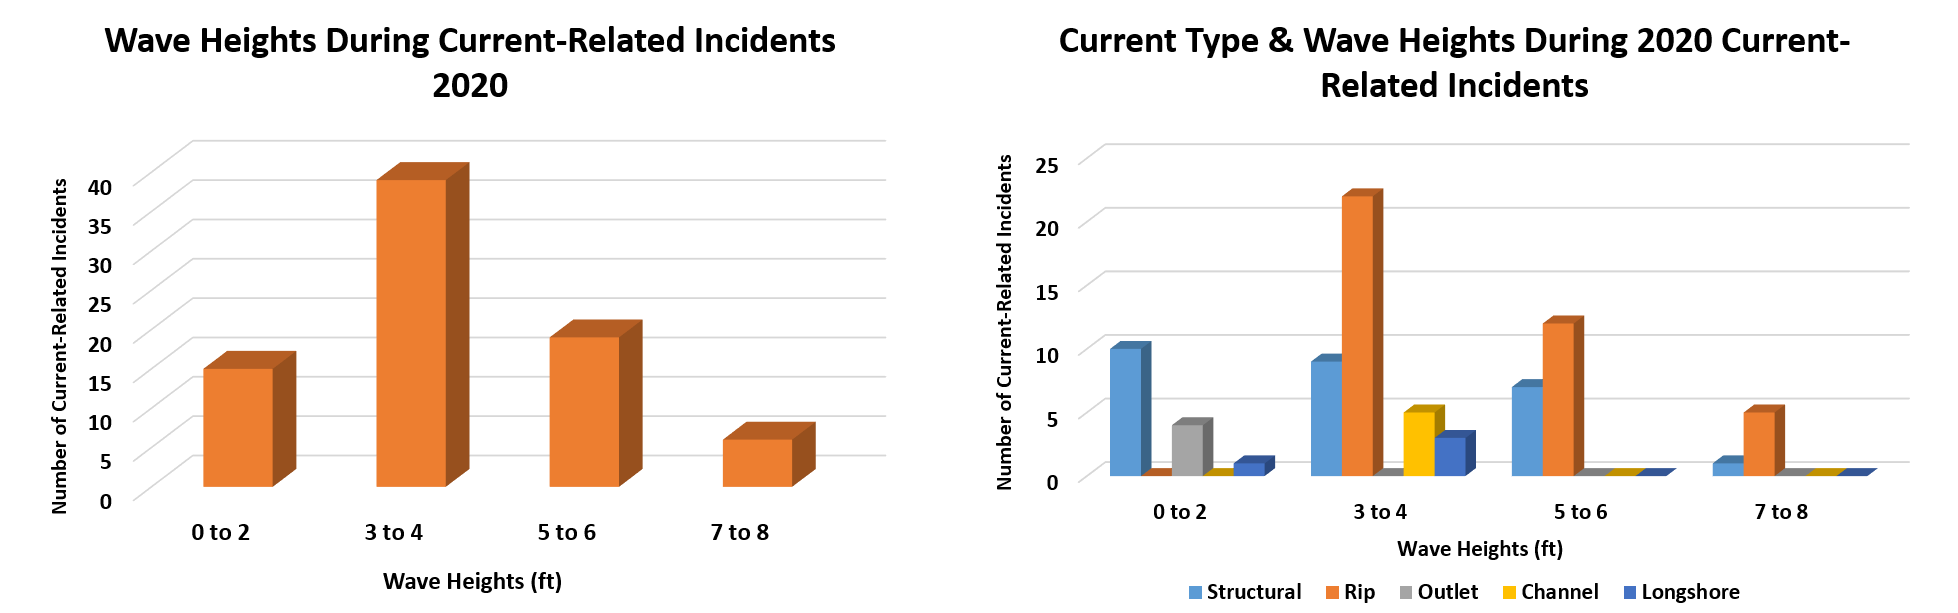
Fig. 14. Left: Wave Heights during 2020 Current-Related Incidents. Right: Wave Heights during 2020 Incidents-Classified by Current-Type (GLCID, 2020).
Wave Angle of Approach Relative to Shore
Which current type is most likely on any given day also depends on wave angle of approach relative to shore. When waves approach the shoreline directly (at a 90 degree angle), water is able to ‘pile up’ more efficiently, making dangerous currents more likely (especially classic rip currents). The strongest longshore currents and structural currents are usually observed at more oblique angles, ranging from 30 to 59 degrees (longshore current speed is maximized at 45 degrees). At lesser angles, structural currents and longshore currents are most likely-especially at beaches with shore-parallel sandbars. Shore-parallel sandbars have been shown to increase the longshore current speed. During the 2020 swim season, 73% of incidents occurred with wave angles of approach between 30 and 90 degrees relative to shore (Fig. 15). If you include all current-types and break it down by wave angle of approach (Fig. 16), most of the incidents that occurred with shore-parallel flow (0 to 29) were structural, channel, or longshore current related. There was one incident with strong offshore winds and waves moving away from the beach, and it was an outlet current (which had increased flow from heavy rain). Otherwise, the prevalence of rip current-related incidents increases as the wave angle of approach becomes more direct, which is expected.
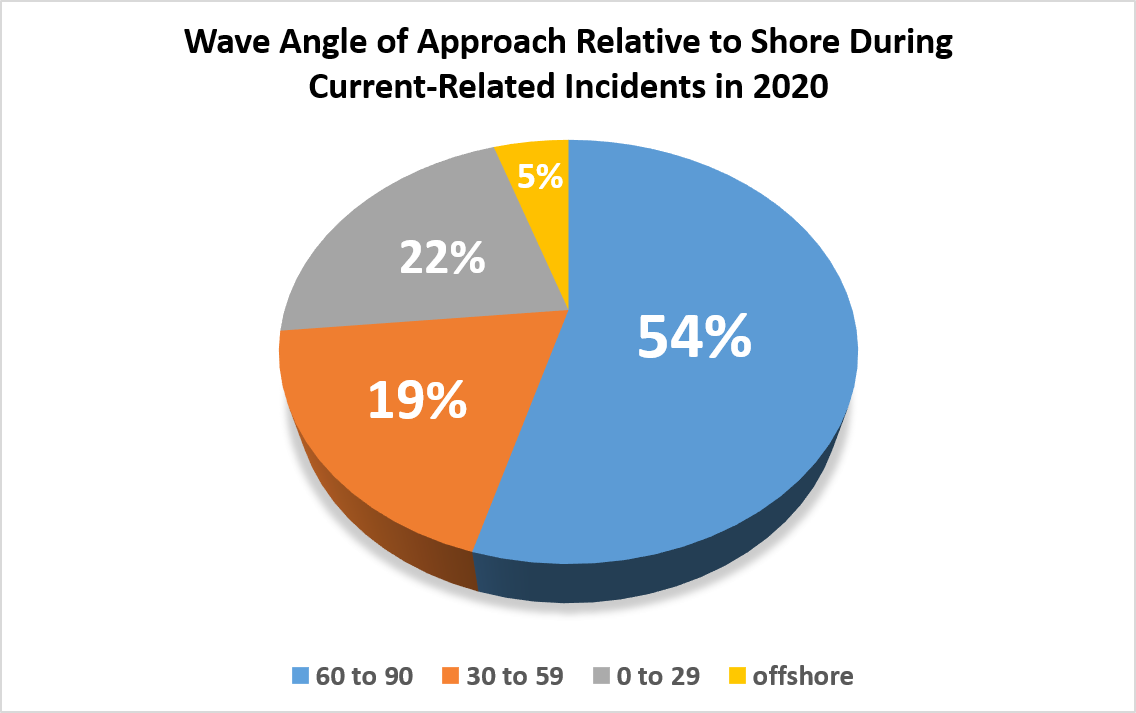
Fig. 15. Wave angle of approach relative to shore for the 2020 Current-Related Incidents (GLCID, 2020).
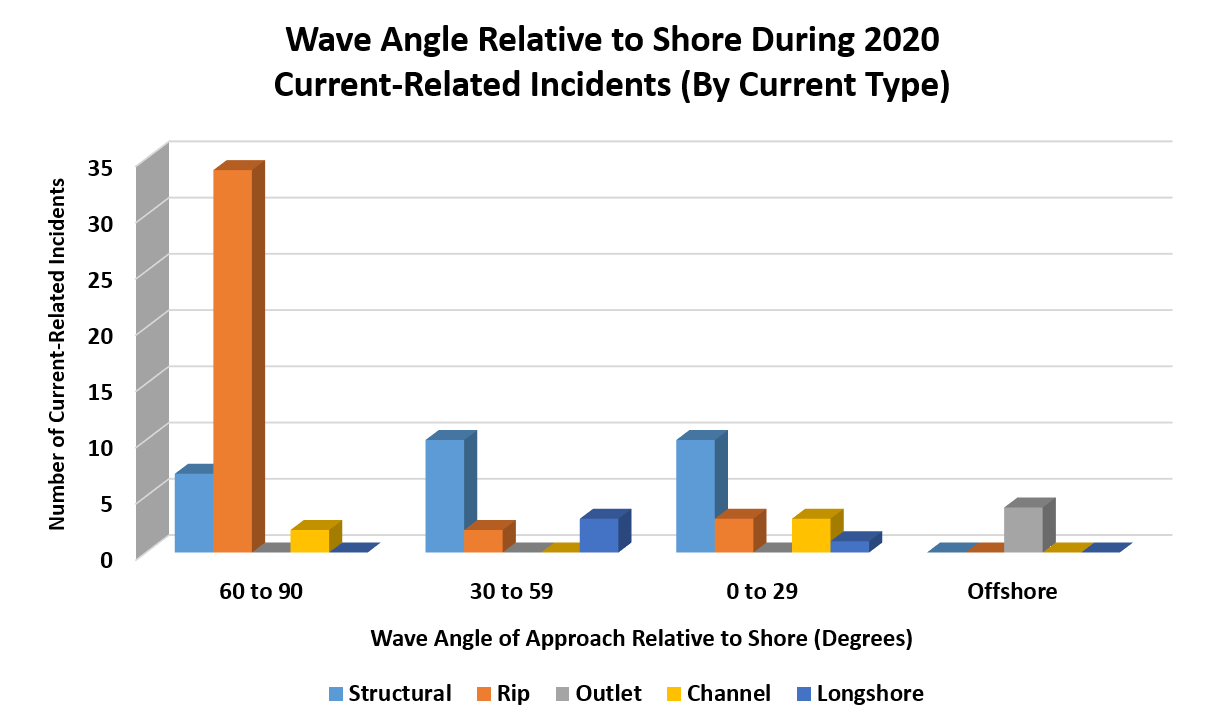
Fig. 16. Wave angle of approach relative to shore during the 2020 current-related incidents, classified by current type (GLCID, 2020).
Wave Period
The wave period is the time (in seconds) between each passing wave. Water is able to ‘pile up’ more efficiently with longer wave periods, making dangerous currents more likely (especially rip currents). The average wave period on the Great Lakes is 4 seconds, so this was also the most common wave period observed during current-related incidents in 2020 (Fig. 17). When sorted by current-type, a majority of rip current-related incidents occurred with wave periods of 5 seconds or greater (Figure 18).
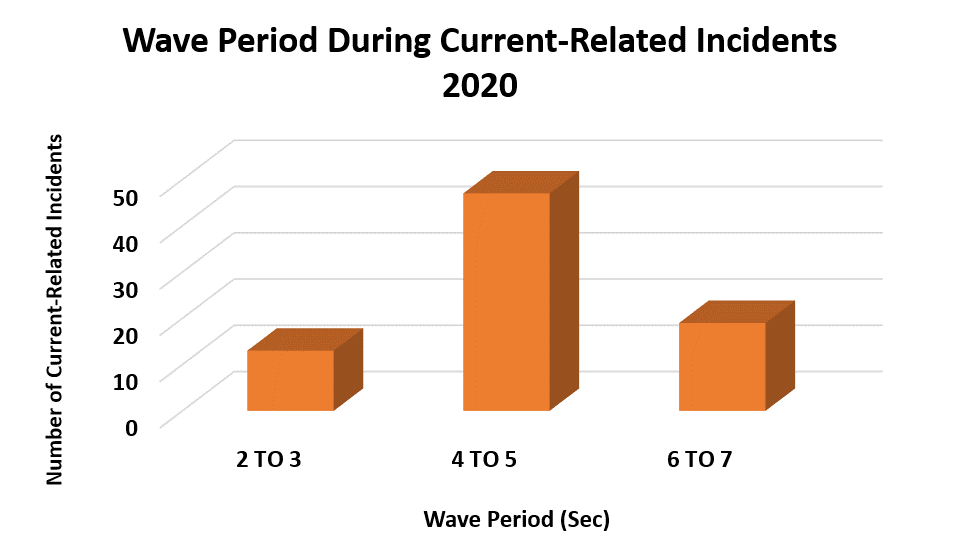
Fig. 17. Wave Period during Current-Related Incidents in 2020 (GLCID, 2020).
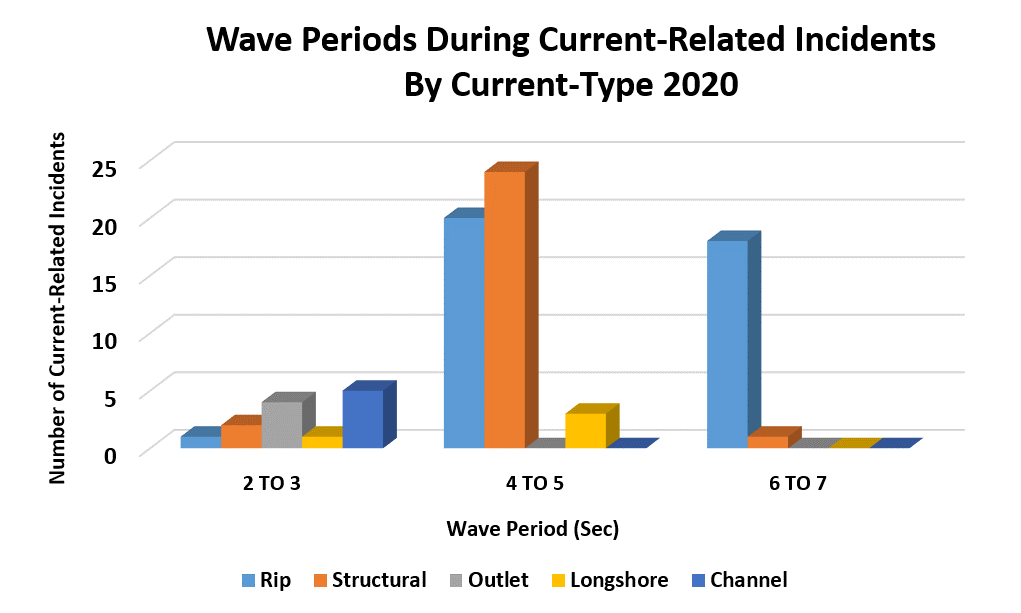
Fig. 18. Wave Period during Current-Related Incidents in 2020, classified by current-type (GLCID, 2020).
Weather Pattern
The most common weather pattern observed during current-related incidents is the passage of a cold front. This was true for 2020 (Fig. 19), where 49% of current-related incidents were associated with a cold frontal passage, and 38% were from high pressure causing onshore flow (with no front in the vicinity).
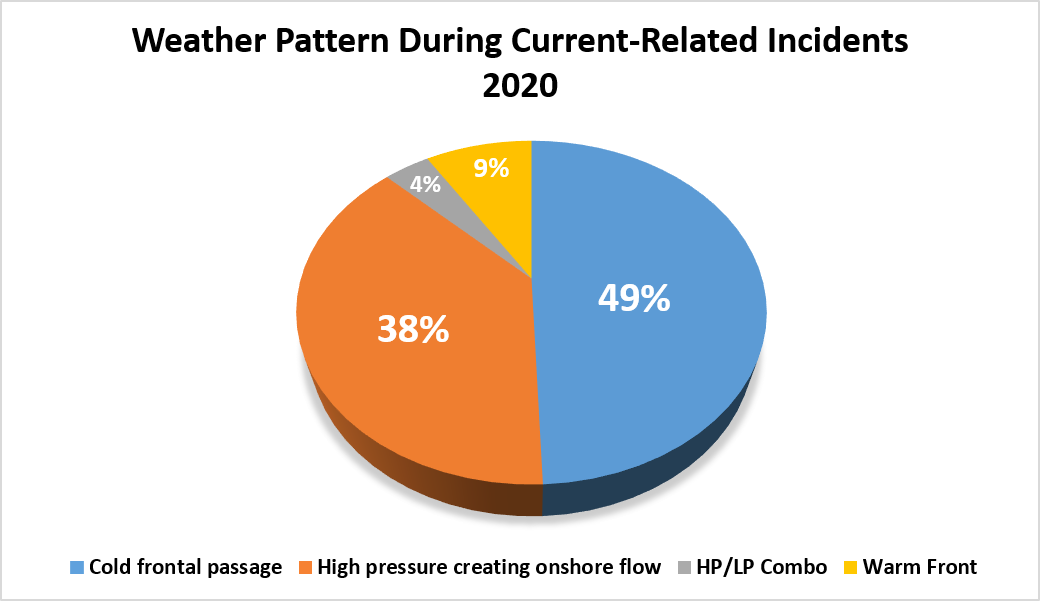
Fig. 19. Weather Pattern during Current-Related Incidents in 2019. HP/LP indicates high pressure/low pressure combination(GLCID, 2020).
Victim Demographics
Unfortunately, victim demographics were not available for a portion of the 2020 incidents, with 16 total estimated victim ages (described as teen, adult, or under 13) and 5 missing all together. For the 58 remaining incidents where age was known, it appears most were between 10 and 27 years old (Fig. 20), which is in line with the data going back to 2002. 72% of the victims were male, and 28% were female (total known was 76 out of 79), which is in line with drowning data world wide (Fig. 21). Lastly, out of the 54 incidents where the hometown of the victim was known, 56% of the victims lived within 90 miles of the beach where the incident occurred (Fig. 22). The second most common distance grouping was between 91 and 299 miles from the beach.
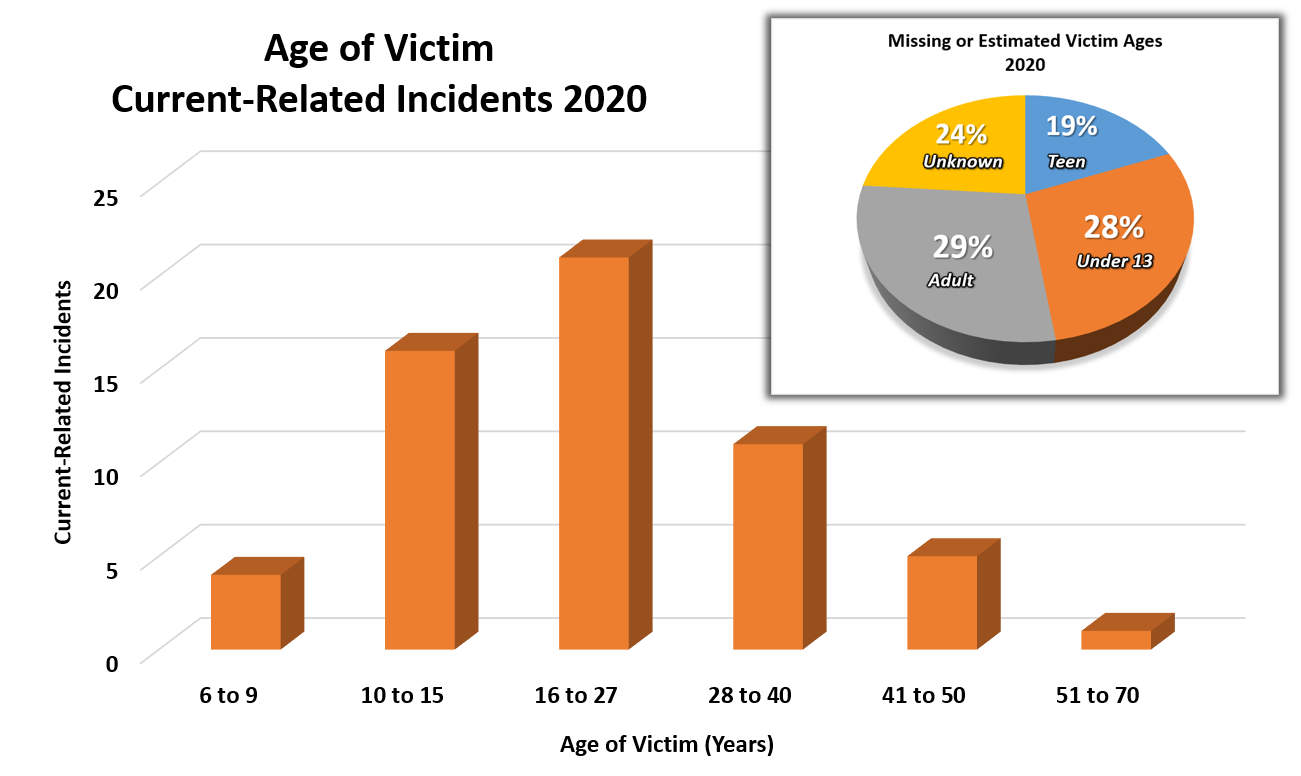
Fig. 20. The age of the victims for 2020 current-related incident. There were 58 total known, 16 estimated, and 5 unknown(GLCID, 2020).
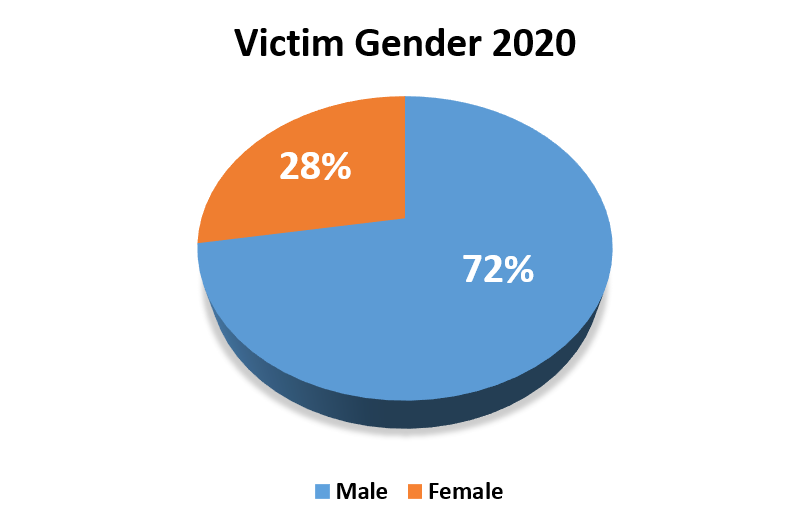
Fig. 21. Gender of Victims for 2020 current-related incidents. There was gender information for 76 out of 79 incidents(GLCID, 2020).
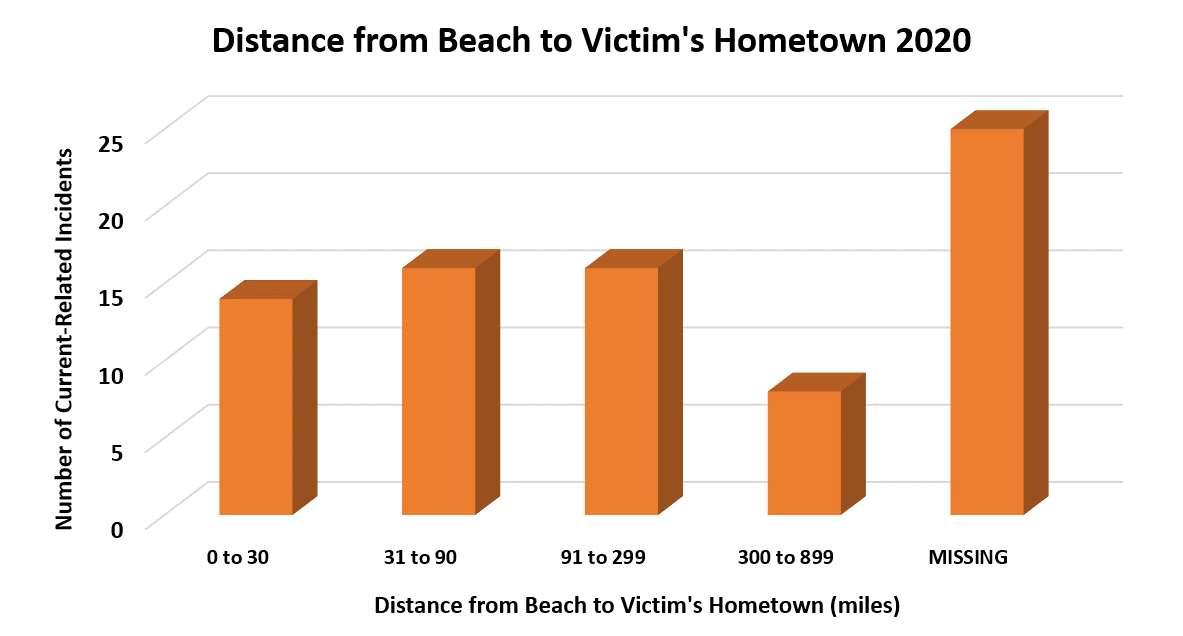
Fig. 22. Distance from Beach to Victims Hometown for current-related incidents 2020. Unfortunately, we were only able to get data on the victims hometown in 54 of the 79 cases (GLCID, 2020).
On a final note regarding the victims, there were 9 victims who were "would be rescuers"-meaning they attempted a rescue and either drowned themselves (6 total) or ended up needing rescue along with the one they were attempting to save (3 total). When considering a water rescue, make sure you have someone call for help, and that you wear a life jacket if deciding to enter the water and help. At a minimum, bring a boogey board or life ring that you can put between you and the person you are trying to save. The person who is actively drowning will often push their rescuer down with them out of panic trying to get air. For this reason, it's better to try and throw a life ring or other floatation device out to the victim first instead of getting into the water.
Summary
In summary, 2020 was a well-above average year in terms of current-related fatalities and rescues, likely due to an amalgamation of factors including warm air and water temperatures on days where high waves were present, and the sociological impacts of COVID-19 on beach attendance, risk taking behavior, and beach staffing/lifeguards. Statistics for the 2002-2020 data can be found on the “About” page (left on the orange tabs at the top of this page). If you would like to see details on the individual incidents, you can search the GLCID here.
If you know of a current-related rescue or drowning that is not included in the 2002-2020 data, please fill out this form. This will send megan.dodson@noaa.gov a direct email with the information needed to add it to the database. If you have any corrections or missing information about an incident already in the database, just send a direct email to Megan.
Thank you to those who provided data for the Great Lakes Current Incident Database during the 2020 swim season. The data helps us to get a handle on the weather and water conditions present during incidents, and hopefully fulfill our mission of protecting lives (and ending drowning on the Great Lakes).
References and Resources
Great Lakes Current Incident Database (GLCID, National Weather Service, 2020). http://www.miseagrant.umich.edu/dcd/dcdsearch.php
Great Lakes Environmental Research Center (GLERL/GLSEA, 2020): https://coastwatch.glerl.noaa.gov/statistic/
Great Lakes Surf Rescue Project (2020): https://www.glsrp.org
Great Lakes Water Safety Consortium (2020): Get involved: https://greatlakeswatersafety.org/
Meadows, G.A., Meadows, L.A., Wood, W.L., Hubertz, J.M., & Perlin, M. (1997): Journral Ametsoc.
Midwestern Regional Climate Center (MRCC, 2020):https://mrcc.isws.illinois.edu/cliwatch/watch.htm#
Michigan Sea Grant (2020):https://www.dangerouscurrents.org
NWS Beach Forecast Page: https://www.weather.gov/greatlakes/beachhazards
Additional research on dangerous currents:https://www.weather.gov/iwx/beachpage_references
Linares, Alvaro & Wu, Chin & J. Bechle, Adam & J. Anderson, Eric & A. R. Kristovich, David. (2019). Unexpected rip currents induced by a meteotsunami. Scientific Reports. 9. 10.1038/s41598-019-38716-2. https://www.researchgate.net/publication/331096172_Unexpected_rip_currents_induced_by_a_meteotsunami
USACE Water Levels (2020). https://lre-wm.usace.army.mil/ForecastData/GLBasinConditions/LTA-GLWL-Graph.pdf
Hazards
Heat Related
Winter Related
Watch/Warning
Outlook
Storm Reports
Storm Prediction Center
Submit a Report
Event Ready
Climate
FWA Daily
SBN Daily
FWA Monthly
SBN Monthly
CoCoRaHS
Spring Frost Climatology
Fall Frost Climatology
Severe Climatology
Local Information
Skywarn
COOP
Our Office
WSR-88D
Headline Criteria
NOAA Weather Radio
Weather History
Probabilistic Snowfall
Public Information Statement
Social Media Feeds
Weather Events Page
US Dept of Commerce
National Oceanic and Atmospheric Administration
National Weather Service
Northern Indiana
7506 E 850 N
Syracuse, IN 46567
574-834-1104
Comments? Questions? Please Contact Us.

