Event Overview –
During the morning of 26 December 2012 a strong negatively-tilted, upper level trough was located across the Ohio River Valley with a surface low centered over eastern Tennessee. The upper trough was forecast to progress northeast along the western spine of the Appalachian Mountains on the 26th and 27th. A warm front surged north across eastern NC during the morning and early afternoon hours. By 20 UTC December 26th, Storm Prediction Center mesoanalysesindicated a favorable environment for severe weather during the afternoon hours with a strong jet structure (Fig. 2 and Fig. 3) providing strong divergence/difluence aloft. At 850 mb (Fig. 4) a strong 60 knot low-level jet helped transport a tongue of moisture north-northeastward across eastern NC. The surface chart (Fig. 5) indicated 30-40 knots of south-southeast flow with a cold front stretching south-southwest from the Piedmont of NC to off the Florida coast. The setup was typical for a high-shear low-cape scenario. The Storm Prediction Center had placed eastern NC in a moderate risk with a 15% hatched area for tornadoes (Fig. 6).

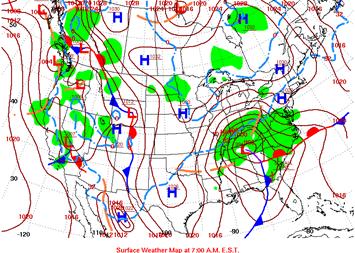
Figure 1: 12 UTC 500 mb (left) and surface charts (right).
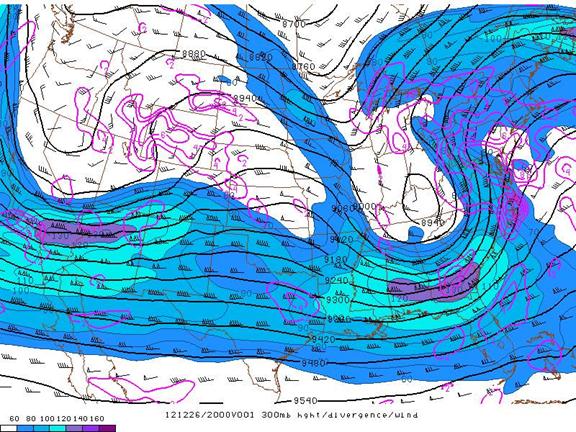
Figure 2: 20 UTC 300 mb heights (black solid lines), divergence (purple lines), and wind (shaded).
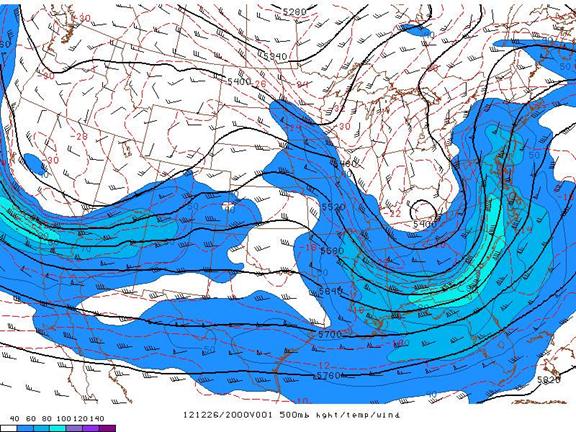
Figure 3: 20 UTC 500 mb heights (black solid lines), temperature (dashed lines), and wind (shaded).
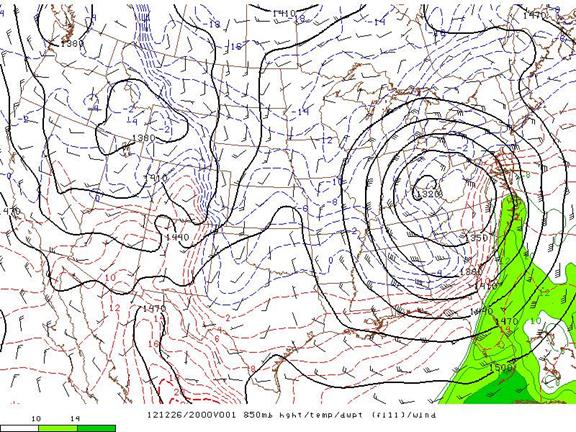
Figure 4: 20 UTC 850 mb heights (black solid lines), temperature (dashed lines), dewpoint (shaded), and wind.
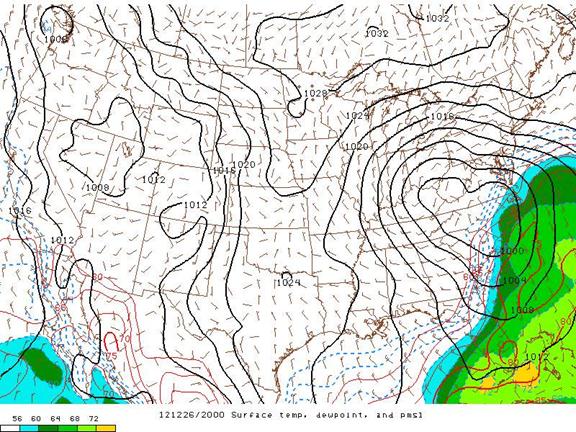
Figure 5: 20 UTC surface mean sea level pressure (solid black lines), temperature (red lines), dewpoint (shaded) and wind.
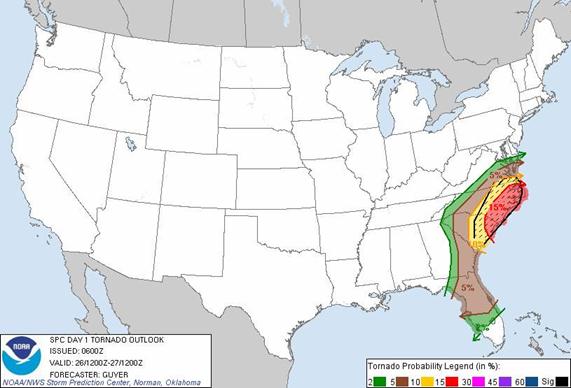
Figure 6: SPC Day 1 tornado outlook issued at 06 UTC which placed eastern NC in a 15% hatched region.
Mesoscale Summary
Numerous mesocyclones/velocity couplets were observed off the coast where instability was markedly greater; however most couplets dissipated prior to or just after moving into the more stable onshore airmass. A 19 UTC LAPS sounding located near KMRH (Fig. 7), approximately one hour prior to the tornado touchdown, noted weak instability (barely negative lifted index, nearly 300 J/kg CAPE) and very strong shear. The sounding indicated south-southwest flow around 50 knots at roughly 2000 feet with 0-3km storm-relative helicity of 306 m²/s². Lifted condensation level (LCL) heights were also very low, around 400 feet, implying low level rotation would not need to stretch far to reach the surface. The Weather Forecast Office in Raleigh (RAH) forwarded along several archive RAP soundings centered at KMHX (about 11 miles west of KMRH – Beaufort, NC) which also indicated very low LCLs (roughly 500 feet) with 0-1km storm-relative helicity of 350 m²/s² after adjusting the hodograph for observed storm motion.
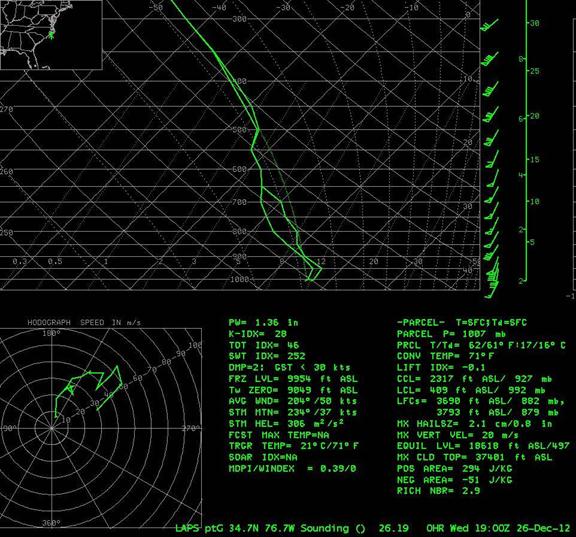
Figure 7: 19 UTC LAPS proximity sounding centered near KMRH.
Radar Imagery – early non-tornadic couplets over Onslow County
Early in the afternoon, around 1620 and 1740 UTC, two persistent velocity couplets off the coast of Pender and Onslow counties moved onshore over North Topsail Island across Sneads Ferry and into Marine Corps Base Camp Lejeune. A KMHX radar loop of the 0.5 degree slice is given below (Fig. 8) which illustrates the strong rotation signature from the second couplet. A closer look at Dual-Pol data indicated a weak Tornado Debris Signature (TDS) over the southeastern edge of Camp Lejeune along the eastern edge of the New River around 1745 UTC. A TDS can be found on radar when Correlation Coefficient (CC; or RHO in GR2Analyst) is below 0.90 and a local minimum in Differential Reflectivity (ZDR) are observed collocated with a strong couplet on base velocity. Figures 9 and 10 contain loops of KMHX imagery at 0.5 degrees and 0.9 degrees which indicate a TDS signature from around 1745-1750 UTC. Our partners at Camp Lejeune conducted a fly-over of the potential tornado path (roughly 34.599N, -77.345W to 34.640N, -77.325W) but found no damage. Ultimately, neither areas of rotation (1620 or 1740 UTC) produced damage after extensive follow-up with Onslow county and Camp Lejeune emergency managers.
Figure 8: KMHX 0.5 degree loop of base reflectivity (top left), base velocity (top right), storm-relative velocity (bottom left), and GR2Analyst normalized rotation (NROT) product (bottom right).
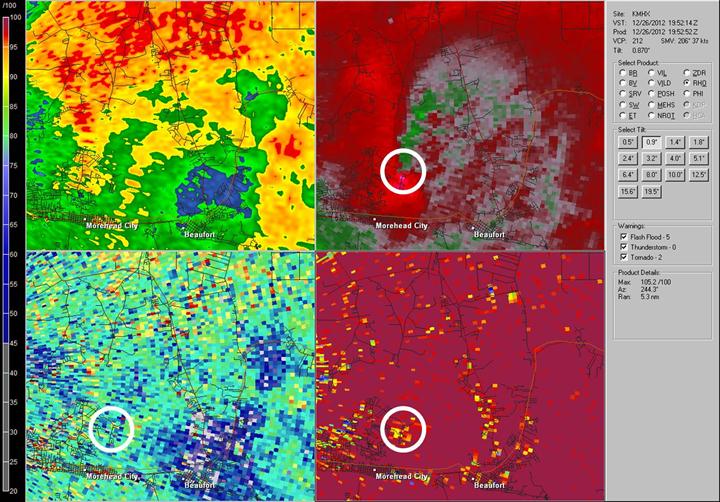
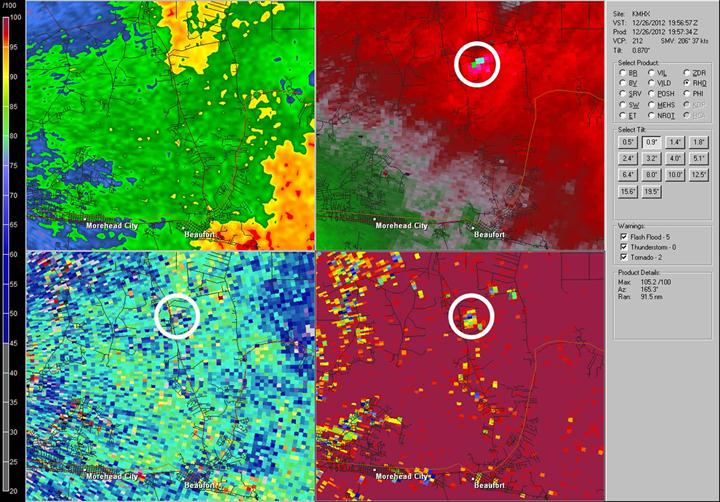
Figure 9: KMHX 0.5 degree loop of base reflectivity (top left), base velocity (top right), differential reflectivity (ZDR) bottom left, and correlation coefficient (CC) bottom right.
Figure 10: KMHX 0.9 degree loop of base reflectivity (top left), base velocity (top right), differential reflectivity (ZDR) bottom left, and correlation coefficient (CC) bottom right.
Radar Imagery – Beaufort EF1
The Beaufort tornado was unlike previous storm cells of the day in that it did not have a persistent velocity signature offshore. Instead, a large circulation formed off the coast and produced straight line wind damage from Atlantic Beach east to Fort Macon, then north into downtown Morehead City (Fig. 11). The circulation then strengthened and produced an EF1 tornado about 4 miles north of Beaufort. The 0.9 and 1.4 degree slices (Fig. 12 and 13) are also listed below as 0.5 degree data were rather noisy at such a close proximity to the radar (roughly 10 nmi). A closer look at Dual-Pol imagery (Fig. 14 and 15) indicated a Tornado Debris Signature (TDS) at 1952 and 1956 UTC.
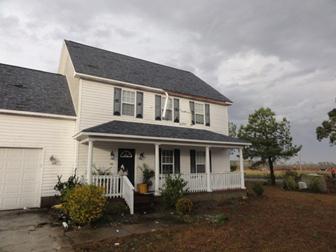
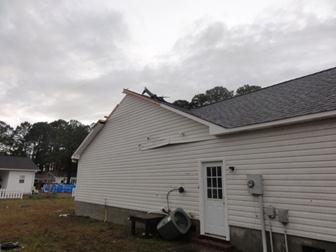
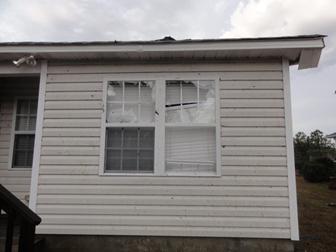
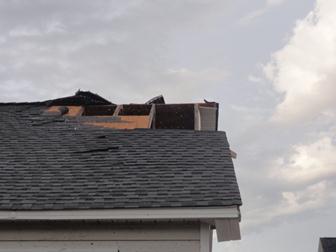
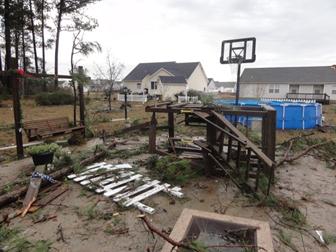
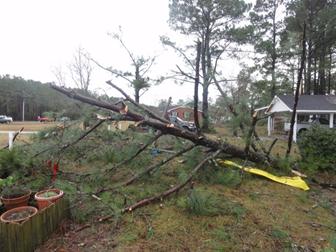
The tornado caused tree destruction and minor house (window and roof) damage consistent with an EF1 tornado with winds estimated around 90 mph. The tornado was on the ground for approximately 1/4 mile with a maximum width of 100 yards (Fig. 16). One of our lead forecasters was unfortunately impacted by the tornado with several tops of trees broken off and a few large downed pine trees. He was sleeping just prior to the tornado, resting from working the previous midnight shift, and awoke to his wife yelling “get in the hallway!” Thankfully no injuries or fatalities were observed with this tornado.
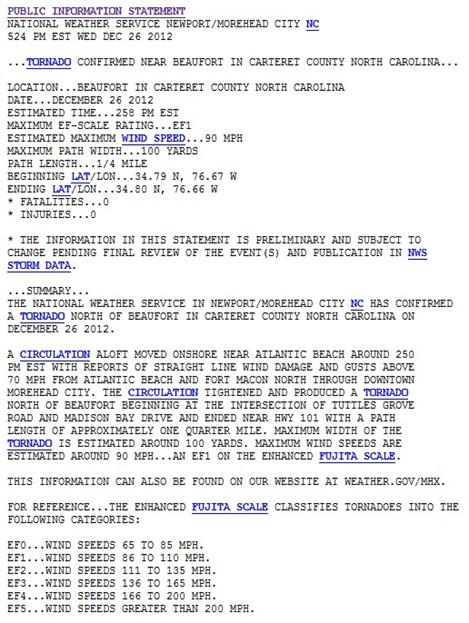
Figure 16: Public Information Statement for the Beaufort EF1 Tornado.
Damage Pictures
Photos courtesy of: WFO MHX
Case Study Team:
David Glenn


 Map View
 Weather Hazard Briefing (when applicable)
 Forecaster Discussion
 Marine
 Text Products
.png) Skywarn
Skywarn Submit Storm Reports
 Coastal Flood
.png) Surf Forecast/Rip Currents
Surf Forecast/Rip Currents