Newport/Morehead City, NC
Weather Forecast Office
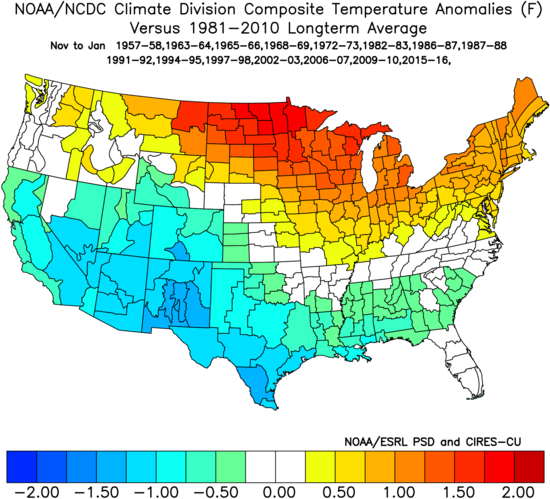
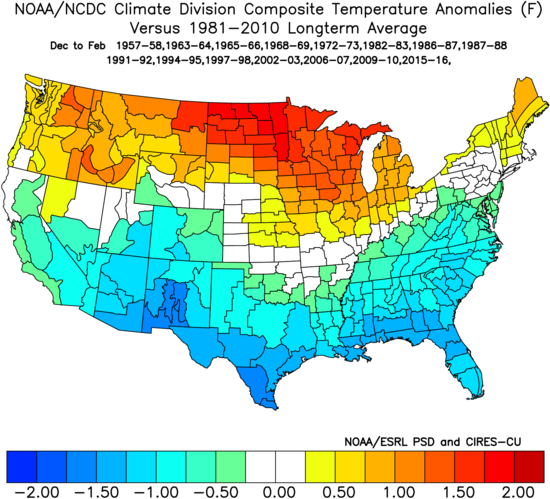
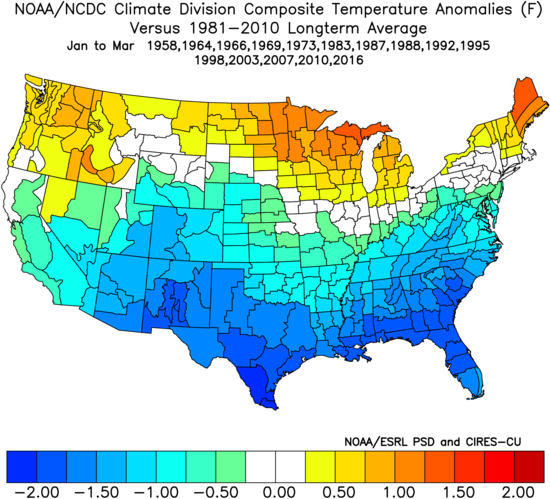
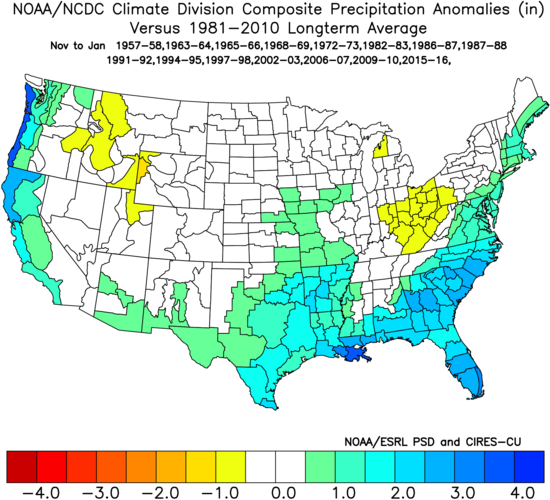
El Niño Temperature/Precipitation Anomalies 
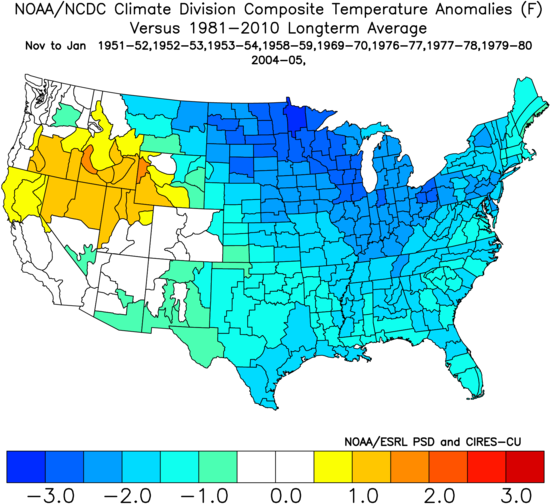
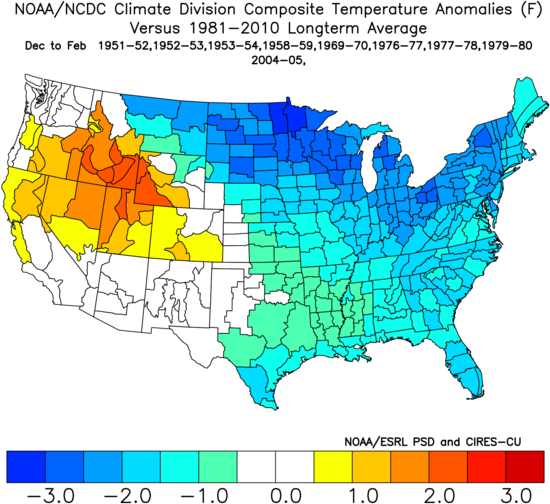
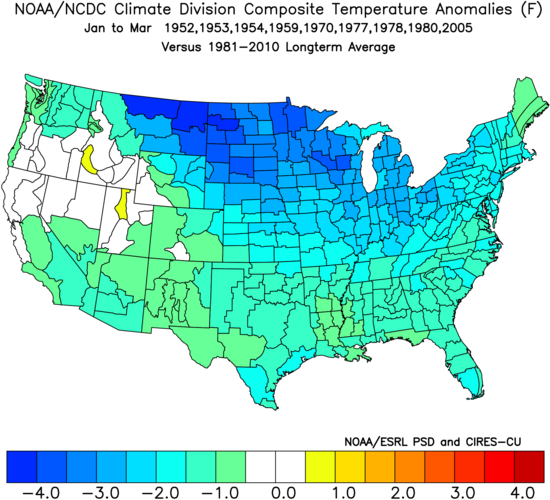
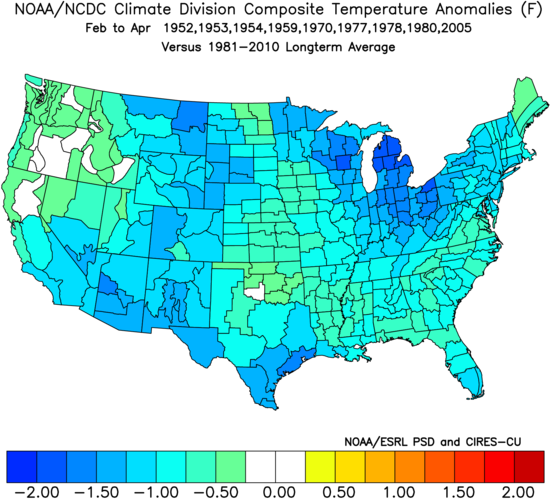
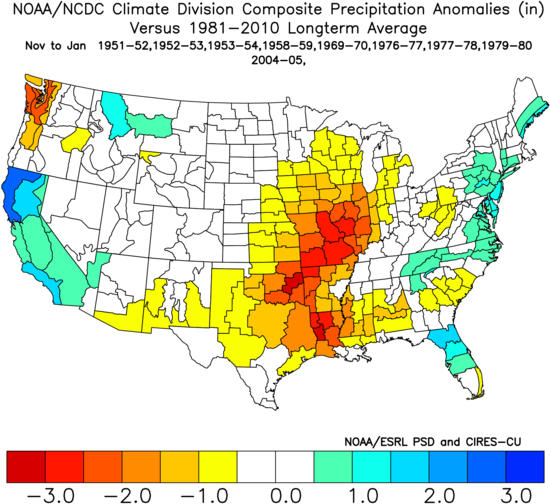
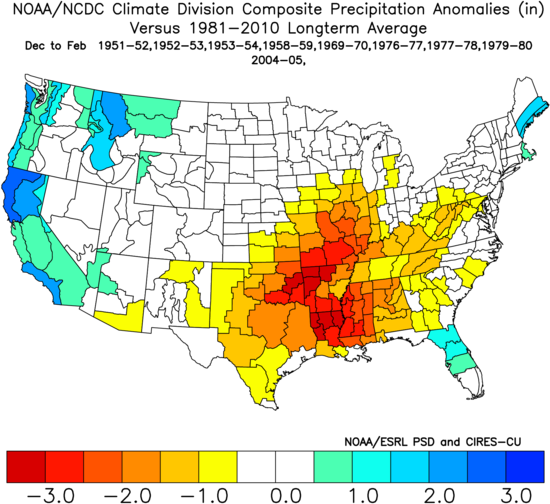
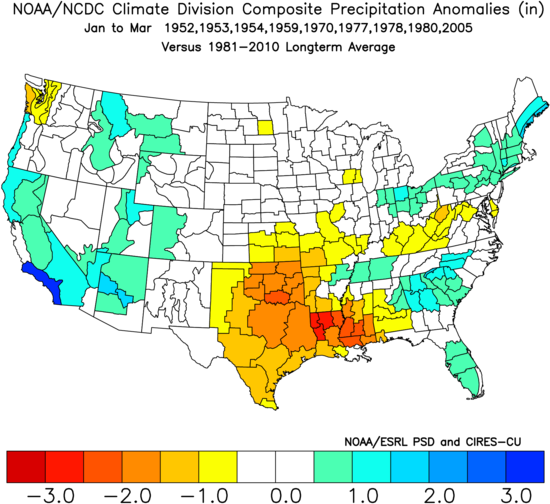
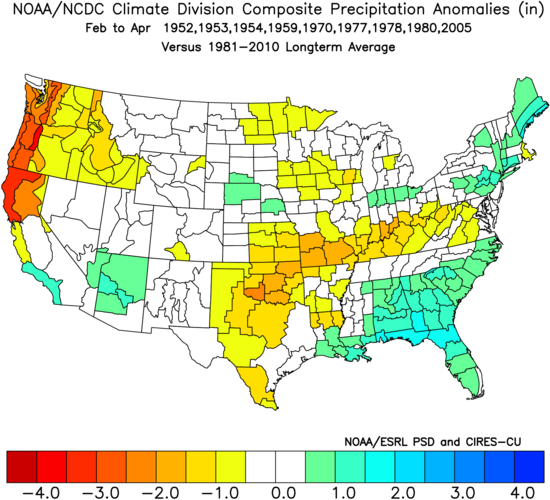
Below are three-month averaged temperature and precipitation anomalies from November through April for weak, moderate and strong El Niño episodes since 1950. The anomalies are based on the official 1981-2010 normals. These composites are not intended to be a forecast of expected conditions. Rather, they use historical data to highlight locations where ENSO can potentially impact temperature and precipitation.
El Niño: Temperature Anomalies
|
Weak Episodes |
 |
 |
 |
 |
|
Moderate-Strong Episodes |
 |
 |
 |
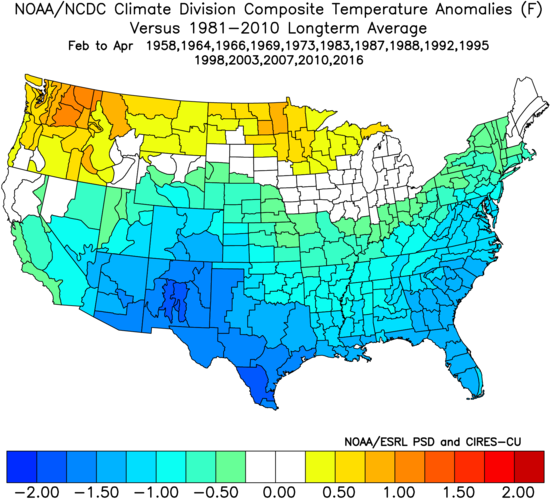 |
| November - January | December - February | January - March | February - April |
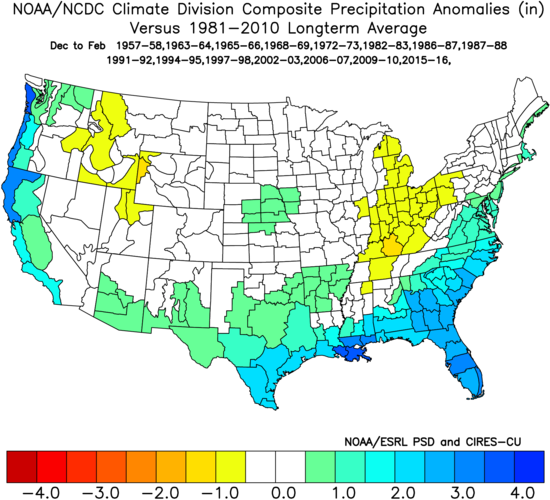
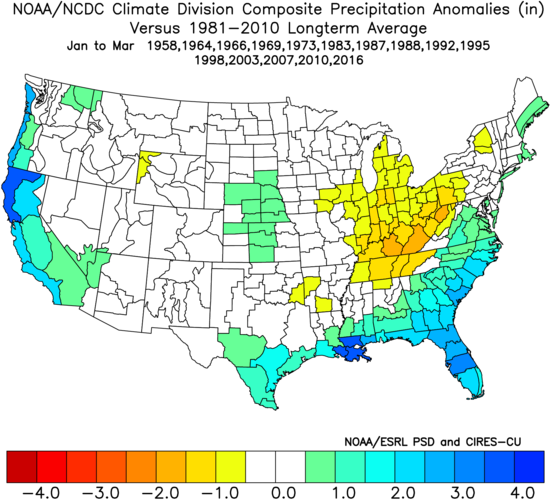
El Niño: Precipitation Anomalies
|
Weak Episodes |
 |
 |
 |
 |
|
Moderate-Strong Episodes |
 |
 |
 |
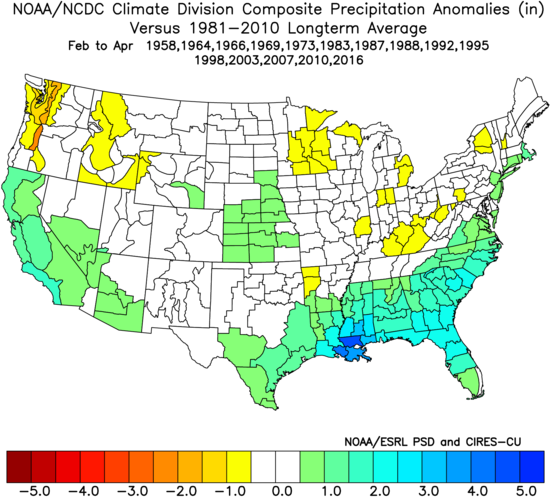 |
| November - January | December - February | January - March | February - April |
Hazards
Skywarn
Submit Local Storm Reports
National Storm Report Viewer
Storm Prediction Center
National Hurricane Center
Rip Currents
Forecasts
Text Products
Tropical Weather
Activity Planner
Map View
Text Forecast
Area Forecast Matrices
Point Forecast Matrices
Forecast Discussion
Aviation Forecasts
Fire Weather Forecasts
Climate/Historical
Local Climate Page
National Climate Data
Local Significant Event Summary
Climate Plots
Tropical Cyclone Reports
Observations
Mesonet
Buoy Observations
Area Rivers
UV Index
Air Quality
Other Marine Reports
Marine Information
Local Marine Forecast
National Marine Information
Surf Zone Forecast/Rip Currents
Area Tidal Predictions
Ocean Prediction Center
Experimental Marine Portal
US Dept of Commerce
National Oceanic and Atmospheric Administration
National Weather Service
Newport/Morehead City, NC
533 Roberts Rd
Newport, NC 28570
252-223-5737
Comments? Questions? Please Contact Us.


 Map View
 Weather Hazard Briefing (when applicable)
 Forecaster Discussion
 Marine
 Text Products
.png) Skywarn
Skywarn Submit Storm Reports
 Coastal Flood
.png) Surf Forecast/Rip Currents
Surf Forecast/Rip Currents