
Rainfall Totals Add Up Over Central Gulf Coast
August 2022
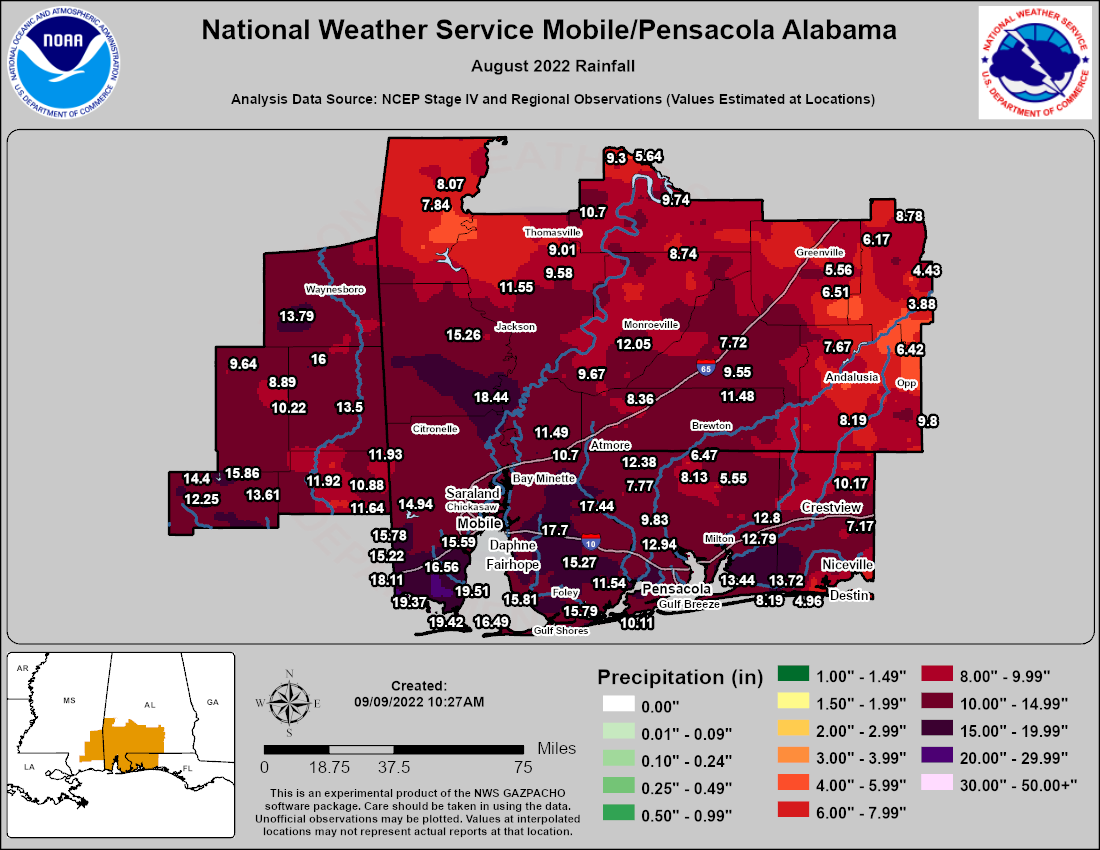
August 2022 was anomalously wet over the central Gulf coast with rain gauges over several areas measuring over a foot of rain for the month. A notable mention is these rains occurred without the influence of a tropical system. The map below shows a Graphical Information System (GIS) representation of the distribution of rainfall from nearly 180 rainfall reports received by the National Weather Service Mobile/Pensacola over the County Warning Area (CWA).
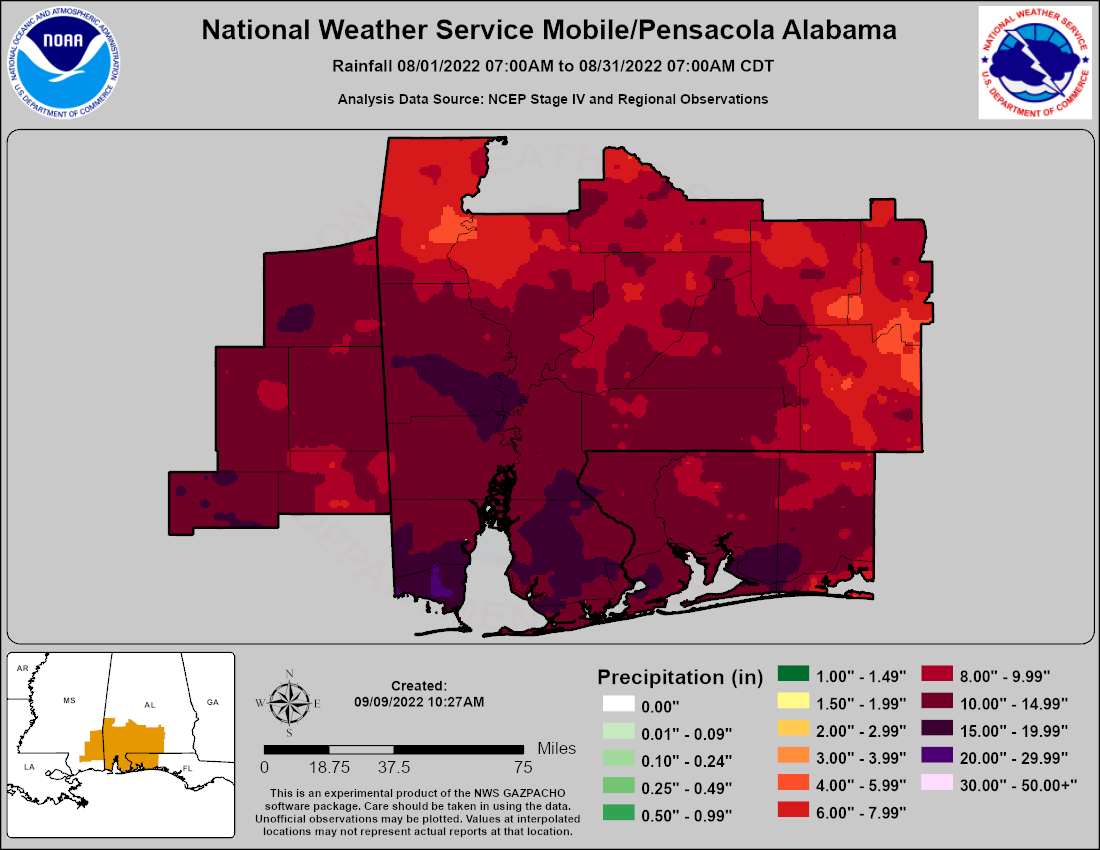
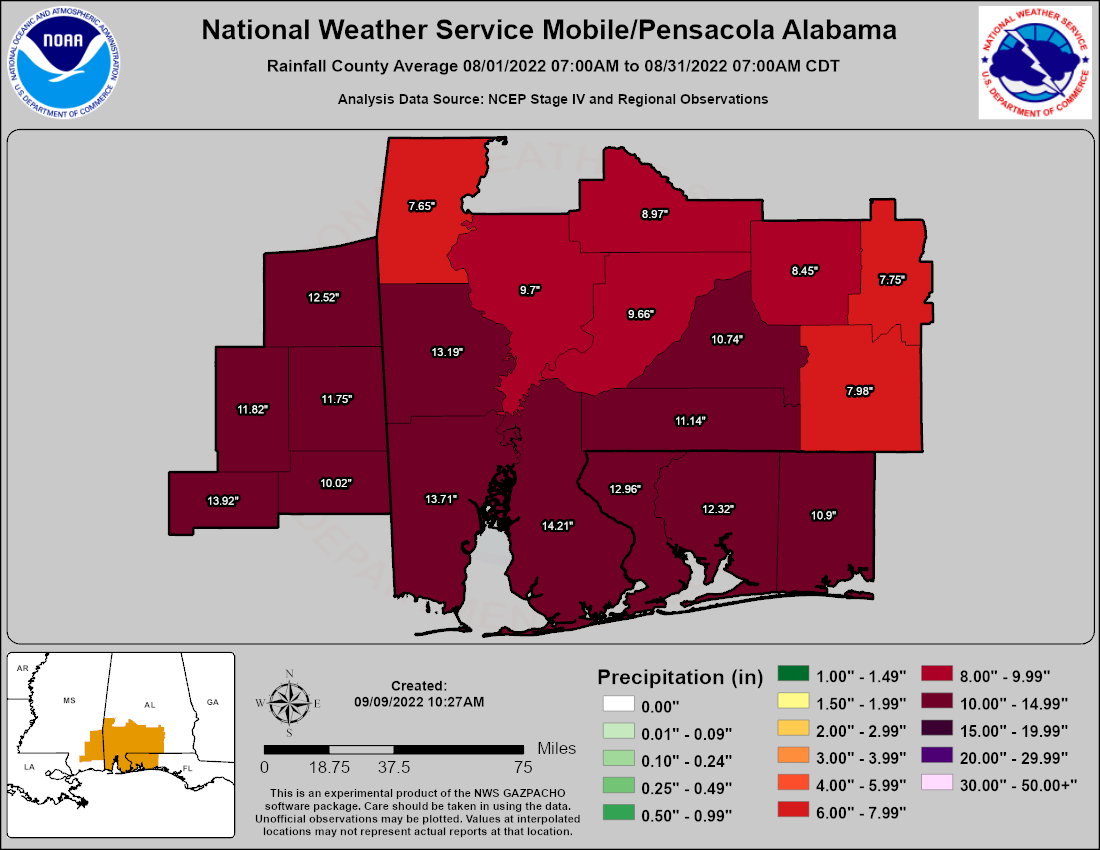
Two additional graphics of the Areal Rainfall Distribution are provided in the tables below. Areal Rainfall Distribution without observations as a layer (Fig. 1) and County Averages (Fig. 2)
|
|
For a comprehensive listing of the rainfall used to build the three images above, please see Rainfall Observations.
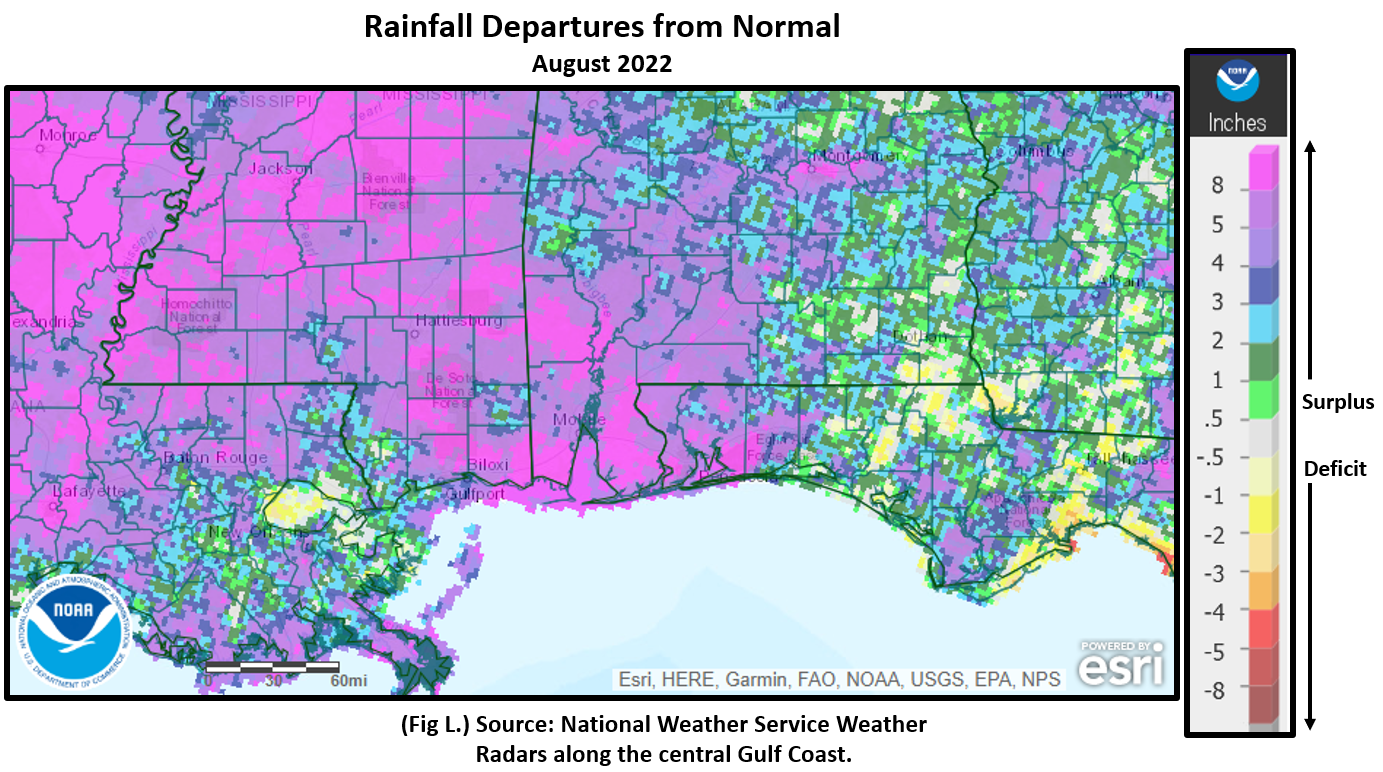
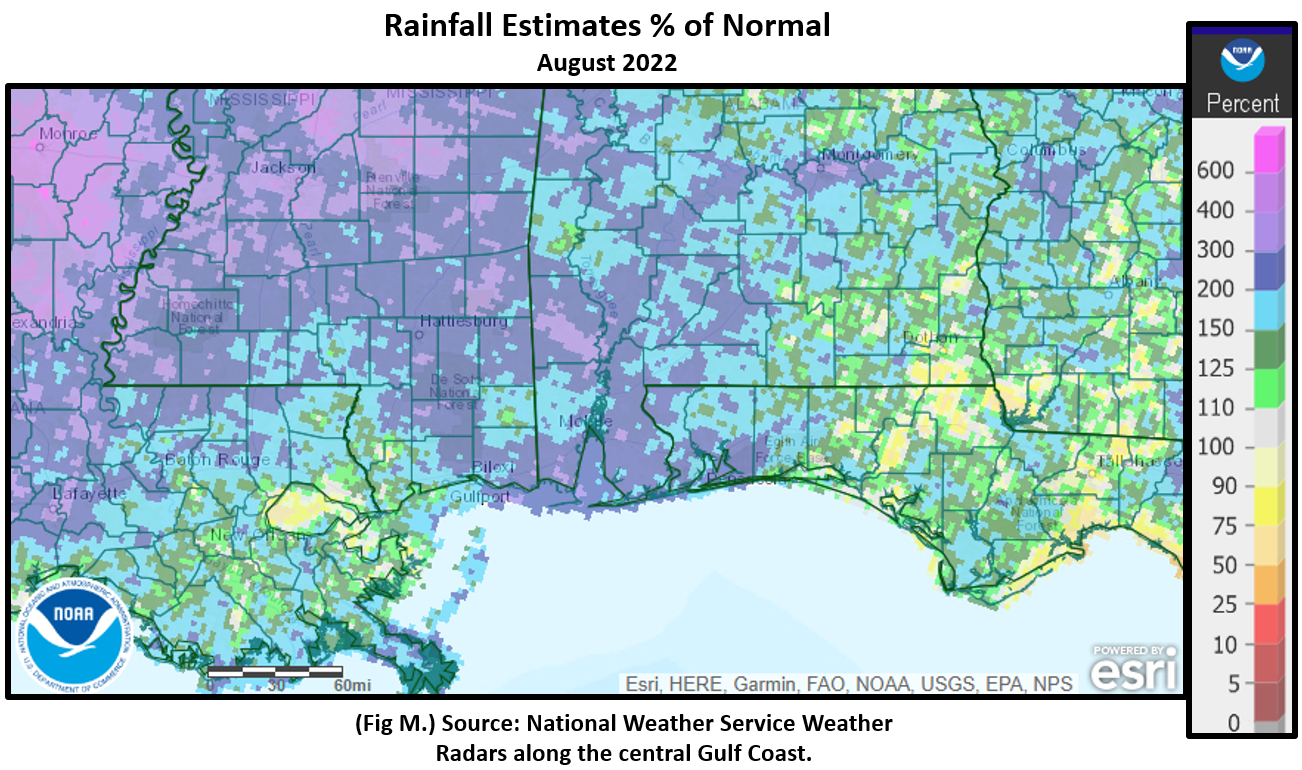
The following two graphics highlight the excessive rainfall from August 2022 in a climate frame of reference using radar rainfall estimates. Fig. 3 shows the rainfall for much of the area was between 4 to 8 inches above normal and Fig. 4 shows between 200 and 400% of normal rains fell.
|
|
Acknowledgements: Page created by Joe Maniscalco (Observation Program Leader) with contributions from Brandon Black (Forecaster) who composed the GIS graphics, Morgan Barry (Forecaster) and Jason Beaman (MIC) for their review. A huge thank you goes out to NWS COOP Observers, the many volunteer rainfall observers with the Community Collaborative Rain Hail and Snow Network (CoCoRaHS), USA CHILI - Mesonet, and citizens who share their data via personal weather stations.
LAST UPDATED: September 2022

