February 2018 Graphical Climate Summaries
Mobile Alabama and Pensacola Florida Area
National Weather Service Mobile Alabama
February 2018 in Review - After an unseasonably cold January, quite the contrary occurred in February along the Gulf coast with an anomalously warm, record setting month against the climatic period of record. There was a steady fluctuation in temperatures the first half of the month, then a nearly steady state temperature profile that remained well above seasonal normals the last half of the month. Measured rains were several inches above normal in Pensacola.
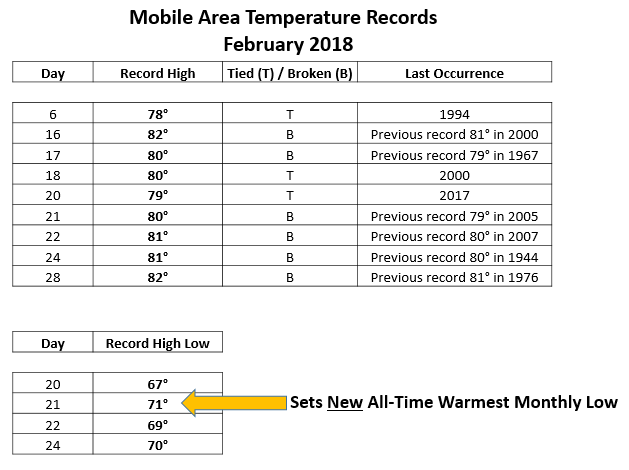
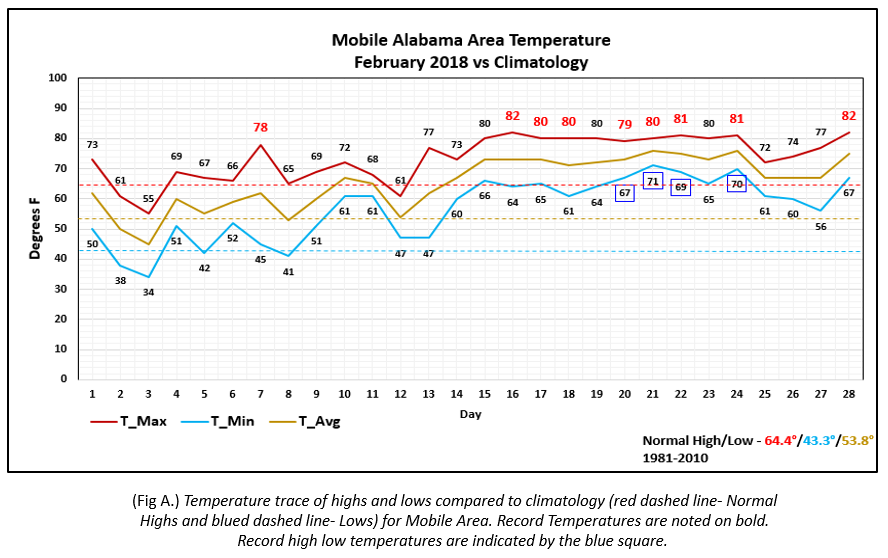
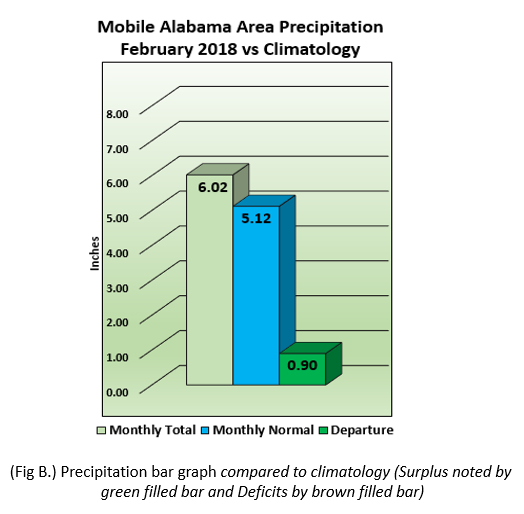
Mobile Alabama Area - The average monthly high was 73.6° or 9.2° above normal. The average monthly low was 56.6° or 13.3° above normal. The average monthly temperature was 65.1° or 11.3° above normal, making February 2018 the warmest on record dating back to 1872. 9 record high temperatures were reached and 4 new record high, low temperatures entered the record books. In fact, the 4 days Mobile saw record high, low temperatures, the average of the lows was 4.9° higher than the average monthly high temperature. See the table below for a more detailed breakdown on the record temperatures. (Fig. A) shows how temperatures compared to the seasonal normal monthly highs and lows, which are shown by the colored dashed lines. February's rainfall measured 6.02" or 0.90" above normal (Fig. B).
Click on the Mobile Alabama area climate graphics below to expand:
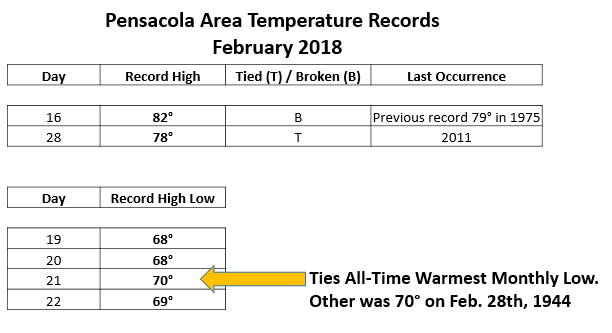
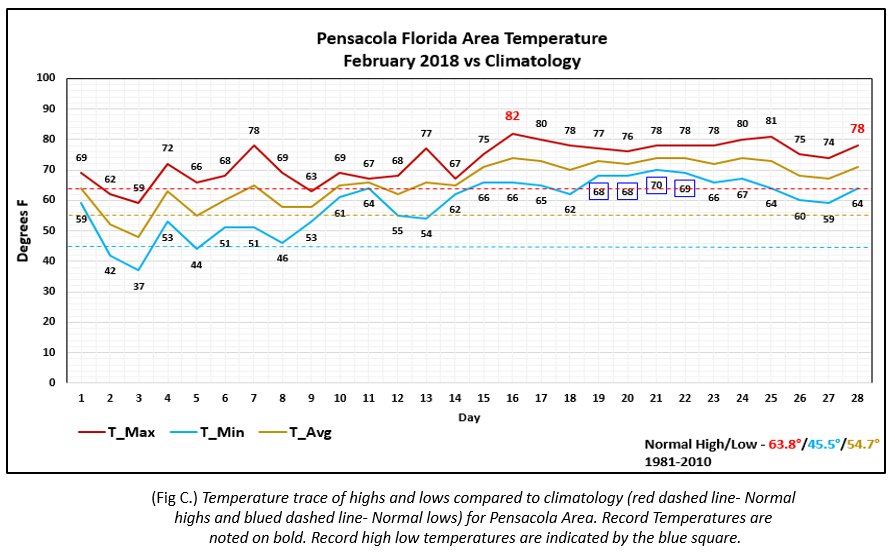
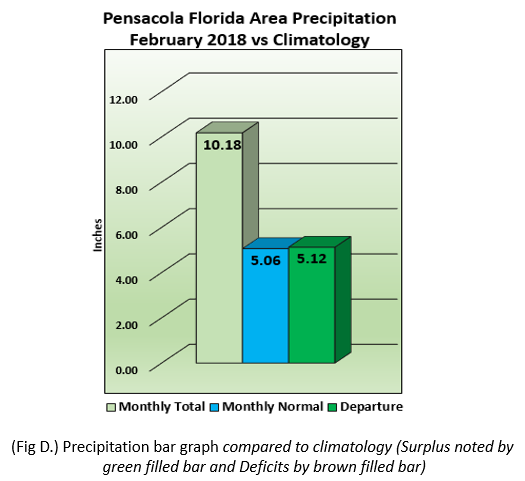
Pensacola Florida Area - The average monthly high was 73.0° or 9.2° above normal. The average monthly low was 58.8° or 13.3° above normal. The average monthly temperature was 65.9° or 11.2° above normal, making February 2018 the warmest on record dating back to 1879. 2 record high temperatures were reached and 4 new record high, low temperatures also entered the record books. Same as Mobile, the 4 days Pensacola saw record high, low temperatures, the average of the lows was 4.9° higher than the average monthly high temperature. See the table below for a more detailed breakdown on the record temperatures. (Fig. C) shows how temperatures compared to the seasonal normal monthly highs and lows, which are shown by the colored dashed lines. February's rainfall measured 10.18" or 5.12" above normal (Fig. D). This amount made it into the top 10 wettest February's on record at Pensacola, standing at number 7.
Click on the Pensacola Florida area climate graphics below to expand:
Climate Outlook:
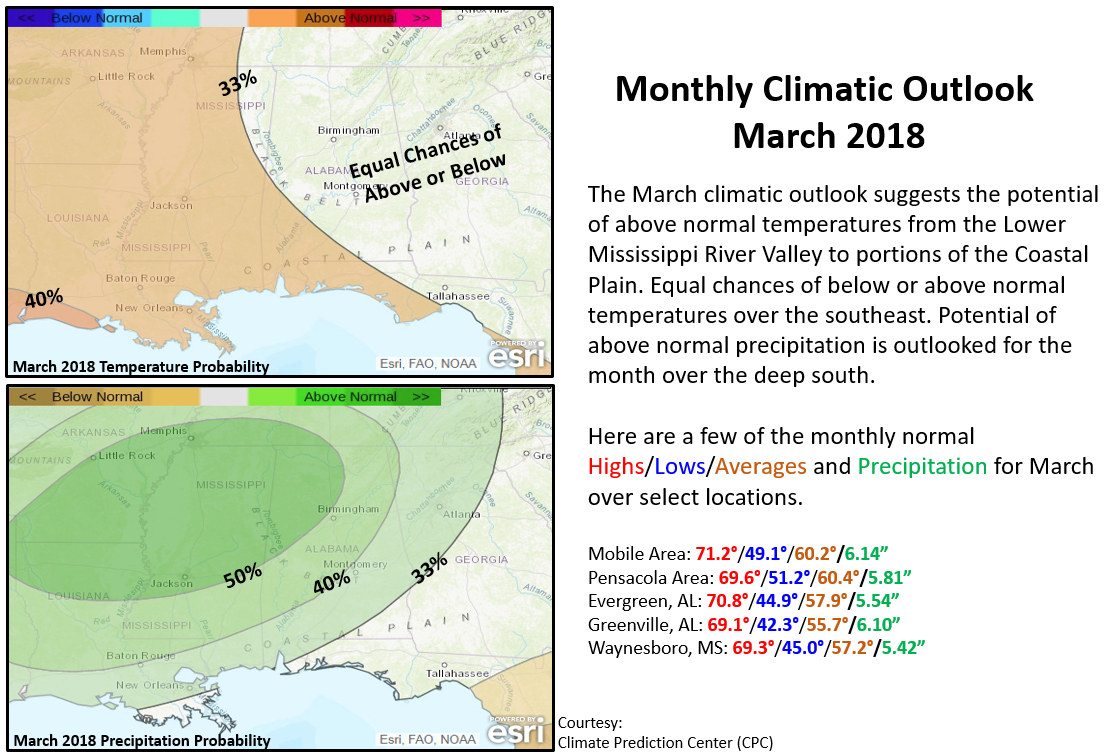
The Climate Prediction Center indicates an elevated probability of above normal precipitation over the deep south for the month of March. This may lead to increased flow over some rivers and elevated river stages this month. Historically, river flood season begins in early to mid January and peaks in early to mid March, then tapers in the late April to early May time frame. Please take note, historically, some of the greatest excessive precipitation events have occurred across our region during a time when winter is transitioning into Summer. Long lead precipitation outlooks are reflected by forecasts of persistent global circulation patterns and the movement of large scale frontal systems to enhance rainfall. These say nothing about an individual weather system that may produce just a few hours of thunderstorm activity which may deposit enough rain that can potentially break daily, weekly or monthly rainfall records in a single event. So be prepared and have a plan!
Click on the graphic below to expand:
Additional Climate Links:
The links below are intended to provide additional climate information, education and outlooks. The National Weather Service Mobile Alabama's Climate and Past Weather page provides climate data at your fingertips for many observation points in the local forecast area by accessing the NOWData tab as well as many other climate resources. The Climate Prediction Center Link provides short and longer range climatic outlooks and education about the larger scale global circulations that impact temperatures and weather. With the large agriculture and farming presence along the central Gulf coast, the Drought Monitor link provides updates on drought trends and impacts. Another very helpful resource is the Community Collaborative Rain Hail and Snow (CoCoRaHS) network, which is a large group of volunteers working together to measure and map precipitation (rain, hail and snow). The aim of CoCoRaHS is to provide the highest quality data for natural resource, education and research applications.
National Weather Service Mobile AL Climate and Past Weather
Climate Prediction Center (CPC)
CoCoRaHS Network Water Year Summaries