February 2020 Climate Summaries
Mobile Alabama and Pensacola Florida Area
National Weather Service Mobile Alabama
March 6, 2020
***Update*** - The traces of normal temperatures in the temperature graphics provided in this document now reflect the daily normal highs, lows and averages.
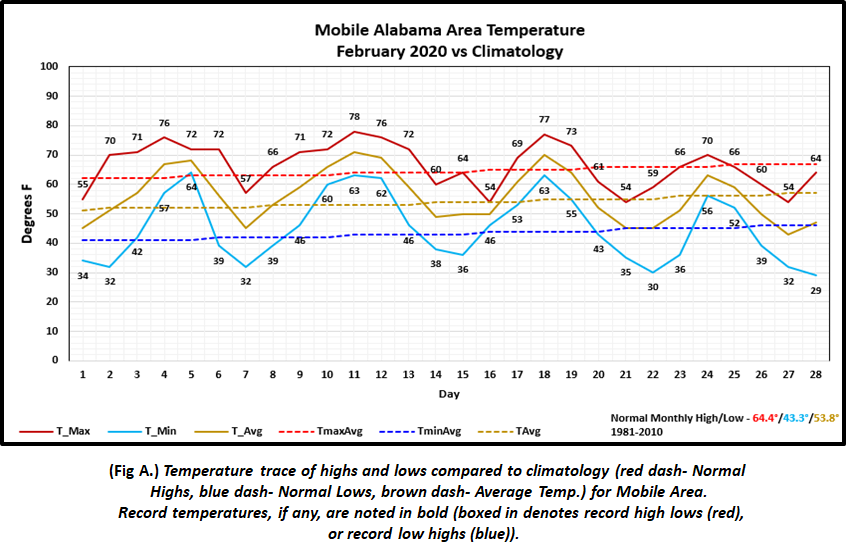
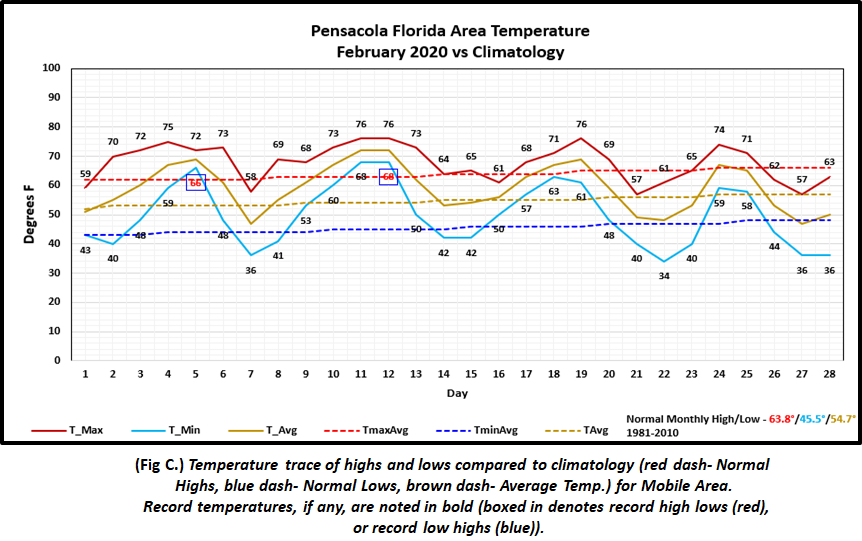
February 2020 in Review - An interesting distribution in highs and lows occurred, resembling a sine wave curve with peaks and valleys occurring around every 4 days. Monthly temperatures were closer to seasonal normal overall for the Mobile area, averaging 1.7°above seasonal while the Pensacola area temperatures averaged a greater departure, 4.0° above normal. Two record low temperatures were observed at Pensacola and no temperature records for Mobile. Monthly total rainfall was close to normal for Mobile, but drier at Pensacola with monthly deficits just over two inches shy of normal there.
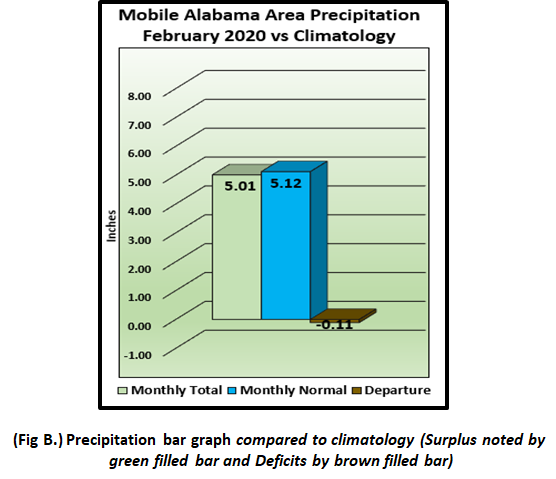
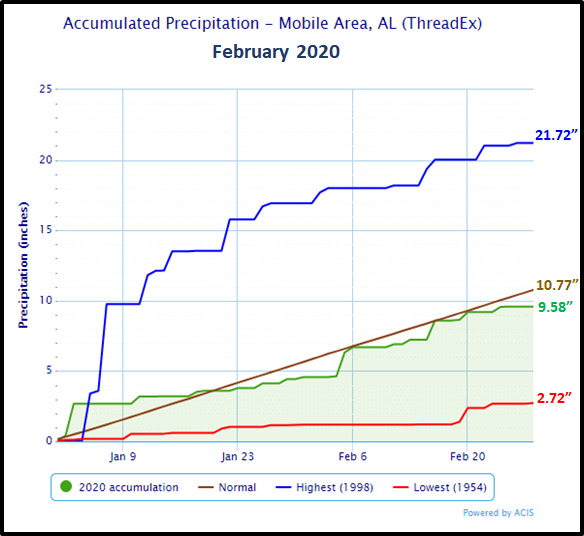
Mobile Alabama Area - The average monthly high of 66.5° was 2.1° above normal. The average monthly low of 44.5° was 1.2° above normal. The average monthly temperature of 55.5° was 1.7° above normal. (Fig. A) shows how the Mobile area temperatures compared to the daily normal highs and lows, which are shown by the colored dashed lines. Total rainfall for February (Fig. B) measured 5.01" or 0.11" below normal. A precipitation trace for the Mobile area is provided in the graphics below.
Click on the Mobile Alabama area climate graphics below to expand:
|
|
|
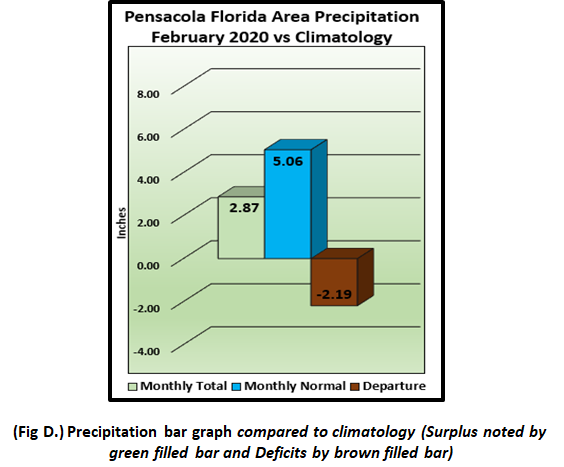
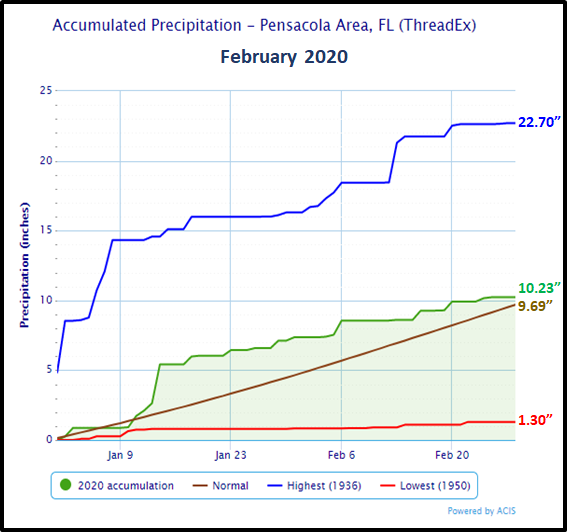
Pensacola Florida Area - The average monthly high of 67.9° was 4.1°above normal. The average monthly low of 49.4° was 3.9° above normal. The average monthly temperature of 58.7° was 4.0° above normal. Two record high low temperatures were set. 66° on the 5th tied the previous record for this date set in 2008 and 68° on the 12th broke the previous record of 67° set on this date in 2017. (Fig. C) shows how the Pensacola area temperatures compared to the daily normal highs and lows, which are shown by the colored dashed lines. Total rainfall for February (Fig. D) measured 2.87" coming in well above normal by 2.19". A precipitation trace for the Pensacola area is provided in the graphics below.
Click on the Pensacola Florida area climate graphics below to expand:
|
|
|
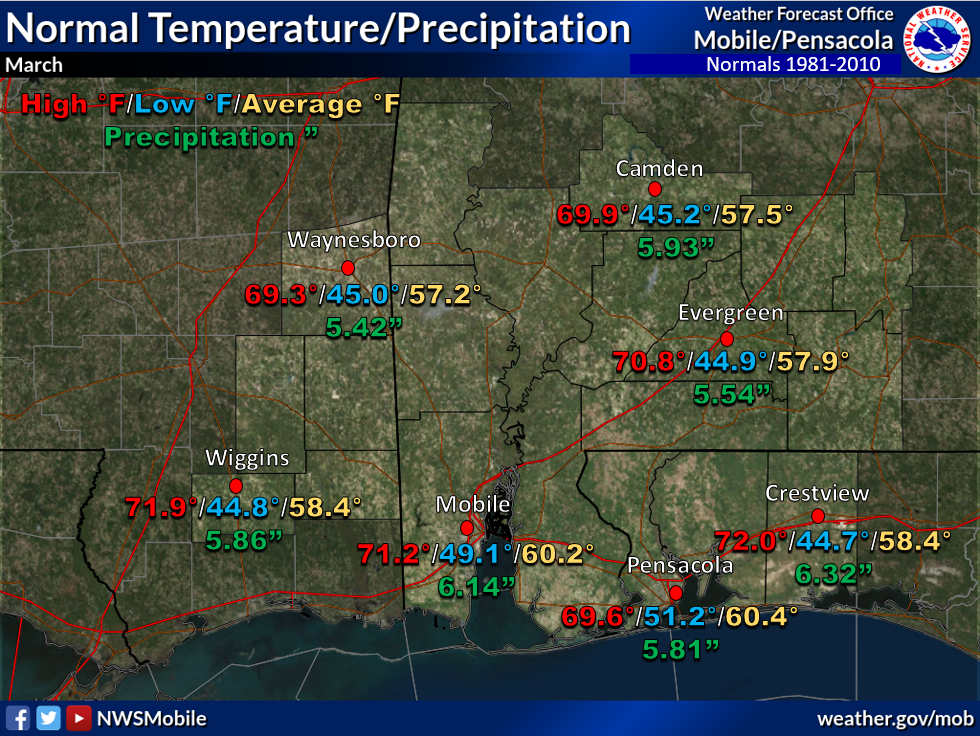
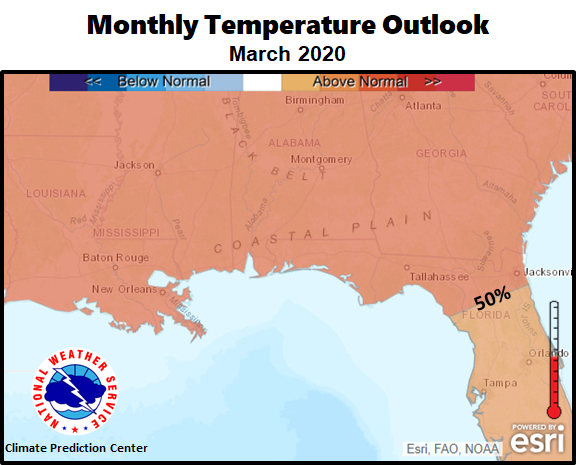
March Climatology and Outlooks:
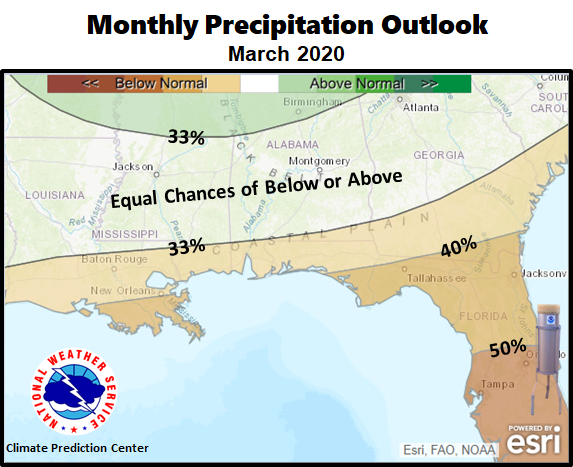
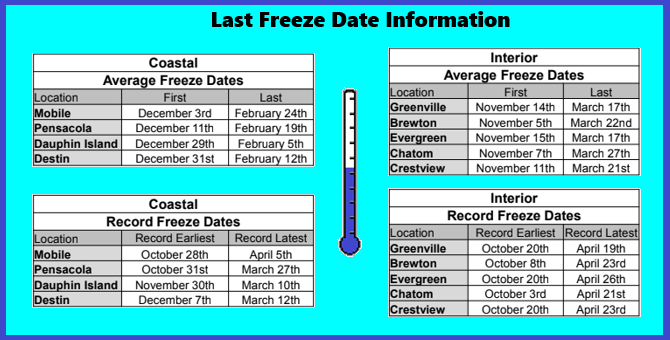
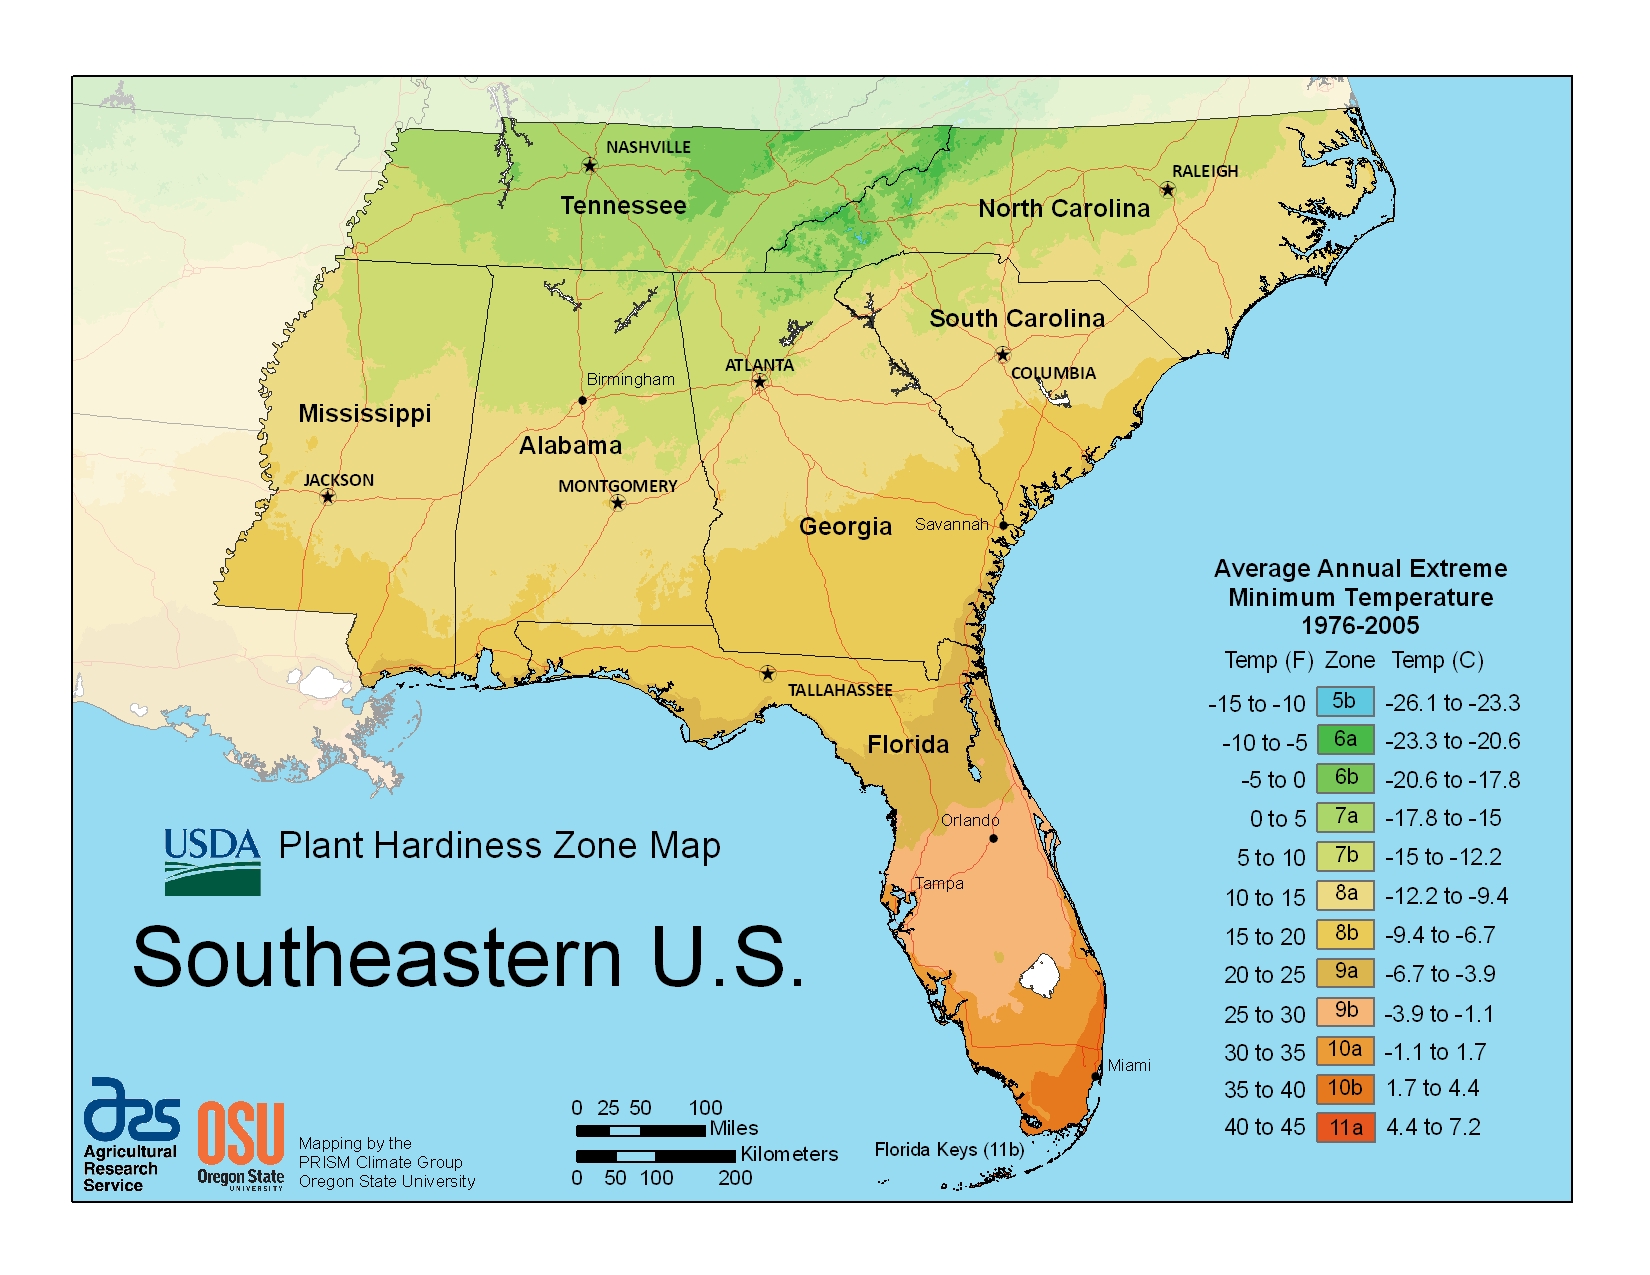
The latest monthly outlook for the month of March favors a 50% probability or higher of above normal temperatures for most of the southeast US. Drier than normal conditions favored from coastal Louisiana, eastward to the Florida Peninsula. Equal chances of above or below normal precipitation is outlooked over the interior. It's about that time when coastal gardeners are planning on starting their spring gardens and the National Weather Service in Mobile has provided a break-out in the snap shots below of the typical last freeze dates of occurrence over the central Gulf coast. A plant hardiness map from the USDA is also provided.
Click on the snap shots below to expand:
|
Outlook |
Outlook |
|
|
|
Climate Prediction Center's Interactive Long Range Outlooks
Additional Climate Links:
The links below are intended to provide additional climate information, education and outlooks. The National Weather Service Mobile Alabama's Climate and Past Weather page provides climate data at your fingertips for many observation points in the local forecast area by accessing the NOWData tab as well as many other climate resources. The Climate Prediction Center Link provides short and longer range climatic outlooks and education about the larger scale global circulations that impact temperatures and weather. With the large agriculture and farming presence along the central Gulf coast, the Drought Monitor link provides updates on drought trends and impacts. Another very helpful resource is the Community Collaborative Rain Hail and Snow (CoCoRaHS) network, which is a large group of volunteers working together to measure and map precipitation (rain, hail and snow). The aim of CoCoRaHS is to provide the highest quality data for natural resource, education and research applications. You can be a part of the CoCoRaHS team by becoming a volunteer rainfall observer. To learn more click on the CoCoRaHS link below.
National Weather Service Mobile AL Climate and Past Weather
Climate Prediction Center (CPC)
CoCoRaHS Network Water Year Summaries