
Hurricane Ida
November 10, 2009
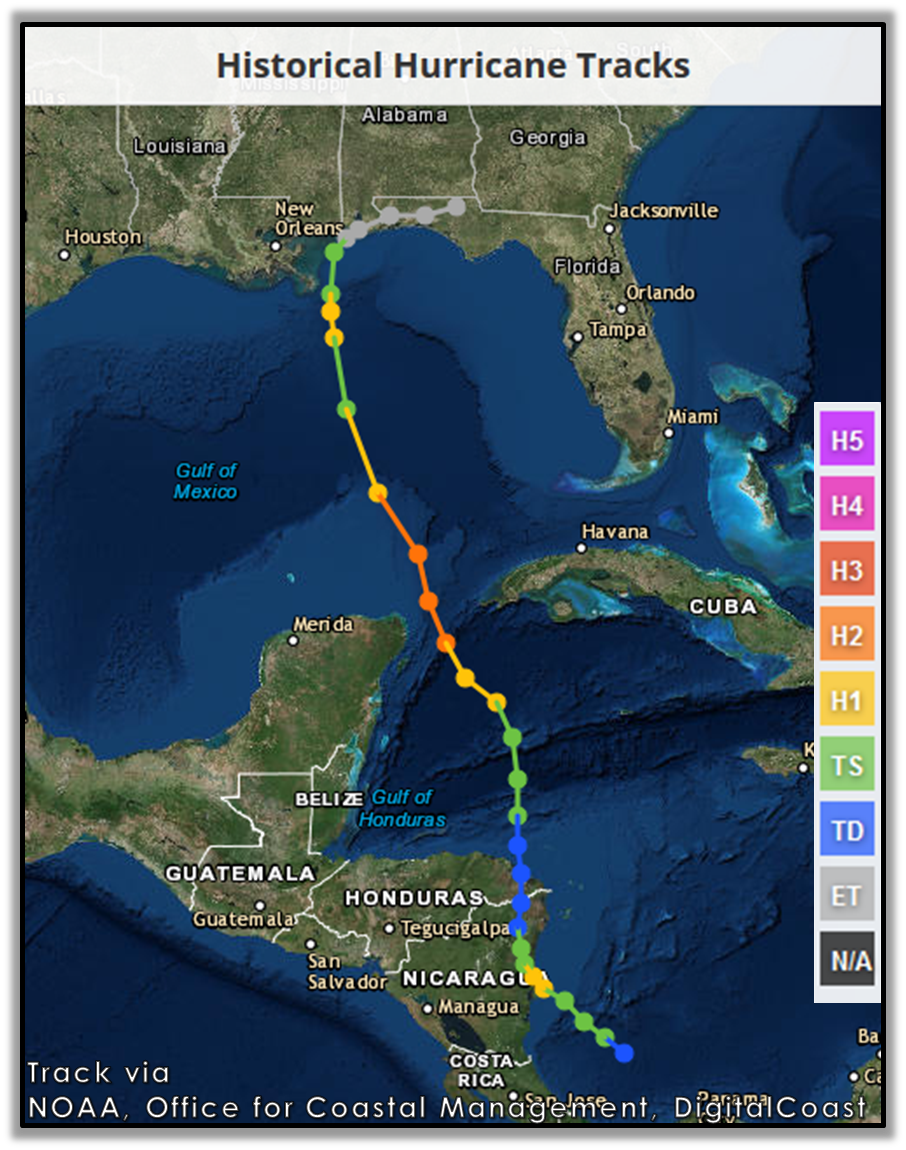 Ida formed into a tropical depression in the southwestern Caribbean Sea on November 4, 2009. It achieved hurricane intensity twice and Category 2 intensity once prior to moving through the Yucatan Straights and into the southern Gulf on the 8th of November. Hurricane Ida reached a peak intensity of 105mph on Sunday evening (November 8) while over the southern half of the Gulf. After that time, Hurricane Ida encountered very strong vertical wind shear north of 25.0N latitude and much cooler sea surface temperatures, which prevented further intensification. Ida responded by gradually weakening and filling in before approaching the northern Gulf Coast on the 10th of November.
During the early morning hours of November 10th, 2009, Tropical Storm Ida made its first landfall near Dauphin Island in Mobile County, AL at approximately 540am. Maximum sustained winds were approximately 45mph with locally higher gusts during this first landfall. The full track of Hurricane Ida can be seen in the image to the right (courtesy of NOAA, Office for Coastal Management, DigitalCoast).
Ida made yet another landfall around 7am just northwest of Bon Secour in Baldwin County, AL after slowly crossing over the southern part of Mobile Bay. Radar imagery around the time of the first and second landfall can be seen in the side-by-side imagery below. Ida became extratropical later that morning (losing its tropical characteristics) as it moved off to the northeast at 9mph.
Impacts from the wind and storm surge were relatively minimal along both the Alabama and northwest Florida coastlines. However, surface winds became quite gusty after Ida moved well away from the region and a high pressure system began to sweep in from the west the evening after landfall.

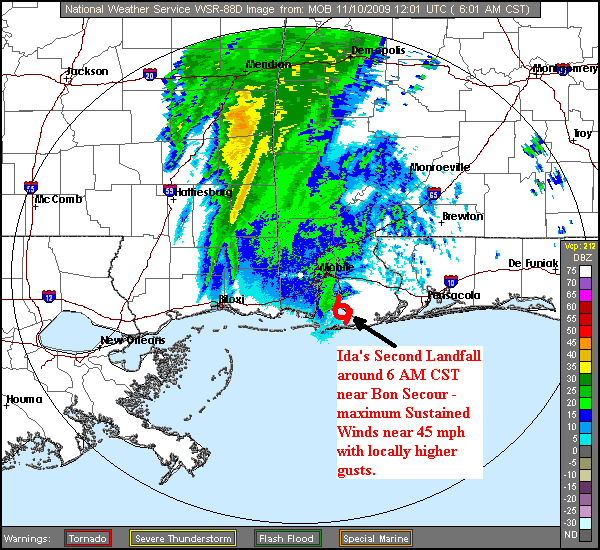
Radar imagery around the time of Ida's 1st landfall (left) and 2nd landfall (right) along the Alabama coast.
Making landfall as a minimal tropical storm will NOT be what Hurricane Ida is remembered for - Ida was the 2nd latest hurricane (on record) to develop so late in the hurricane season and make landfall along the northern Gulf Coast (until this record is eclipsed in the future). In 1985, Hurricane Kate made landfall as a Category 1 Hurricane near Mexico Beach, FL on November 21st.
The majority of this document will focus on the impacts from Tropical Storm Ida. Below are some of the regional impacts...
Jump to - Rainfall, Wind, Storm Surge, or Additional Information sections.
 Since Ida was weakening and filling in as it approached the region and even while it made landfall across the area, rainfall amounts were not extraordinarily high for this tropical system (in comparison to past tropical cyclones that made landfall across the region). In general, rainfall totals across the area were in the 3-6 inch range based on radar estimates. The CoCoRaHS observer near Foley, AL (Baldwin County) measured 6.61 inches of rain in the 2-day period ending on November 11th, which was the highest amount observed across the area. The highest amounts were observed further north of the region as the cyclone further decayed.
Widespread street flooding was noted in all coastal counties due to the heavy rainfall in Ida. The table below contains the storm total rainfall reports greater than 3.99 inches. The CoCoRaHS rainfall data are a 2-day total ending 6 am on November 11. The remainder of the rainfall data are for a 24-hour period ending at the same time, which still captures the event due to the timing and cessation of the rain across the region. The data in the table below are categorized by the source of the data report (e.g. CoCoRaHS, ASOS, DCP, and NWS COOP reports).

Again, since Ida was weakening and filling in as it made landfall across the area, wind speeds were not very high in comparison to past storms that impacted the region. The table below shows the peak and sustained wind speed data ending 7am on November 11, 2009. The data are presented in descending order based on the day of the observation. "N/A" indicates the data was not available.
| Location - Source | Maximum Sustained Wind (kt) |
Peak Wind Gust (kt) | Peak Wind Gust Time (CST) |
| November 9th | |||
| Dauphin Island, AL Bridge - Skywarn | N/A | 54 | 1040 PM |
| Petit Bois Island, AL - NOAA Ports | 40 | 51 | 1018 PM |
| Buoy 42012 (12 S Orange Beach) - NWS | 38 - 10 min | 49 | 656 PM |
| Dauphin Island, AL - NOAA Ports | 35 | 44 | 542 PM |
| Dauphin Island, AL C-MAN (DPIA1) - NWS | 30 - 10 min | 42 | 723 PM |
| Destin, FL (DTS) - ASOS | 28 - 2 min | 39 | 1129 PM |
| Gulf Shores, AL (JKA) - AWOS | 24 - 2 min | 38 | 700 PM |
| Pensacola, FL (PNS) - ASOS | 27 - 2 min | 38 | 1150 PM |
| Brookley Field, AL (BFM) - ASOS | 27 - 2 min | 34 | 1104 PM |
| Valparaiso, FL (VPS) - ASOS | 21 - 2 min | 34 | 859 PM |
| Fairhope, AL (K4R4)- AWOS | 20 | 33 | 7 PM |
| Evergreen, AL (GZH) - ASOS | 20 - 2 min | 27 | 1102 PM |
| November 10th | |||
| Fort Morgan, AL - NOAA Ports | 40 | 46 | 730 AM |
| West Mobile, AL Bates Field (MOB) - ASOS | 30 - 2min | 41 | 105 AM |
| NAS Pensacola, FL (NPA) - ASOS | 29 - 2 min | 37 | 132 AM |
| Middle Bay Lighthouse - USA Mesonet | N/A | 36 | 8 AM |
| Mary Esther, FL (HRT) - ASOS | 21 - 2 min | 35 | 118 AM |
| USCG on Mobile Bay - NOAA Ports | 24 | 32 | 1 AM |
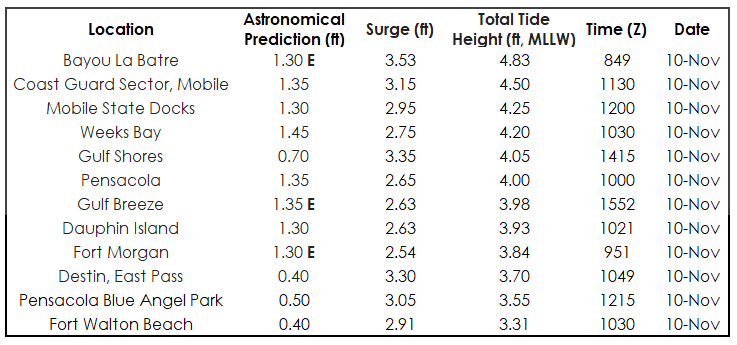
 Coastal flooding and beach erosion due to storm surge were widespread across the Alabama and northwest Florida coastline. Even though Ida was weakening as it made landfall along the Alabama coast, storm surge was 3-6 feet across the area. The highest total tide height across our coastline was in Bayou La Batre, AL (near the second landfall) with a height of 4.83 feet (MLLW). Storm surge caused minor beach erosion across the beaches in Alabama and northwest Florida. The image to the right shows storm surge damage in Fairhope, AL (courtesy of the Press-Register, John Davide Mercer).
The table below displays the total tide height in feet and the estimated storm surge effects on November 10, 2009. FYI - Total Tide Height is composed of the astronomical prediction plus Tropical Storm Ida's surge effects in feet. All values are referenced to Mean Low Low Water (MLLW). "E" means that the values are estimated from closest station with a tidal prediction for that hour. The data are presented in descending order with respect to total tide height (MLLW).
NHC Advisory Archive
WPC Archive
NHC Tropical Cyclone Report - Hurricane Ida
NWS Local Write-Ups and Webpages:
NWS Birmingham
NWS Tallahassee
Acknowledgements: Page created by Jeff Medlin (Meteorologist In Charge), Ray Ball (Information Technology Officer), Jeff Garmon (previous Warning Coordination Meteorologist) and Kirk Caceres (former forecaster). Page updated by Morgan Barry (forecaster).
LAST UPDATED: September 2021

