July 2020 Climate Summaries
Mobile Alabama and Pensacola Florida Area
National Weather Service Mobile Alabama
August 6, 2020
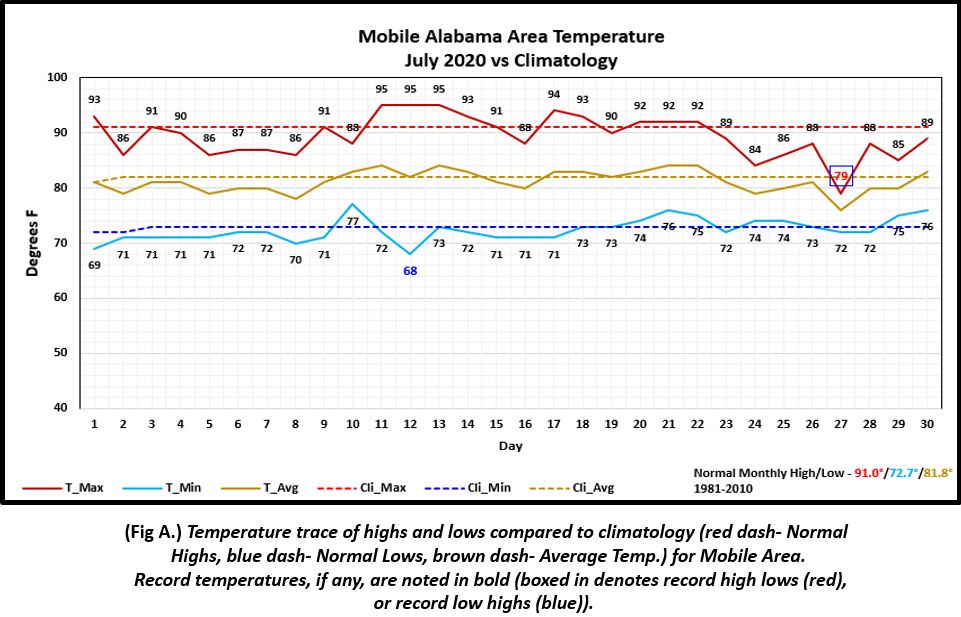
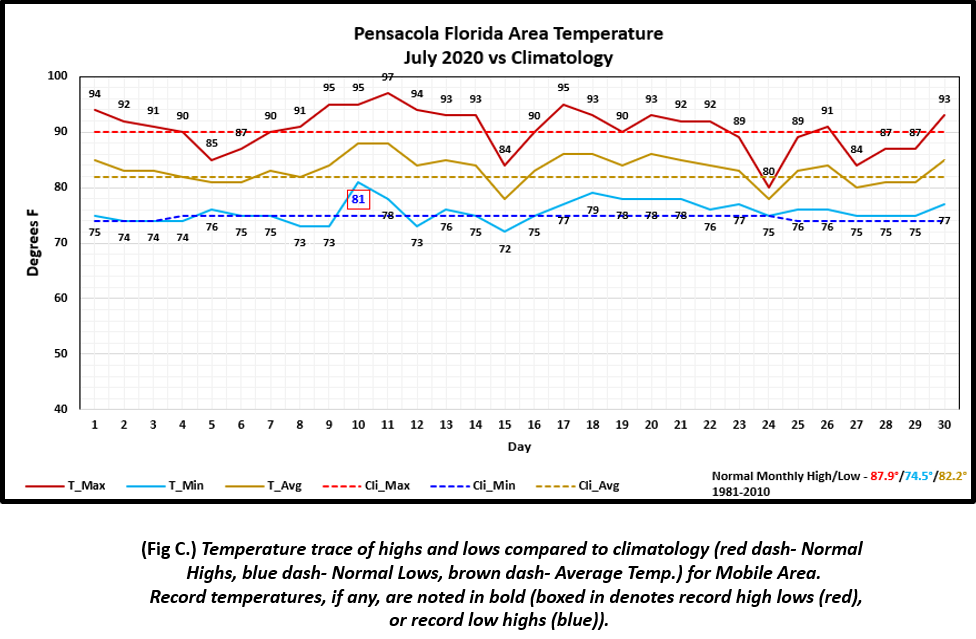
July 2020 in Review - Although there was one day that a record low was reached earlier in the month, the low temperature profile for the Mobile area trended very close to normal. High temperatures, on the other hand, showed more fluctuation with a notable, more established dip to well below normal values the final week as a more steady state, cloudy wet pattern evolved. During this period, a record low high temperature was broken. For the Pensacola area, three periods of sharp v-shaped declines occurred in high temperatures during the first, middle, and latter end of the month. Similar to Mobile, low temperatures for the most part were close to normal at Pensacola. Only one record record high low temperature was reached the first portion of the month. July 2020 was a wet month with the rain gauge reporting above normal rain amounts at just shy of nine inches at both Mobile and Pensacola.
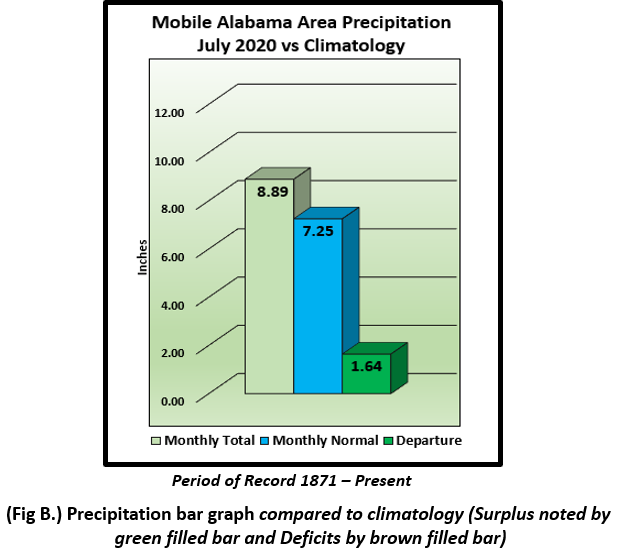
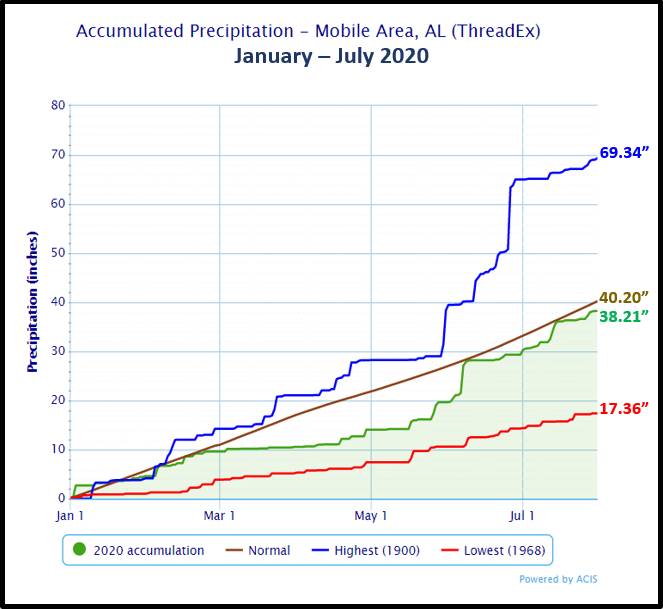
Mobile Alabama Area [Climate Normal Period 1981-2010, Climate Record Period 1872 to Present]- The average monthly high of 89.5° was 1.5° below normal. The average monthly low was 72.6° or 0.1° below normal. The average monthly temperature of 81.0° was 0.8° below normal. The highest temperatures for the month, 95°, occurred on the 11th, 12th, and 13th. The lowest temperature of 68° occurred on the 12th, which in tied a record low which previously occurred on this date back in 1957. A new record low high temperature of 79°, occurring on the 27th, broke the previous record of 80° set on this date way back in 1908. (Fig. A) shows a graphical representation of how the Mobile area temperatures compared to the seasonal normal monthly highs and lows, which are shown by the colored dashed lines. No record temperatures were observed this month. Total rainfall for July (Fig. B) measured 8.89" or 1.64" above normal. A precipitation trace for the Mobile area since January 1st is provided in the graphics below showing how it compares to normal year to date totals. Due to the wet month and above normal rainfall, the gap in the annual rainfall deficit continued to close. Annual rainfall, now up to 38.21", is now 1.99" below normal.
July's top records for the month during the Period of Record for the Mobile Area:
Click on the Mobile Alabama area climate graphics below to expand:
|
|
|
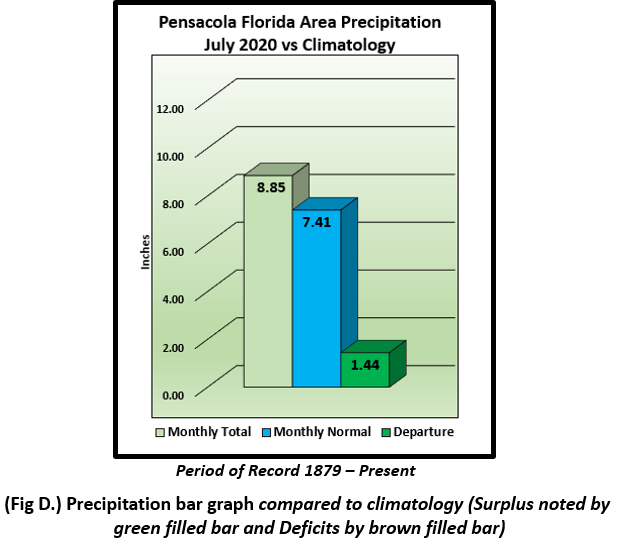
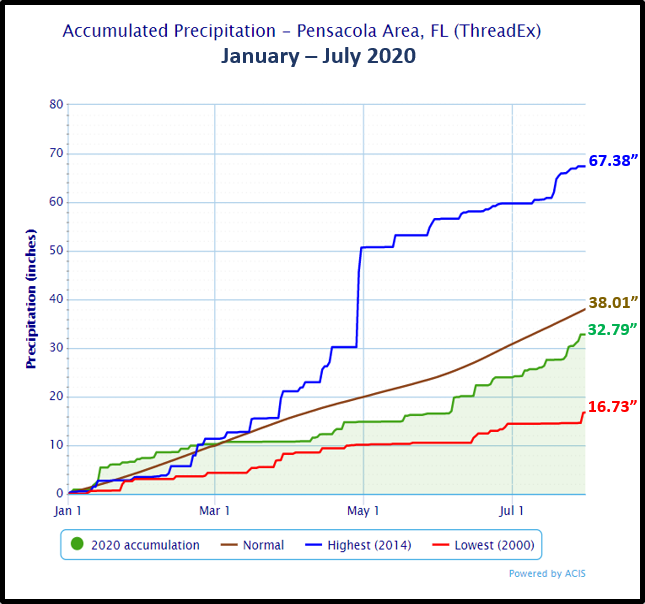
Pensacola Florida Area [Climate Normal Period 1981-2010, Climate Record Period 1879 to Present] - The average monthly high of 90.6° was 2.7° above normal. The average monthly low of 75.8° was 1.3° above normal. The average monthly temperature of 83.2° was 1.0° above normal. The highest temperature for the month was 97°, occurring on the 11th. A record high low temperature of 81° occurred on the 10th and tied the previous occurrence on this date set in 1970. A few days later, the lowest temperature for the month, 72°, occurred on the 15th. (Fig. C) shows a graphical representation of how the Pensacola area temperatures compared to the seasonal normal monthly highs and lows, which are shown by the colored dashed lines. Total rainfall for July (Fig. D), measured 8.85" or 1.44" above normal. A precipitation trace for the Pensacola area is provided in the graphics below showing how it compares to normal year to date totals. The Pensacola area annual rainfall stands at 32.79", and is short of normal by 5.22".
July's top records for the month during the Period of Record for the Pensacola Area:
Click on the Pensacola Florida area climate graphics below to expand:
|
|
|
August Climatology and Outlooks:
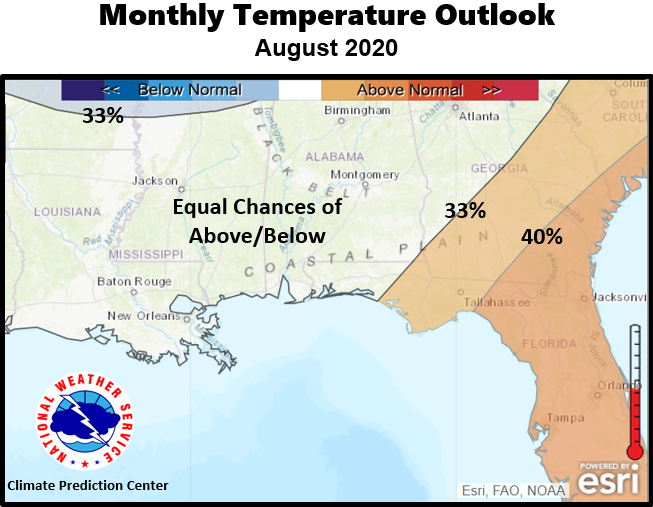
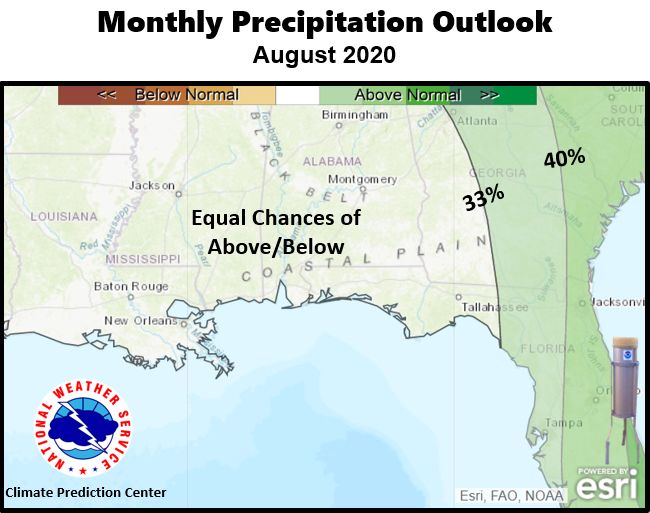
The latest monthly outlook favors a warmer than normal and wetter than normal pattern over the southeast US. Just to the west, over the coastal plain, equal chances of above or below normal temperatures and precipitation are favored. We are now entering the climatological peak of the Atlantic Basin Hurricane Season. At time of this writing, a very busy season has been unfolding with nine named storms thus far. NOAA released its updated forecast August 6th and urges preparedness as it calls for an "Extremely Active" hurricane season yet to come. Refer to the following link for more specific details on the outlook. Below, additional graphics have been added highlighting tropical climatology favored storm points of origin and distribution of occurrence.
Click on the snap shots below to expand:

|
Outlook |
Outlook |
|
|

|
Climate Prediction Center's Interactive Long Range Outlooks
Additional Climate Links:
The links below are intended to provide additional climate information, education and outlooks. The National Weather Service Mobile Alabama's Climate and Past Weather page provides climate data at your fingertips for many observation points in the local forecast area by accessing the NOWData tab as well as many other climate resources. The Climate Prediction Center Link provides short and longer range climatic outlooks and education about the larger scale global circulations that impact temperatures and weather. With the large agriculture and farming presence along the central Gulf coast, the Drought Monitor link provides updates on drought trends and impacts. Another very helpful resource is the Community Collaborative Rain Hail and Snow (CoCoRaHS) network, which is a large group of volunteers working together to measure and map precipitation (rain, hail and snow). The aim of CoCoRaHS is to provide the highest quality data for natural resource, education and research applications. You can be a part of the CoCoRaHS team by becoming a volunteer rainfall observer. To learn more click on the CoCoRaHS link below.
National Weather Service Mobile AL Climate and Past Weather
Climate Prediction Center (CPC)
CoCoRaHS Network Water Year Summaries