
Tropical Storm Lee Drenches the Northern Gulf Coast
September 2011
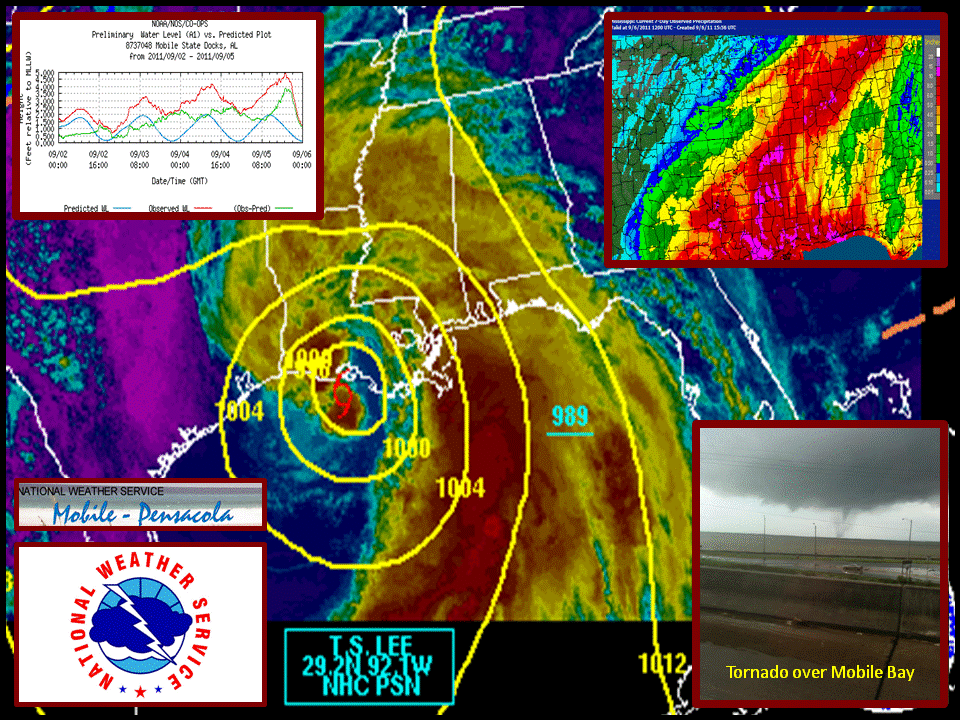 Tropical Storm Lee began as a deep convective cloud mass associated with a tropical wave in the Caribbean Sea during the last week of August. By Thursday evening (September 1st, 2011), the cloud mass further developed into Tropical Depression #13. By 1pm on that following Friday afternoon, Tropical Storm Lee had formed.
Lee gradually churned northward exceedingly slow towards south central Louisiana coastline by Saturday afternoon (September 3rd), while continuing to produce extremely heavy rainfall over portions of southern Mississippi, southern Alabama and the northwest Florida Panhandle. The outer rainbands of Lee began dumping near continuous heavy rainfall over portions of southern Alabama, southeastern Mississippi and the northwestern Florida Panhandle by early Saturday morning. This rainfall endured through early Sunday before dry air wrapped into Lee’s west side.
The center of Lee moved over land around sunrise Sunday, September 4th. However, it would be a while before Lee would weaken to a depression as it remained nearly stationary while the southern half of the circulation was over water where it could continue to derive additional energy from the warm ocean. The next day, Lee was eventually picked up by an upper level trough, turned northeastward and sped up late in the day on Sunday, September 4th as it began its exit to the northeast (late Sunday through late Monday). Below and to the right is an animation of the 6-hour analyses of the evolution of Tropical Storm Lee from 7pm on September 1st through 1am on September 6th in 2011 (images courtesy of the NWS Weather Prediction Center).
 Although the continuous rains became somewhat intermittent as dry air wrapped into Lee from the west, this created a situation from Sunday afternoon through midday Monday whereby individual storms became more intense due to increasing levels of atmospheric instability. Stronger storms and tornadoes plagued the northern Gulf Coast as they formed within the detached outer rainbands (well to the east of Lee’s center) on Sunday and finally to the southeast on Monday.
Lee would give its final blow to our region, literally. While Lee was in the process of being picked up by a fast moving upper level trough, a series of squall lines that produced moderately widespread wind damage and tornadoes along and ahead of the surface cold front, besieged the area through late Monday afternoon.
Lee’s impacts were far reaching across the region. Below are some of the regional impacts...
Jump to - Rainfall, Wind, Tornadoes, Storm Surge, or Additional Information sections.
Lee’s high moisture content and slow speed promoted 24-hour rainfall totals in excess of 5 inches across much of the area. In general 10-15 inches of rain (storm total) fell along coastal sections of Alabama and northwest Florida. Radar estimated 24-hour and storm total rainfall associated with Tropical Storm Lee can be viewed in the animation alongside the storm total rainfall below
.
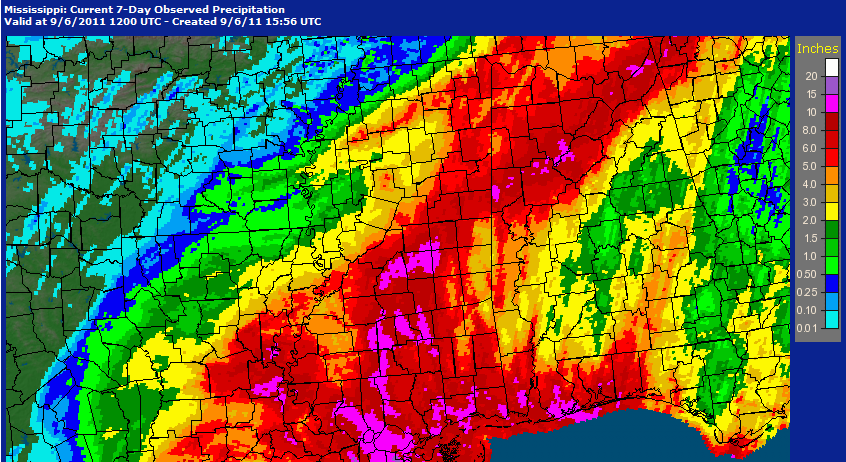
The table below shows the storm total rainfall amounts (greater than 7 inches) across the region starting on September 2nd and ending at 7am on September 6th. There are numerous local reports over 10 inches and even 2 reports in Mobile County that recorded over 12 inches of rainfall during Tropical Storm Lee (in both Mobile and Tillmans Corner).
|
Location |
Storm Total Rainfall (in.) |
Source |
| Mobile 10.2 WSW | 12.62 | CoCoRaHS |
| Tillmans Corner 4.3 WNW | 12.17 | CoCoRaHS |
| Robertsdale, AL | 11.82 | NWS COOP |
| Grand Bay 0.6 NW | 11.70 | CoCoRaHS |
| Theodore 3.7 WNW | 11.58 | CoCoRaHS |
| Mobile 11.4 WSW | 11.30 | CoCoRaHS |
| Mobile, AL, Bates Field | 11.30 | NWS |
| Coden, AL | 11.25 | NWS COOP |
| Milton 1.4 NNE | 11.04 | CoCoRaHS |
| Mobile, AL (KMOB) | 10.94 | ASOS |
| Orange Beach 3.0 ENE | 10.83 | CoCoRaHS |
| Mobile 5.7 WSW | 10.68 | CoCoRaHS |
| Mobile 0.2 N | 10.61 | CoCoRaHS |
| Foley 7.4 SW | 10.60 | CoCoRaHS |
| Foley 2.0 SSW | 10.56 | CoCoRaHS |
| Mobile 7.4 W | 10.56 | CoCoRaHS |
| Elberta 3.1 SSW | 10.39 | CoCoRaHS |
| Orange Beach 2.1 NE | 10.26 | CoCoRaHS |
| Foley 6.2 SW | 10.22 | CoCoRaHS |
| Foley 0.5 ESE | 10.21 | CoCoRaHS |
| Mobile 2.6 WNW | 9.92 | CoCoRaHS |
| Black Creek, MS | 9.88 | River Gage |
| Wilmer 7.9 SE | 9.54 | CoCoRaHS |
| Orange Beach 1.3 E | 9.50 | CoCoRaHS |
| Wiggins 5.8 E | 9.34 | CoCoRaHS |
| Mobile 1.2 WSW | 9.18 | CoCoRaHS |
| Wiggins 5.5 ENE | 9.17 | CoCoRaHS |
| Perkinston 1.7 NE | 9.00 | CoCoRaHS |
| Mobile 4.7 W | 8.99 | CoCoRaHS |
| Mobile 1.8 W | 8.91 | CoCoRaHS |
| Crestview 2.8 NNW | 8.82 | CoCoRaHS |
| Whiting Field, FL (KNSE) | 8.72 | ASOS |
| Point Clear 1.6 SSW | 8.71 | CoCoRaHS |
| Mobile 5.1 S | 8.49 | CoCoRaHS |
| Milligan, FL | 8.47 | River Gage |
| Mobile 4.4 WNW | 8.42 | CoCoRaHS |
| Theodore 6.7 SSE | 8.42 | CoCoRaHS |
| Loxley 0.4 SSW | 8.23 | CoCoRaHS |
| Saraland 1.4 E | 8.19 | CoCoRaHS |
| Grand Bay 3.1 NNE | 8.15 | CoCoRaHS |
| Theodore 8.0 SSE | 8.08 | CoCoRaHS |
| Fairhope 0.9 N | 7.99 | CoCoRaHS |
| Wiggins, MS | 7.93 | NWS COOP |
| Navarre 2.1 WNW | 7.91 | CoCoRaHS |
| Crestview 2.5 SSW | 7.91 | CoCoRaHS |
| Navarre 2.3 NNW | 7.86 | CoCoRaHS |
| Leakesville, MS 3NW | 7.84 | River Gage |
| Milton 10.9 SSW | 7.82 | CoCoRaHS |
| Milton, FL | 7.77 | River Gage |
| Niceville 4.5 SE | 7.75 | CoCoRaHS |
| Fairhope 1.5 WSW | 7.73 | CoCoRaHS |
| Fairhope 2.3 E | 7.72 | CoCoRaHS |
| Fairhope 2.3 N | 7.59 | CoCoRaHS |
| Melvin, AL | 7.40 | River Gage |
| Lucedale 13.1 SE | 7.38 | CoCoRaHS |
| Fairhope 3.1 NNW | 7.29 | CoCoRaHS |
| Niceville 5.6 SE | 7.26 | CoCoRaHS |
| Waynesboro, MS | 7.24 | NWS COOP |
| Pensacola 4.8 N | 7.18 | CoCoRaHS |
| Gulf Breeze 7.9 ENE | 7.18 | CoCoRaHS |
| Dauphin Island, AL | 7.17 | NWS COOP |
| Fairhope, AL | 7.13 | NWS COOP |
| West Pensacola 10.9 SW | 7.12 | CoCoRaHS |
| Niceville 3.4 ESE | 7.11 | CoCoRaHS |
| Fairhope 3.7 NNW | 7.05 | CoCoRaHS |
Lee caused significant, yet localized wind damage across Mobile and Baldwin Counties in southwest Alabama. Numerous houses sustained minor to major wind damage along with downed trees throughout the area. Strong winds resulted in blowing sand from the beaches onto the streets across many of the coastal communities.
A consolidated list of peak wind gusts (10 meter) and 2-minute sustained winds from September 5th are listed below. The data are presented in descending order according to the peak wind gust. If data are missing, they are not currently available.
|
Location
|
Peak Wind Gust (mph) and Direction
|
Time (CST)
|
Sustained Wind (mph) and Direction
|
Time (CST)
|
| Hurlburt Field, FL at runway 36 /FMQ-19 | 65 | 1031 | ||
| AL DOT I-10 Bayway Exit 30 | 65 | 0725 | ||
| Duke Field, FL (KEGI) ASOS | 63 | 1424 | ||
| Dauphin Island,AL C-MAN (DPIA1) | 63 from 180° | 0928 | 40 from 170° | 0854 |
| Pensacola ,FL Regional (KPNS) ASOS | 59 from 200° | 1047 | 43 from 190° | 1047 |
| Destin, FL (KDTS) ASOS | 59 from 200° | 1136 | 32 from 180° | 1216 |
| Mobile, AL Brookley Field, (KBFM) ASOS | 55 from 320° | 1542 | 41 from 320° | 1543 |
| Ensley, FL - Trained storm spotter | 55 | 1201 | ||
| Hurlburt Field, FL (KHRT) ASOS | 55 | 1033 | ||
| Brent, FL - Trained storm spotter | 53 | 1149 | ||
| NAS Pensacola, FL (KNPA) ASOS | 53 from 210° | 1140 | 37 from 200° | 1256 |
| Mobile, AL Regional (KMOB) ASOS | 48 from 200° | 0703 | 35 from 200° | 0701 |
| Crestview Sikes,FL (KCEW) ASOS | 46 from 200° | 1349 | 31 from 190° | 1349 |
| Dauphin Island (USA Mesonet) | 44 from 200° | 0816 | 48 from 190° | 0813 |
| Fairhope, AL (USA Mesonet) | 36 from 330° | 1658 | 37 from 320° | 1657 |
| Jay, FL (USA Mesonet) | 36 from 190° | 1317 | 49 from 185° | 1316 |
| Elberta, AL (USA Mesonet) | 33 from 170° | 0529 | 39 from 180° | 1021 |
| Grand Bay, AL (USA Mesonet) | 32 from 190° | 0744 | 37 from 130° | 1712 |
| Walnut Hill, FL (USA Mesonet) | 32 from 175° | 1311 | 42 from 170° | 1309 |
| Andalusia, AL (USA Mesonet) | 30 from 210° | 1213 | 37 from 200° | 1127 |
| Loxley, AL (USA Mesonet) | 31 from 170° | 1312 | 38 from 170° | 1319 |
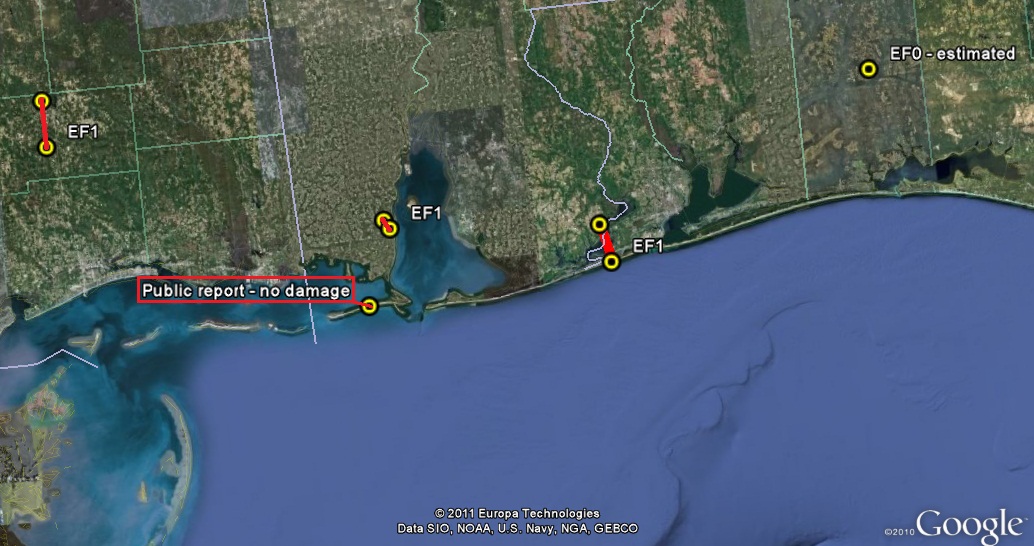
 Tropical Storm Lee produced several weak tornadoes across the entire region resulting in modest structural and tree damage. The 24 hour storm reports from September 2nd through 5th can be viewed in the animation to the right (imagery courtesy NWS Storm Prediction Center). Tornado reports are in red, while damaging severe thunderstorm wind reports are in blue in the animation.
The individual tornado paths associated with Tropical Storm Lee from September 2nd through 6th are plotted in our local Tornado Museum webpage.
There was moderate beach erosion due to the storm surge in Tropical Storm Lee. Coastal flooding was exacerbated by higher tide levels, which created poor to no drainage of local rivers, bays and sounds. The highest total tide levels (storm surge + tide) ranged from 3.5-5 feet.
Area tide gauge observations versus astronomical tidal predictions (referenced to MLLW, mean lower low water) can be viewed in the animation below. The animation starts with locations furthest to the west and progresses to the east.
NHC Advisory Archive
WPC Archive
NHC Tropical Cyclone Report - Tropical Storm Lee
NWS Local Write-Ups and Webpages:
NWS Jackson, MS
NWS Birmingham
NWS Huntsville
NWS Peachtree City, GA
NWS State College, PA
Acknowledgements: Page created by Jeff Medlin (Meteorologist In Charge), Ray Ball (Information Technology Officer), Jeff Garmon (previous Warning Coordination Meteorologist), Jason Beaman (Warning Coordination Meteorologist), Gene Jacobi (Observing Program Leader), John Werner (Senior Meteorologist), Joe Maniscalco (Forecaster), and Kirk Caceres (previous Forecaster). Page updated by Morgan Barry (Forecaster).
LAST UPDATED: November 2016

