Killer Flooding in Carter County of Extreme East Tennessee
by
Steve Hunter and Brian Boyd
1. Introduction
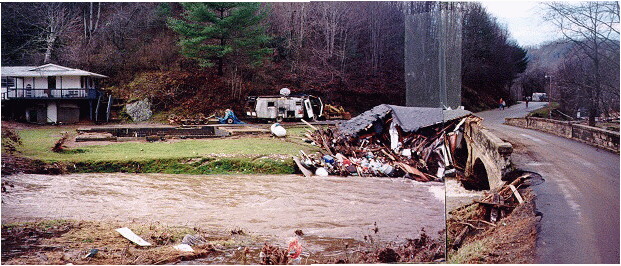
- A powerful winter storm brought widespread flooding to East Tennessee (TN) and western North Carolina (NC) overnight from January 7th through 8th, 1998. The hardest hit area was in the rugged Appalachian mountains of Carter County TN, where seven people lost their lives. For an orientation map of the region, see Fig. 1. Over 200 mobile homes and 15 houses were demolished; 193 other houses or structures and 6 businesses were damaged. The flood occurred along the upper Doe River, with the communities of Roan Mountain, Hampton, and Valley Forge afflicted. A preliminary estimate of loss was put at $20 million.
- The National Weather Service (NWS) Forecast Office in Memphis issued a flash flood watch at 3:31 PM EST (8:31 PM UTC), on the 7th for parts of east Tennessee, including Carter County. NWS Knoxville Tri-Cities issued a flash flood warning for Carter County at 9:18 PM on the 7th. Fatalities occurred between 12:30 and 2:00 AM on the 8th, giving around three hours lead time for the warning.
- Six of the 7 deaths were associated with (two separate) vehicles attempting to make water crossings. This reiterates the danger of driving across high water. The last fatality was an emergency rescue member whose boat capsized during a rescue attempt.
2. Meteorological Setting
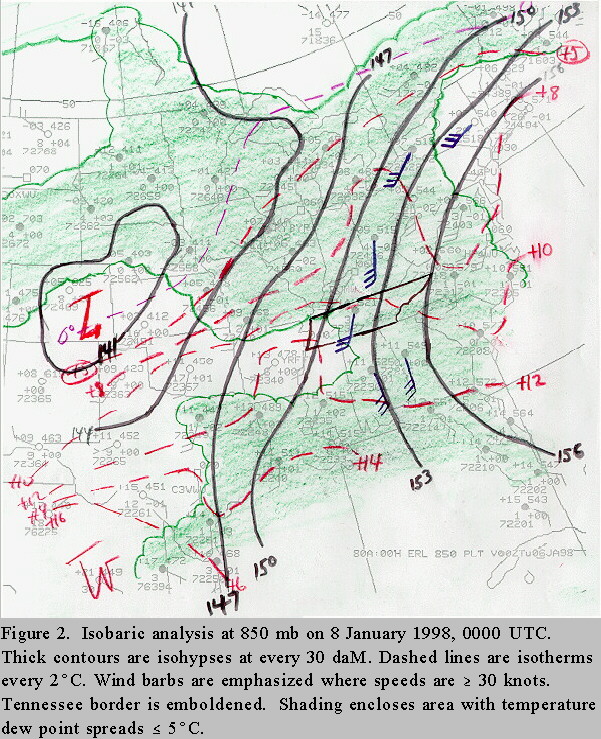
- The storm produced excessive rain in large part because of its slow movement. A surface low pressure trough from Texas to Missouri combined with an anticyclone off the mid-Atlantic coast to pump Gulf moisture into Tennessee as early as the 4th! By the evening of the 5th (Fig. 2), a 30-40 knot southerly jet existed at 850 mb (~ 5000 feet [kft] MSL) over eastern TN and KY. This "primed the pump", generating deep moisture into the region well in advance of surface and upper lows. By the time of heaviest rain (0000-0600 UTC on the 8th), this jet structure had intensified and was "aimed" at east TN.
- The following figures of the 500 mb (18 kft MSL), 850 mb, and surface levels are from the Eta model initialization for 0000 UTC on the 8th (7 PM EST on the 7th). At 500 mb (Fig. 3), a strong SSW flow with imbedded short waves was in place over the area, ahead of a closed low over Texas. At 850 mb (Fig. 4), a 55 knot jet was contributing to a "bullseye" of maximum moisture advection into the mountains along the North Carolina/Tennessee border. This was confirmed by the VAD wind profile from the KMRX WSR-88D (located at open circle on Fig. 1). At the surface (Fig. 5), a deep cyclone with a central pressure of 996 mb existed over middle Tennessee; here also was a cold/stationary front, so east Tennessee was in the warm sector. Precipitable water approached 1.4 inches, or nearly 300% of the climatological average for the date. Buoyancy was low, with near-moist adiabatic soundings and best lifted indices about +2C. The situation most closely resembled the Maddox synoptic flood type (Maddox et al., 1979).
- Another major lifting process besides warm moist air advection was upslope flow into the mountains. This was probably especially critical for Roan Mountain, which sits just to the south of the upper Doe watershed. The peak of this mountain reaches 6286 feet MSL. So wind speeds attained 55 knots about 1000 feet below ridge top!
3. Radar Data
- The town of Roan Mountain is 65 nm due east of the KMRX radar, which generated the data used here. The VAD wind profile (Fig. 6), mentioned heretofore, shows a south-southwest flow from 3 to 30 kft MSL. Speeds increase from 20 knots at 2 kft to 50 knots at 5 kft.
- Although there was significant rainfall earlier in the day of the 7th (over an inch), the highest rain rates and totals in Carter county occurred from 0000-0600 UTC on the 8th. A composite reflectivity image from near the middle of this period (Fig. 7) exhibits a 75 nm wide band of moderate to strong echoes, within which were several north-south lines with reflectivities exceeding 35 dBZ. The heaviest of these extended from east of Asheville NC (ASHVLE on the figure) to southern Carter county. The storm track algorithm output (not shown) shows a single track for this line, with motion toward the northeast at 34 knots. Maximum reflectivities in this feature were around 50 dBZ; there were lightning flashes associated with it, as indicated by the National Lightning Detection Network. Echo tops were at 25-30 kft MSL. Velocity products resolved moderate to strong low-level convergence ahead of the line. So, we conclude that this line was strongly convective. It produced the highest hourly rain amounts in the flood area (see next section). How this line formed and maintained strong convection within an environment with weak buoyancy, surrounded by widespread precipitation, is problematic.
4. Topography and Hydrology of the Area
- Fig. 8 is a relief map centered on Roan Mountain, which reaches an elevation of 6286 feet MSL, along the North Carolina (NC)/Tennessee (TN) border. The mountain extends for about 5 nm east along that border toward Hump Mountain (5587 ft MSL). Just north of this ridge line lies the upper Doe river watershed. There is a steep drop between ridge and valley; the town of Roan Mountain (~5 nm from the ridge) is about 2500 ft MSL. The north side of town abuts White Rocks Mountain (up to 4000 ft MSL).
- Fig. 9 is adapted from a highway map of southern Carter county. Highlighted are the Doe and all its tributaries exhibiting damage from this event. The tributaries are all small streams under normal conditions. All but one of these tributaries flow northward from the 6000 ft ridge of Roan Mountain toward the northeastward-flowing Doe. They all empty into the Doe upstream of the town of Roan Mountain. Hampton Creek is the last tributary stream above the town to enter the Doe River. The Doe takes a sharp left turn when it reaches White Rocks Mountain. It is surmised that, because of high discharge from Hampton Creek and the barrier of White Rocks Mountain, the Doe River diverted from its normal flow through town. The town suffered the worst damage of any community along the river.
5. Rainfall Distribution
- A three-hour precipitation product during the heavy rainfall between 0200 and 0500 UTC on the 8th is shown in Fig. 10. Several north-south maxima are evident, in accordance with the orientation of the echoes in Fig. 7. One of these maxima extends into southern Carter county. The greatest radar precipitation estimates in this area are between 0.5" and 0.75" for the three hours. When compared to gage data, however, these values are significant underestimates of actual rainfall. A rough comparison of amounts from seven gages in the area of heavy rain showed the radar estimates to be 21-78% of gage values, with an average of 37%. In the nearby mountains of North Carolina, the Greer, SC WSR-88D manifested even more severe underestimation; a maximum of 16" was collected for the event in one gage, where the radar estimated only 3" (Larry Lee, personal communication). Both radars used the standard rain rate-reflectivity relationship Z=300 R1.4. The WSR-88D, however, indicated the location of heavy precipitation with great accuracy, as is almost always the case.
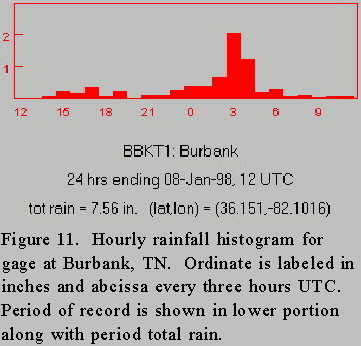
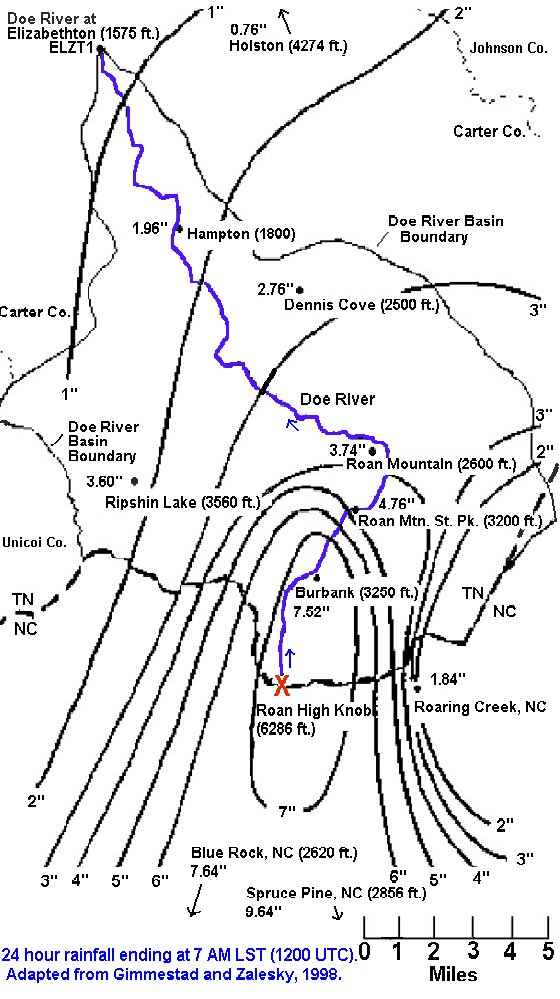
- Much of the precipitation fell into the upper Doe watershed. A gage in Burbank (located in Fig. 9), 3.5 nm southwest of the town of Roan Mountain, received 4.92 inches of rain in the 6 hours between 0000 to 0600 UTC on the 8th (Fig. 11). From 0200 to 0500, 3.4 inches of that total fell. Unfortunately, this gage's data is only available every 24 hours, around 1200 UTC. There were, however, three Integrated Flood Observing and Warning System (IFLOWS) gages in the southern third of Carter county; these report hourly amounts. The 0200-0500 UTC totals from these gages (Ripshin Lake, Roan Mountain, and Roan Mountain State Park) were 0.88, 1.46, and 1.64 inches, respectively. Three-hour flash flood guidance for southeast Carter county was 1.4 inches. A map of twenty-four hour rainfall over the Doe River basin (Fig. 12) confirms that the heaviest long-term rainfall fell over the ultimate headwaters of the Doe River, and so eventually affected the entire river.
- This was the flood of record for the Doe River, exceeding that of 1901. The stage of the Doe at Elizabethton was 3 feet at 0300 UTC on the 8th. Elizabethon is one river mile above the mouth, in relatively flat terrain. Flood stage there is 8 feet. Some interesting features appear on the hydrograph for the flood (Fig. 13). Note that the heaviest rain began at approximately 0000 UTC on the 8th and that the Doe at Elizabethton reached flood stage seven hours 22 minutes later (0722 UTC). The peak stage of 10.92 feet occurred at approximately 0845 UTC (Edward Thornton, Tennessee Valley Authority, personal communication). The river dropped below flood again at 1120 UTC. Thus, at the Elizabethton stream gauge, total time above flood stage was about 3 hours 58 minutes.
- A resident in Burbank (near the headwaters) reported that the confluence of Cove Creek and the Doe River there rose three feet between 0500 and 0520 UTC! Hence, it appears that the main flood wave traveled from Burbank at around 0500 UTC (~24 nautical miles upstream from the stream gauge) to Elizabethton in 3.75 hours. The average speed of the flood wave was only 6.4 knots, though it probably traveled at twice this speed through gorges between Roan Mountain and Hampton.
6. Other Factors
- At the time of this event, snow only existed at the highest elevations of Roan Mountain. Nevertheless, up to a foot of snow in the upper Doe Basin had recently melted. This likely moistened the upper soil layers, augmenting runoff of the rain of this event.
- Other contributing factors to this disaster were probably the very steep terrain and darkness of night. These likely conspired to the rapid rise of the Doe river and to slow response time of residents to evacuation orders, respectively.
7. Conclusions and Summary
- As is usually the case in major flash floods, several factors conspired to concentrate heavy rain and runoff. The dominant meteorological factors were: a) very high precipitable water values set up by several days of strong southerly flow ahead of a vigorous upper trough over the central U.S.; b) a strong low-level jet advecting moisture upslope toward a mountain; c) a broad and slow-moving warm conveyor belt with widespread moderate precipitation; d) a narrow convective band within this belt that produced rain rates of two inches per hour or more. The latter factor may have been "the straw that broke the camel's back", without which the flooding would likely have been much less severe. This argument is buttressed by results in neighboring TN counties (flooding but little damage in Unicoi, $0.5 million damage to mainly roads and bridges in Johnson). The convective line bypassed those counties.
- Important hydrologic factors were: a) the steep terrain gradient (averaging 580 ft/nm) between the headwaters of the upper Doe and the town of Roan Mountain; b) the sharp turn of the Doe's normal course through the town of Roan Mountain (the river overshot its banks and formed a new course through the town, likely because of the high momentum of water flowing down the steep gradient); c) the volume of water from the several tributaries added to the Doe's flow before it reached the town; d) the concentration of rain volume and rates on the upper Doe basin, strongly associated with the convective line.
- Unfortunately, there are many watersheds along the southern Appalachian spine that have characteristics similar to the upper Doe. It is therefore certain that floods like this one will occur again somewhere in the region. A principal goal for the future is to ensure that the warning, which was issued with ample lead time, is received, heeded, and acted upon.
REFERENCES
- Gimmestad, B., and Zalesky, W., 1998: Service Assessment - Doe River Flash Flood - Carter County, Tennessee, January 7-8, 1998. National Weather Service, Southern Region Headquarters, Ft. Worth TX.
- Maddox, R.A., C.F. Chappell and L.R. Hoxit, 1979: Synoptic and meso-a scale aspects of flash flood events. Bull. Amer. Meteor. Soc., 60, 115-123.


 Local Radar
 Huntsville Radar
 Regional Satellite
 Graphical Forecast
 Weather Map