
Dangerous heat expands across the Desert Southwest, Plains, Mississippi Valley and Midwest. Critical fire weather for portions of the Intermountain West. Risk for severe thunderstorms and flash flooding across the Upper Midwest/Great Lakes, Ohio Valley, and portions of the mid-Atlantic. Active monsoonal moisture fuels thunderstorms over the Southwest. Hurricane Fausto in the Pacific, should weaken Read More >
You may have already seen probabilistic graphics from us this winter, and we want you to understand the probabilistic data we're using. All weather forecasts are probabilistic. Even the deterministic forecast values you see from us are determined as a "most likely" forecast value out of a range of possibilities.
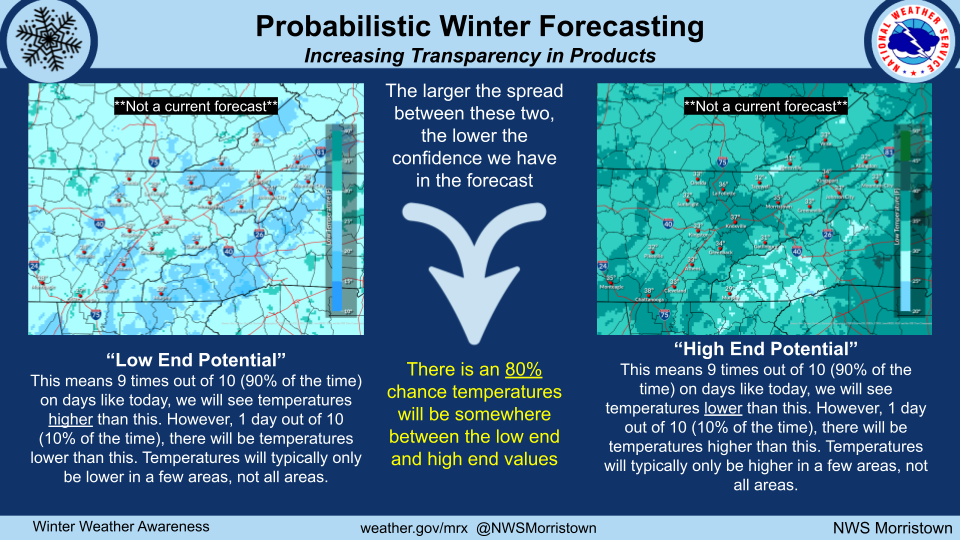
This graphic helps show the difference between potential "low end" and "high end" forecast values that you may see for temperatures, rainfall, or even snowfall this winter. The "low end" value means that 90% of the time, the actual observed values will be higher than the "low end" forecast. The "high end" value means that 90% of the time, the actual observed values will be lower than the "high end" forecast. The actual observed values will be between the "low end" and "high end" values 80% of the time.
Next up: probability of exceedance. Remember: all weather forecasts are probabilistic. Even the deterministic forecast values you see from us are determined as a "most likely" forecast value out of a range of possibilities.
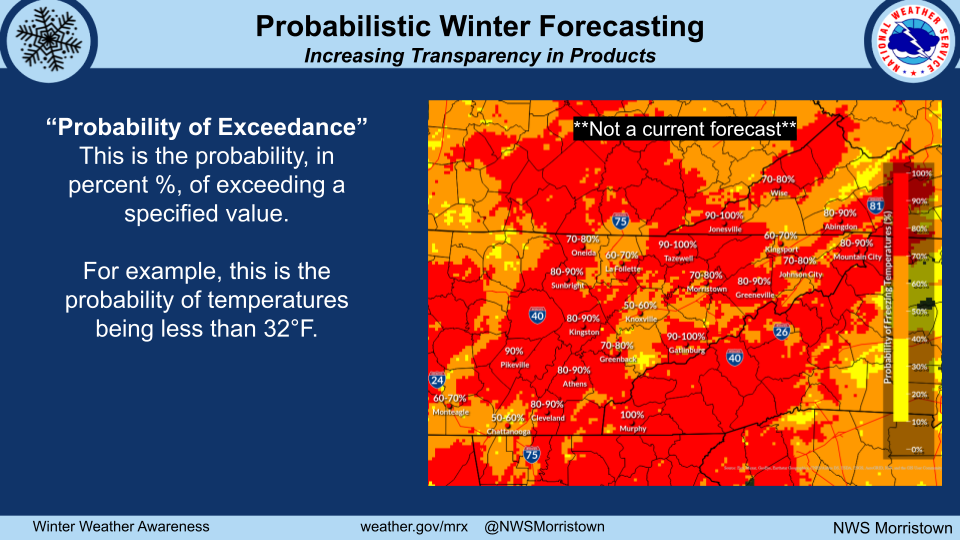
This graphic shows you the probability of a forecast value exceeding a threshold value: probability of exceedance. For example, this graphic shows the probability of low temperatures below freezing (32°F). Probability of exceedance can show the chance that something will be less than a specified threshold value. We can also show probabilities for temperatures rising above a certain value.
You will often see winter weather graphics showing the probabilities of snowfall greater than a threshold value such as 0.1" (a dusting) or 1". When it comes to snow or ice accumulation, it is the probability that the accumulation will be greater than a threshold value. Essentially, what's the percent chance of a location on the map seeing greater than 1" of snow?
These probabilistic values are especially useful in winter when dealing with snow amounts and communicating uncertainty. If you've been around here awhile, you know that there's an inherent level of uncertainty associated with most snow events because of our geography and topography.


 Local Radar
 Huntsville Radar
 Regional Satellite
 Graphical Forecast
 Weather Map