Northeast RFC
River Forecast Center
NERFC Observed Precipitation Page
NERFC Observed Daily Precipitation (Text Product)
Precipitation Analysis Page
Daily Water Conditions from the USGS
US Rain/Dry Days from the USGS
User Information
Data in Text Format
County Precipitation Totals Bar Charts
Click on images to view full size. Click browser back button to return to this page.
Normals were updated to use PRISM values for 1991-2020 on October 5, 2022. Any product produced on or after this date will use the new values. PRISM Normal values for 1981-2010 were used between on October 22, 2015 and October 5, 2022. Prior to October 22, 2015, the normals were based on PRISM data from 1971-2000.
| Time Period | Precipitation Totals | Departures from Normal | Time Period | Precipitation Totals | Departures from Normal |
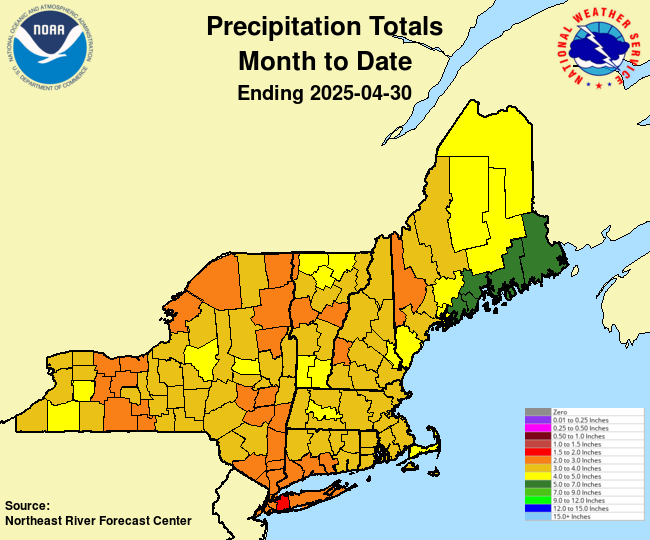
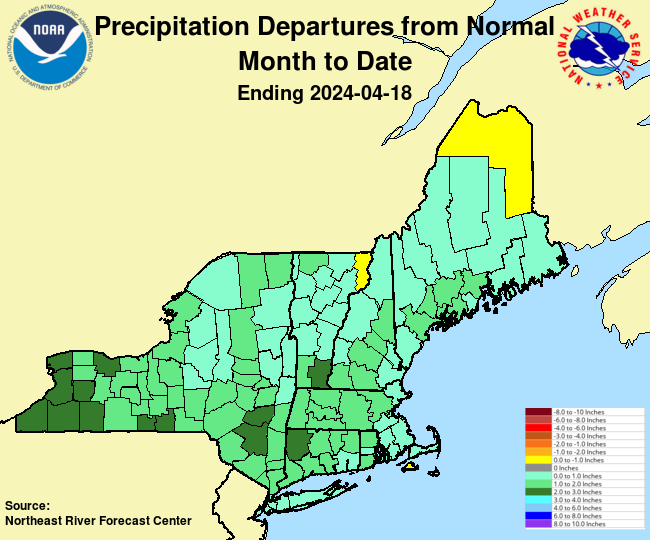
| Month to Date |
 |
 |
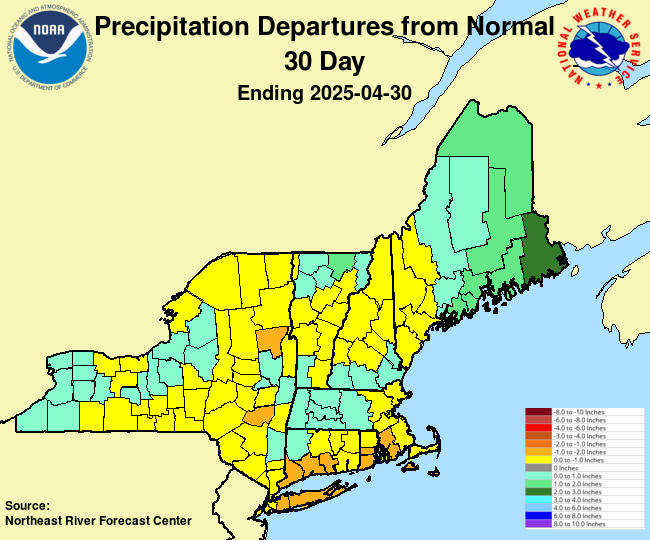
30 Days | 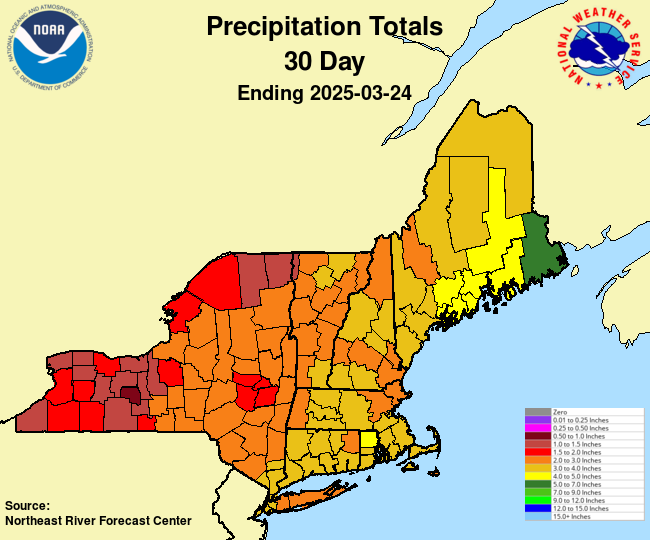 |
 |
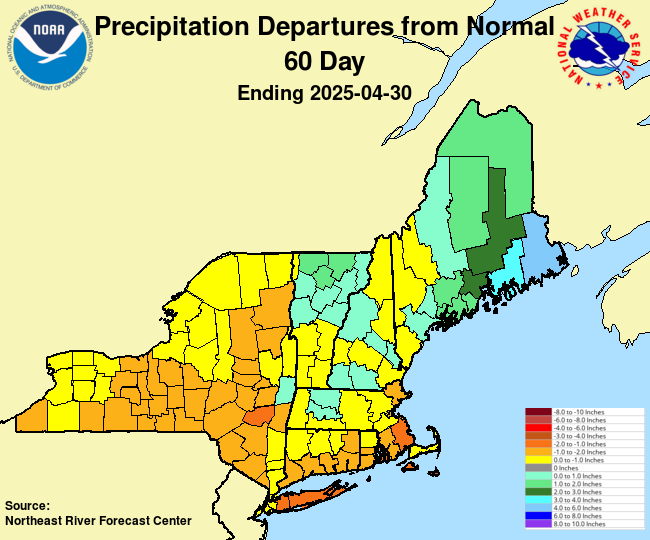
| 60 Days | 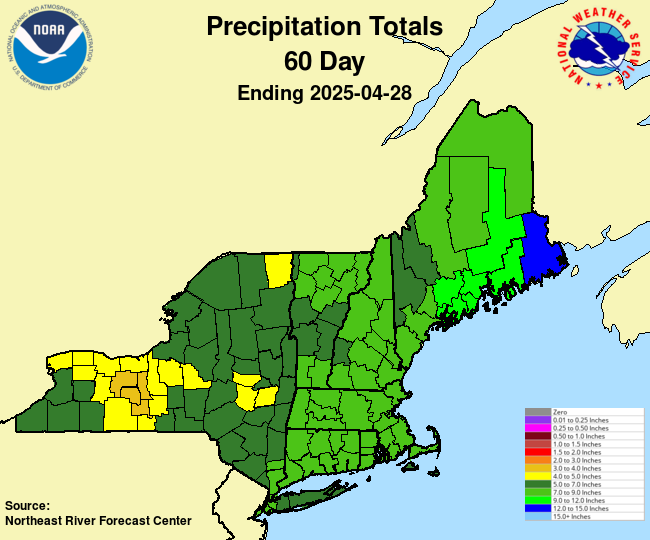 |
 |
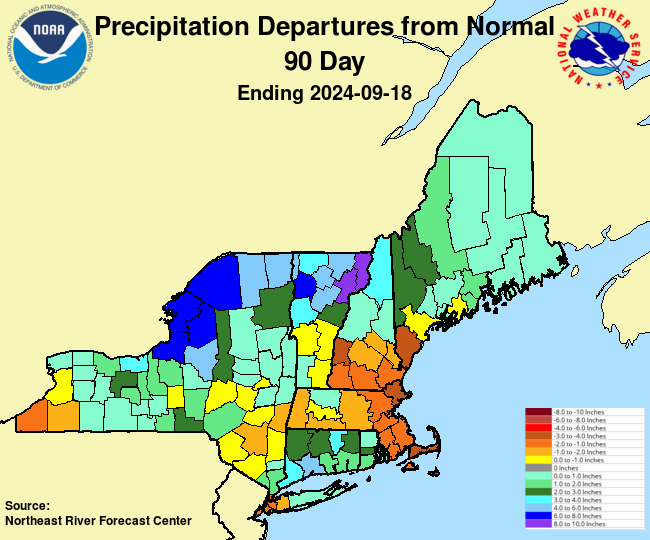
90 Days | 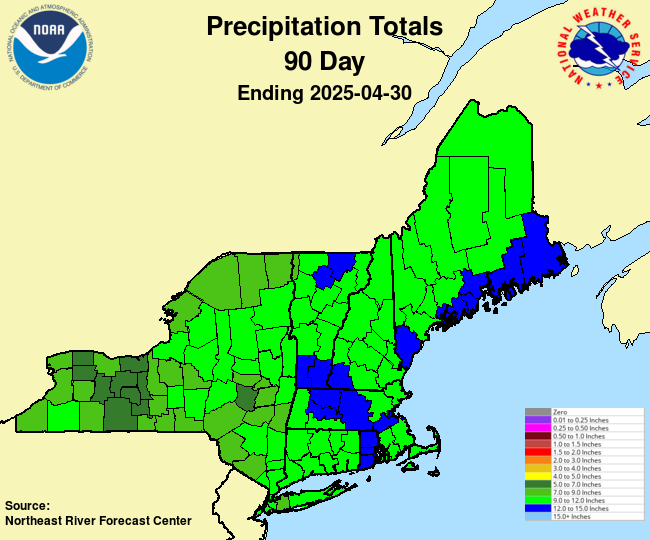 |
 |
| 180 Days | 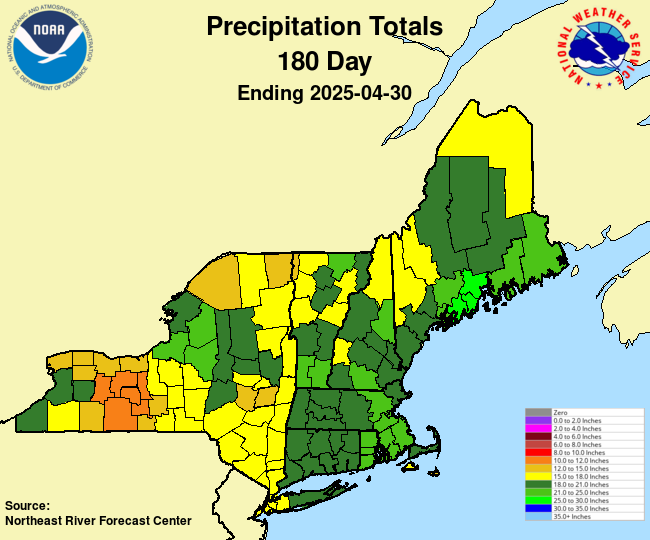 |
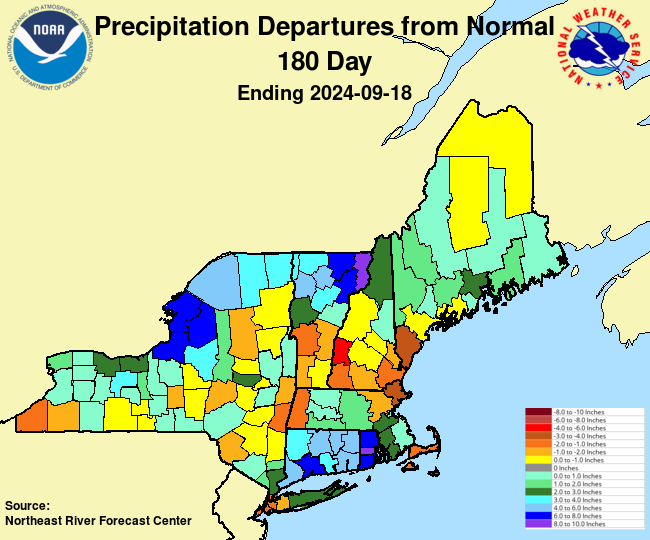 |
Year to Date |
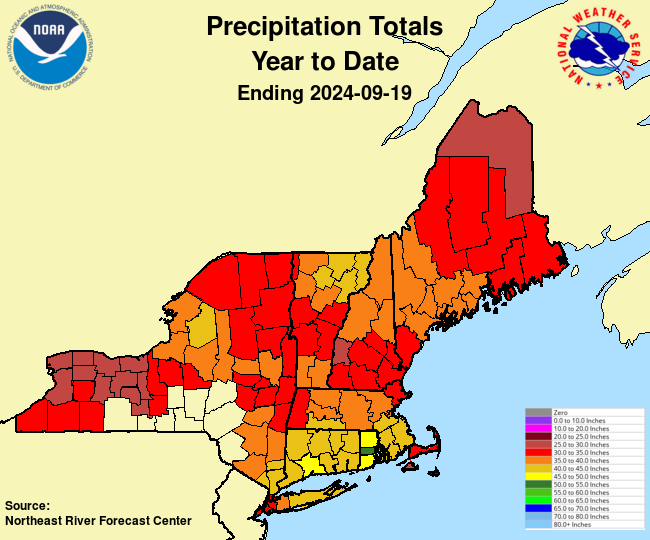 |
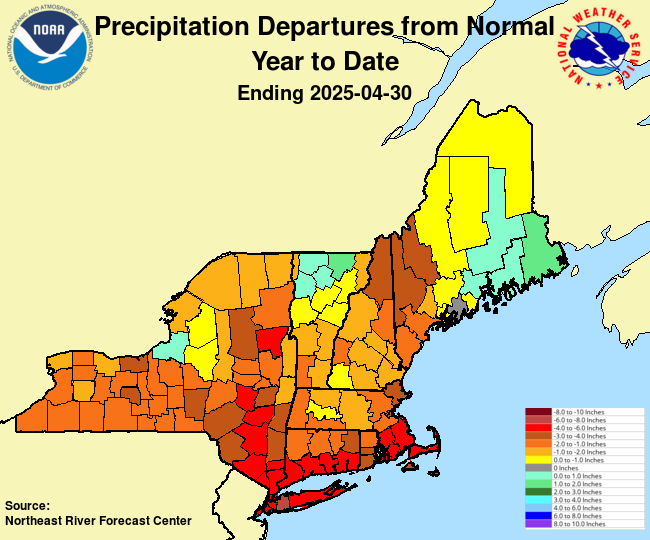 |
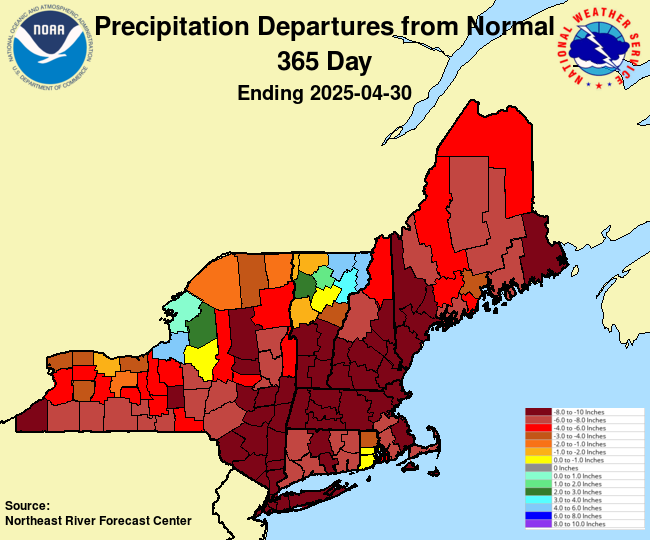
| 365 Days | 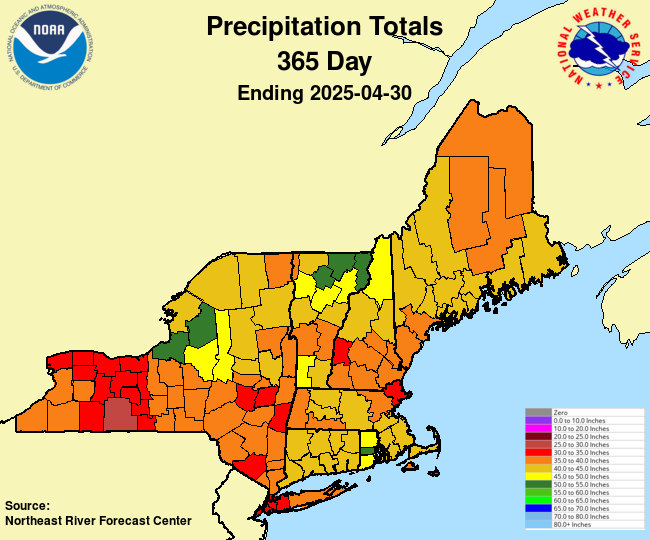 |
 |
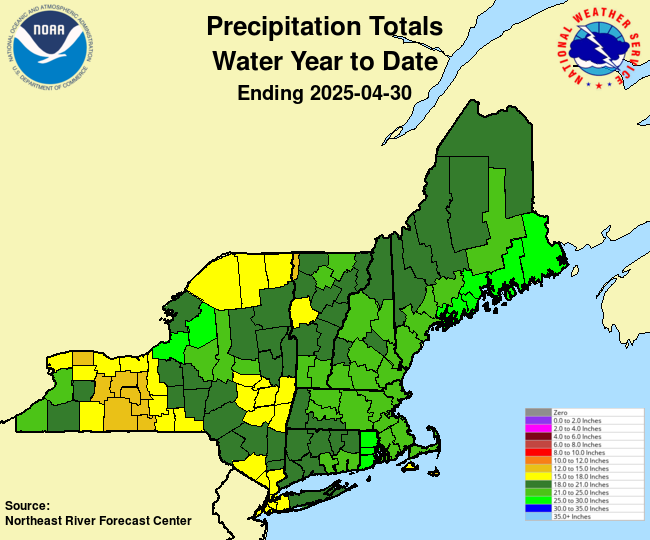
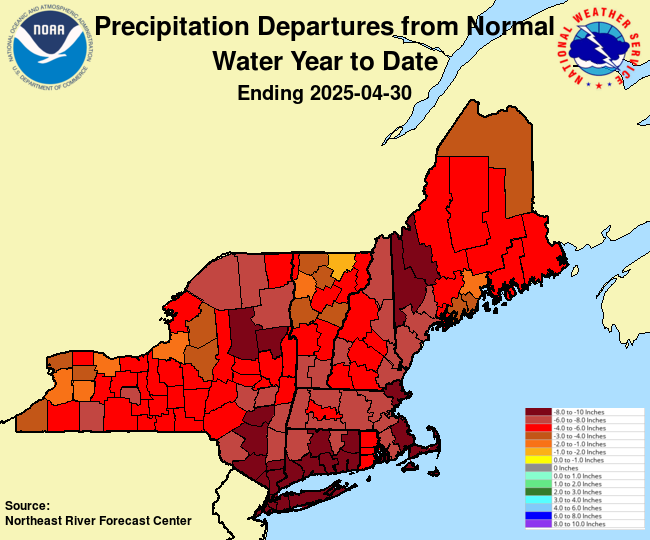
Water Year to Date |
 |
 |
Monthly 30 Year Normals (1991-2020) - Graphics and Text
Monthly 30 Year Normals (1981-2010) - Graphics and Text
Click on images to view full size. Click browser back button to return to this page.
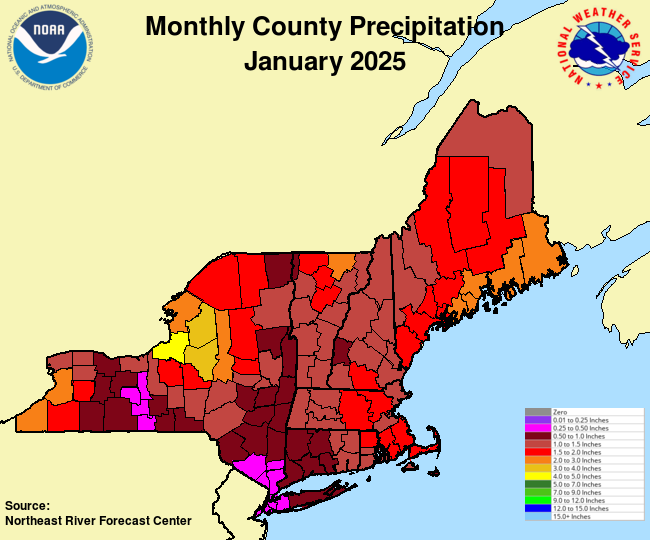
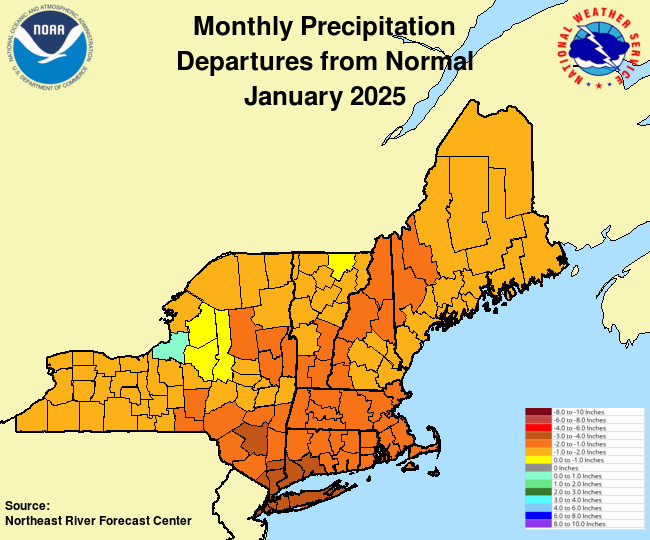
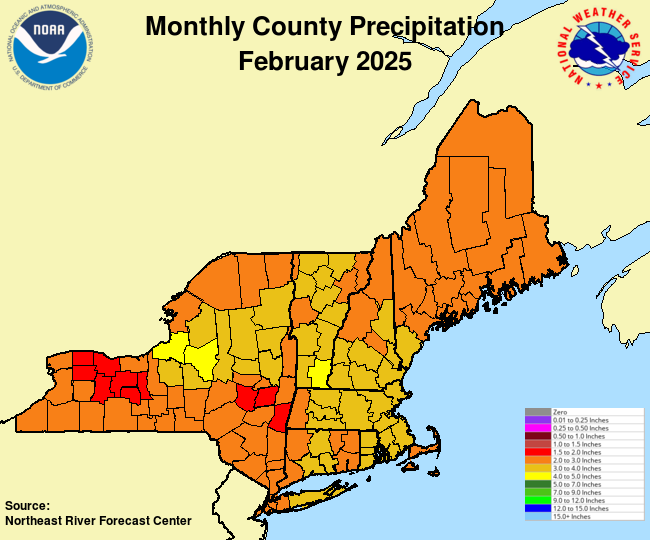
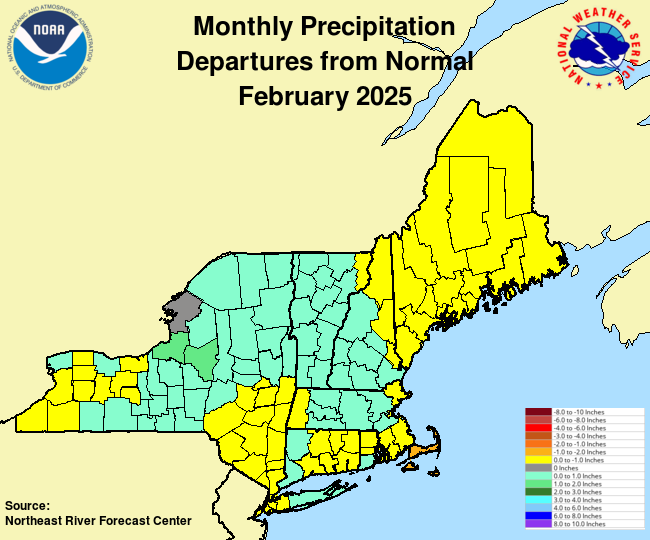
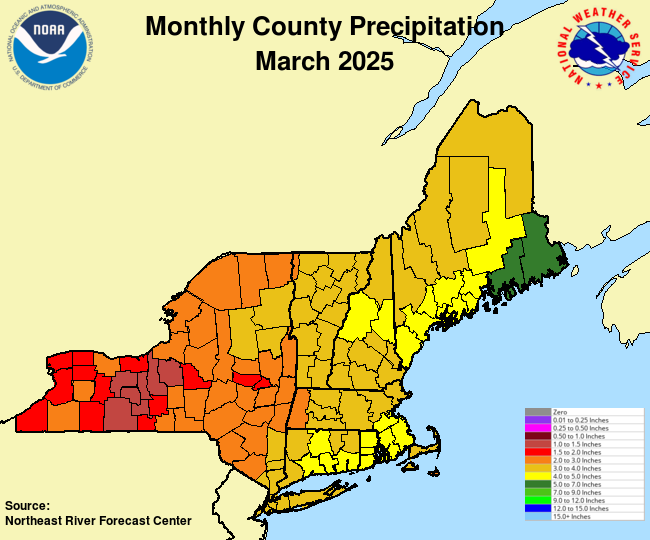
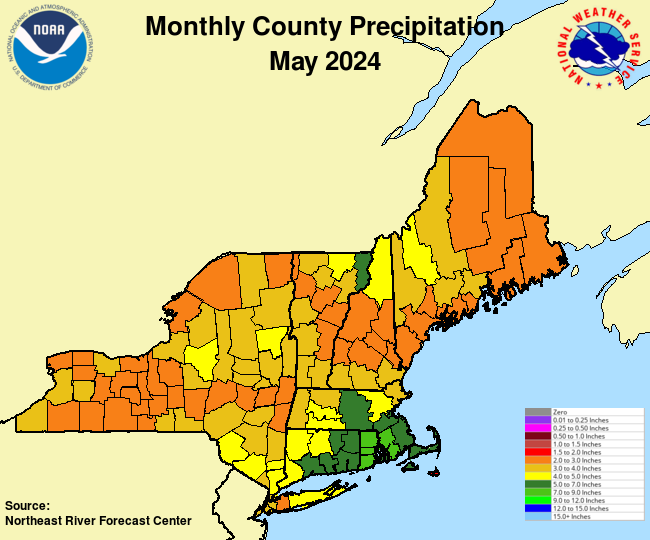
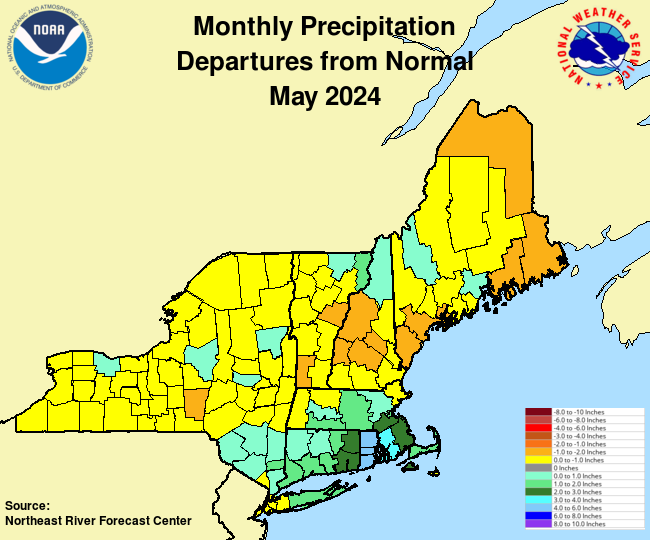
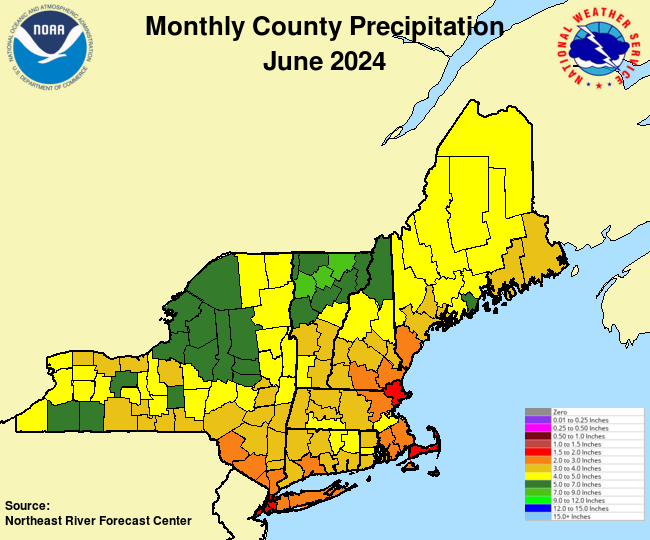
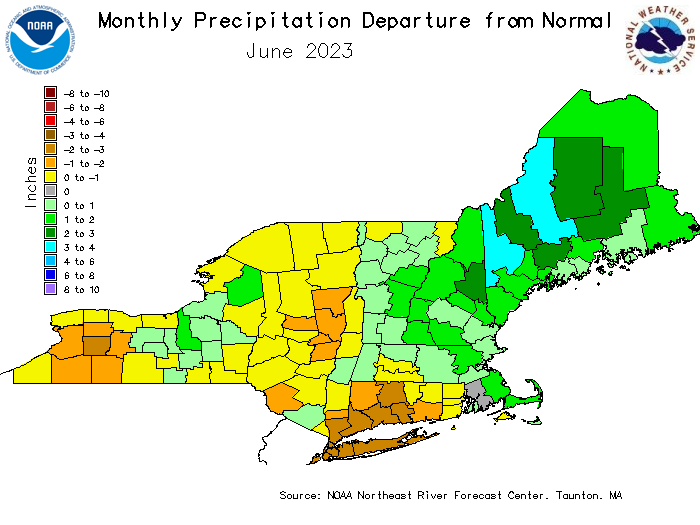
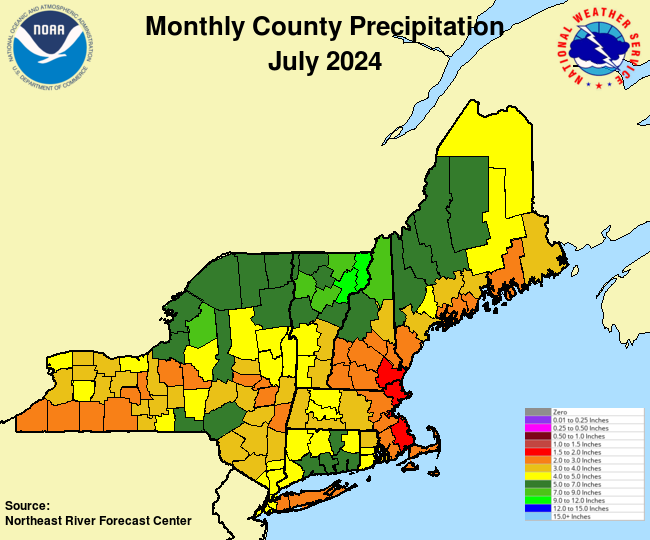
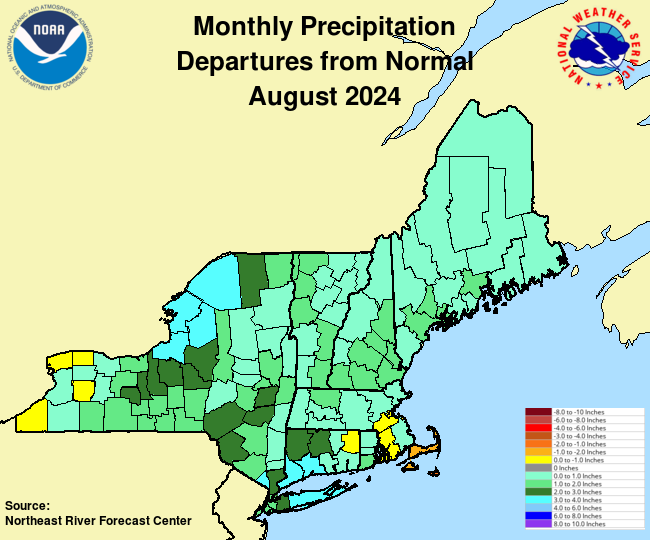
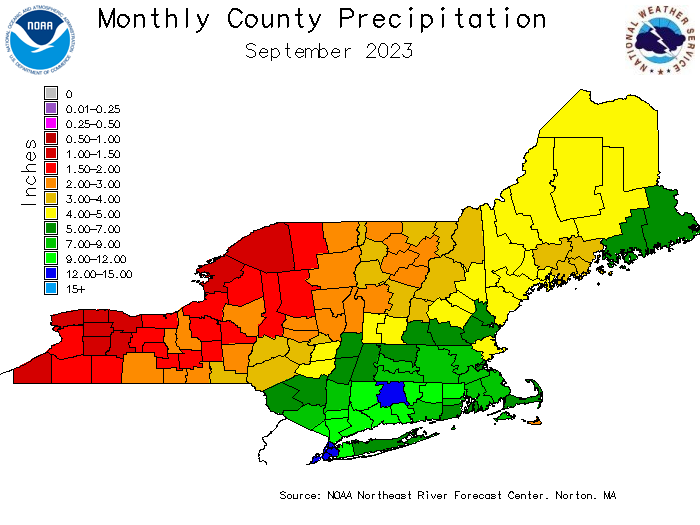
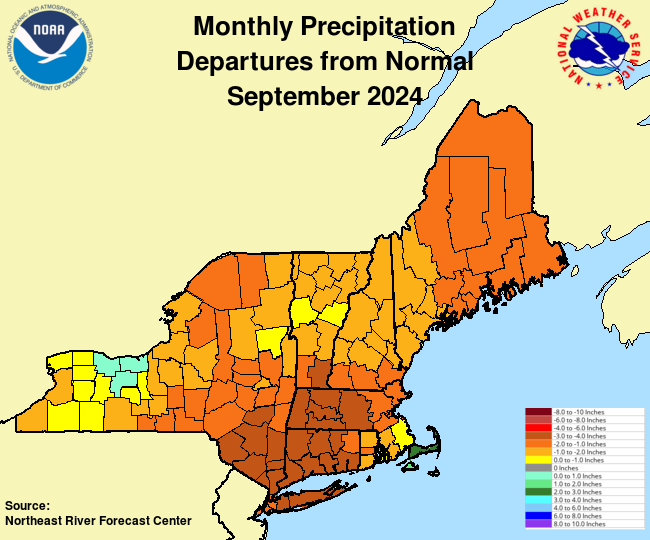
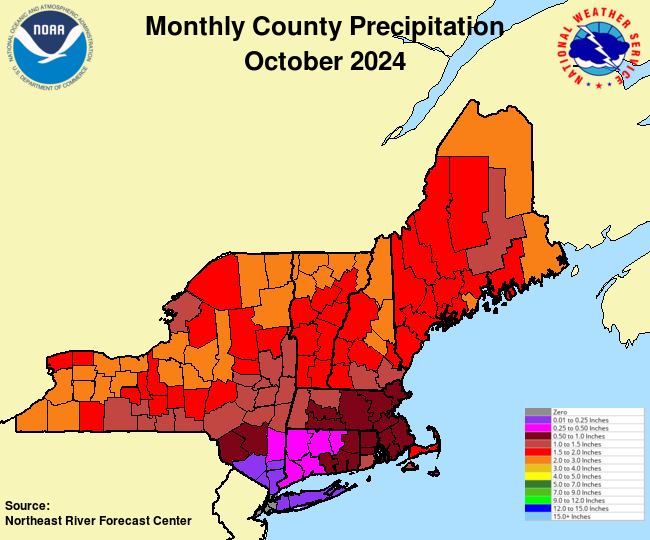
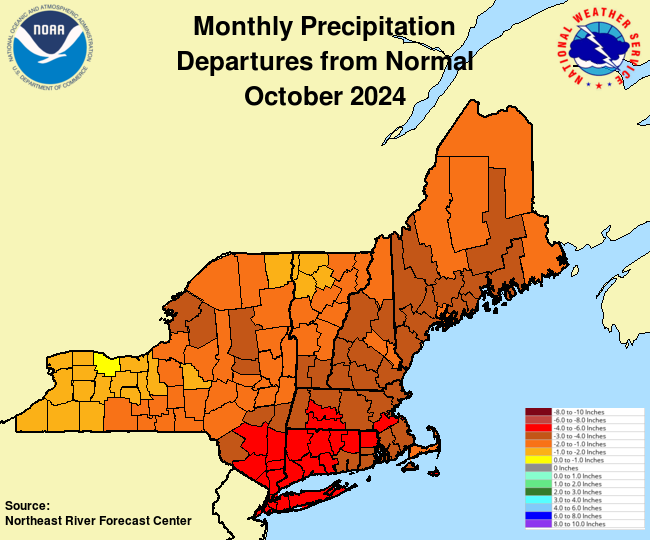
Monthly Precipitation Totals and Departures from Normal |
|||
|---|---|---|---|
Text Products: January | February | March | April | May | June | July | August | September | October | November | December |
|||
| January | February | ||
| Precipitation Totals |
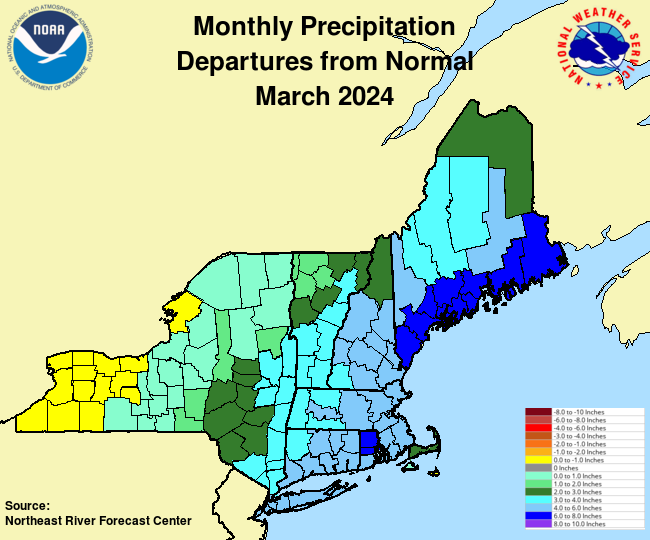
Departures from Normal |
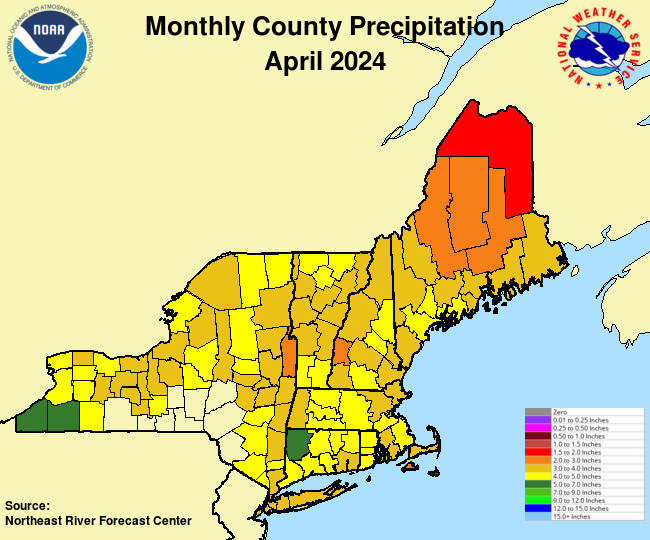
Precipitation Totals |
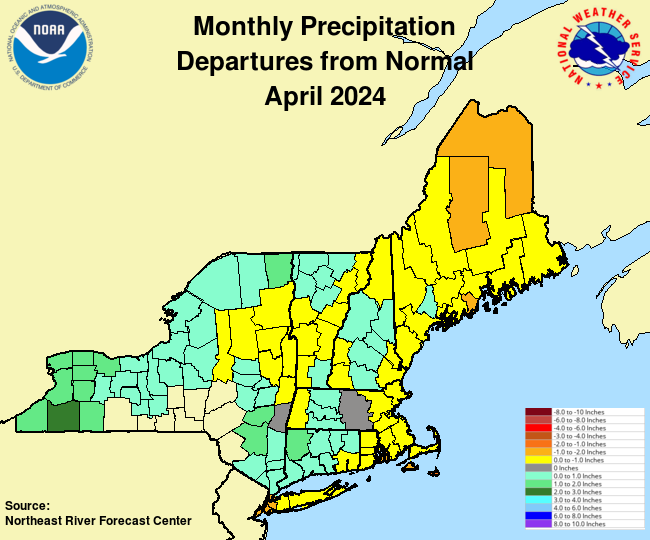
Departures from Normal |
 |
 |
 |
 |
| March | April | ||
 |
 |
 |
 |
| May | June | ||
 |
 |
 |
 |
| July | August | ||
 |
 |
 |
 |
| September | October | ||
 |
 |
 |
 |
| November | December | ||
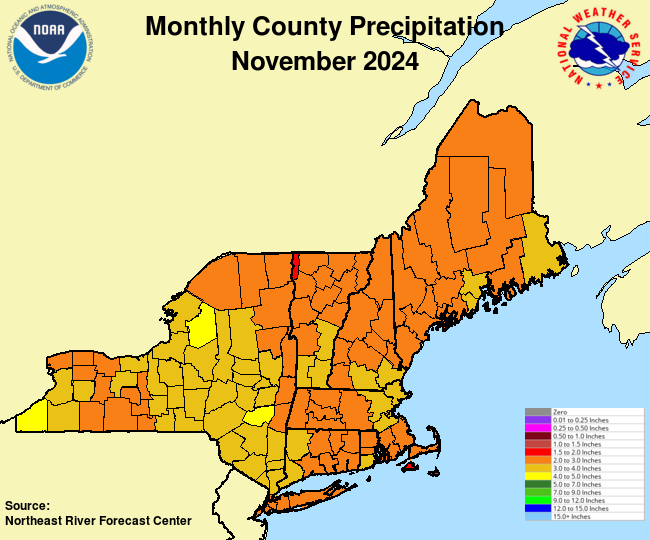 |
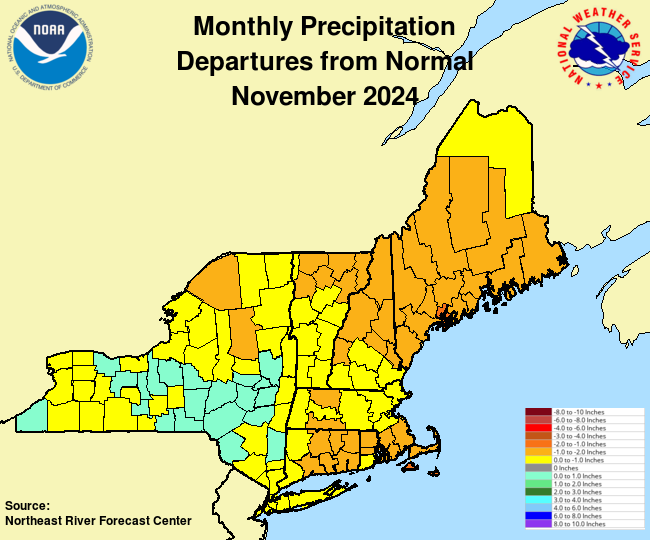 |
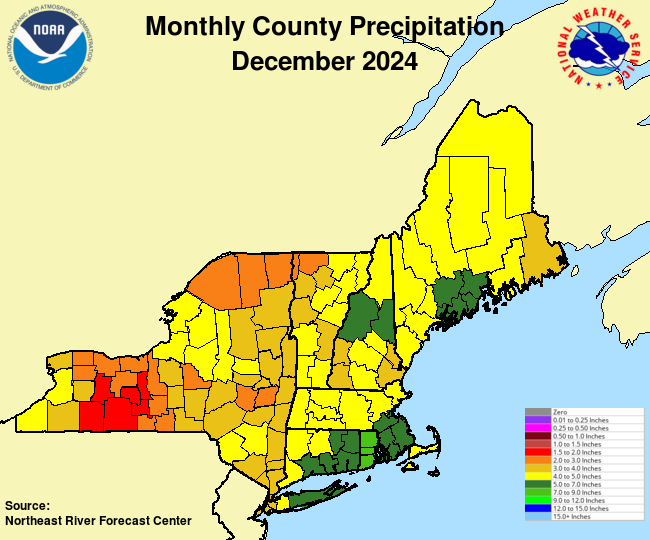 |
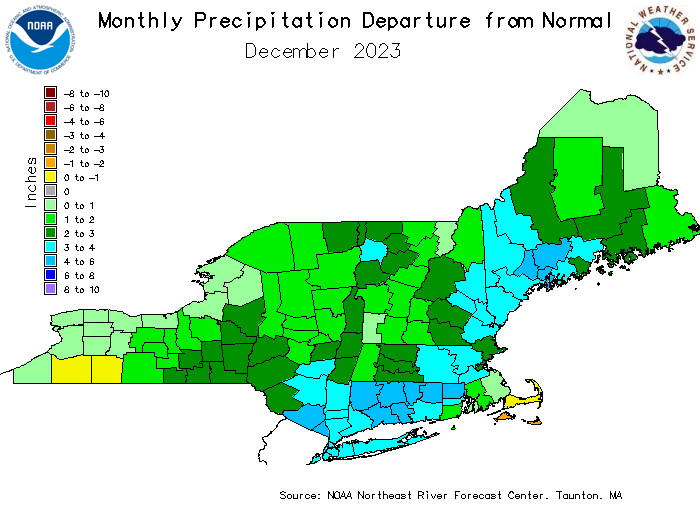 |
US Dept of Commerce
National Oceanic and Atmospheric Administration
National Weather Service
Northeast RFC
46 Commerce Way
Norton, MA 02766
(508) 622-3300
Comments? Questions? Please Contact Us.

