
Numerous severe thunderstorms are expected across a broad region from the Ohio Valley to the Mid-Atlantic and Northeast States today into tonight. Swaths of damaging wind gusts are expected and some tornadoes are possible. Bertha is expected to bring tropical storm conditions to portions of the Gulf Coast from the Florida Panhandle westward to southeastern Louisiana later today and Wednesday. Read More >
|
|
|
|
|
|---|
|
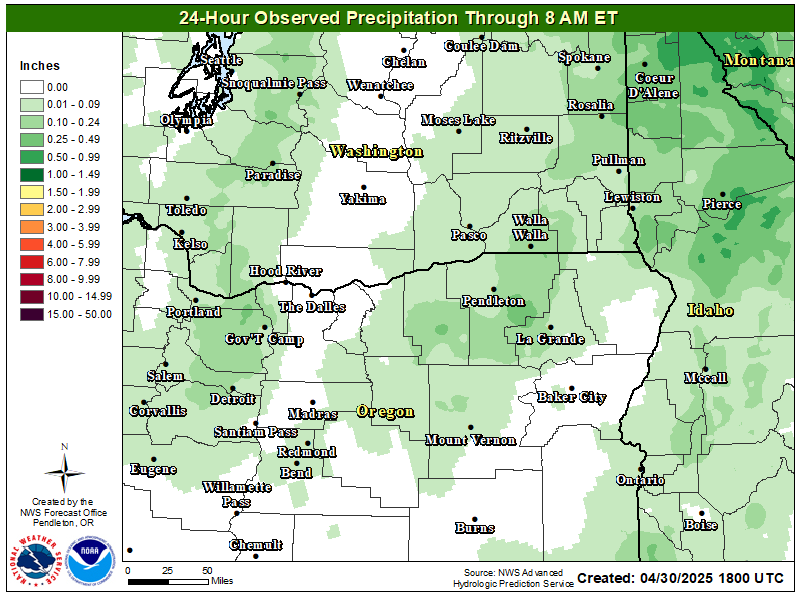
24-hr Obs Precip
|
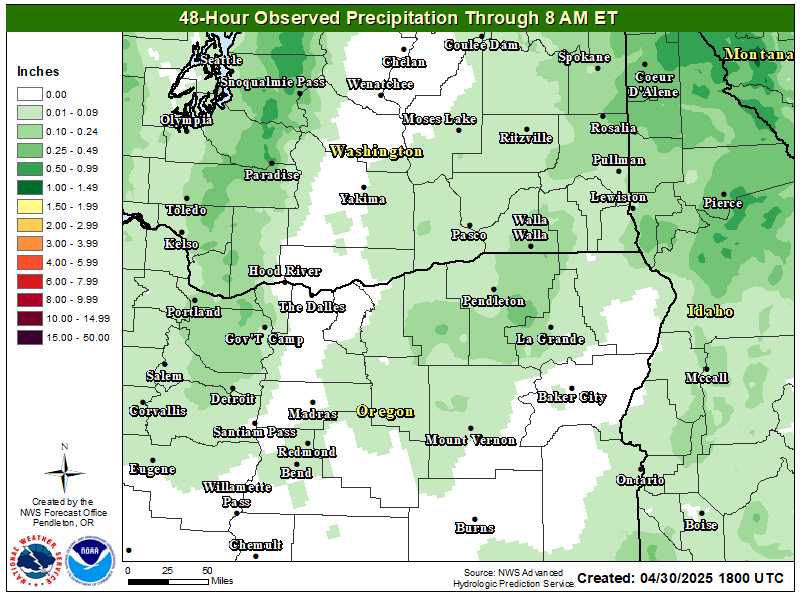
48-hr Obs Precip
|
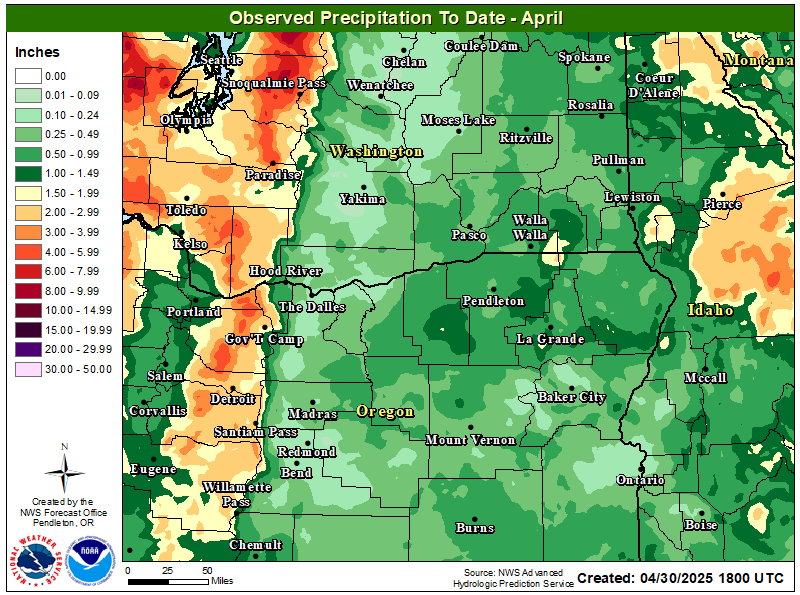
To Date Precip
|
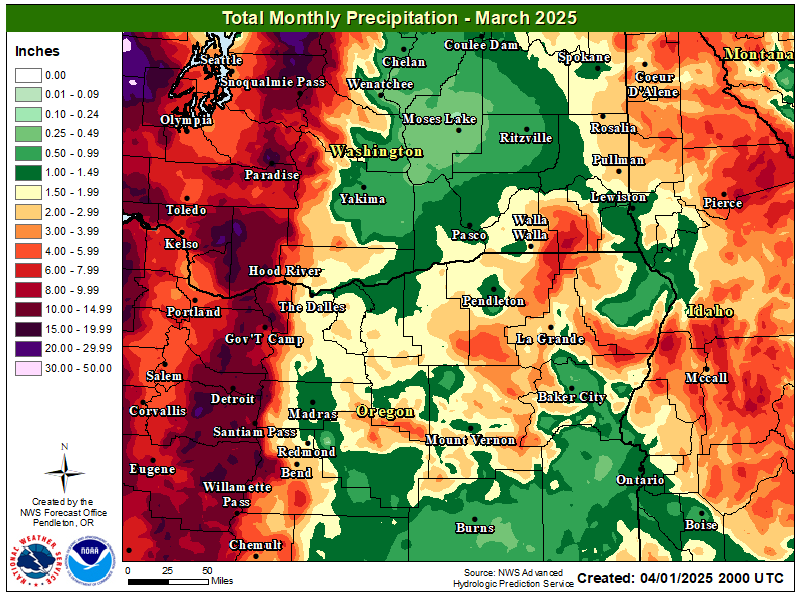
Monthly Precip
|
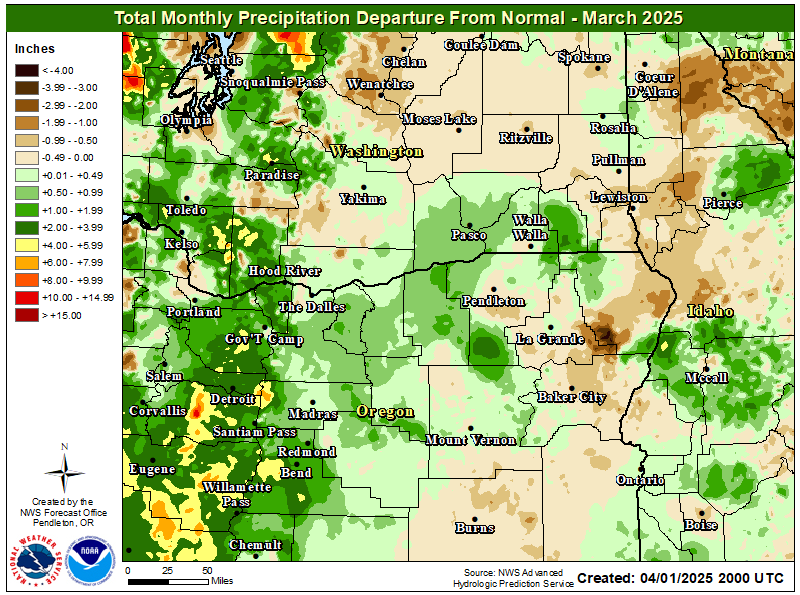
Monthly Departure
|
|---|
Click on an image below to expand
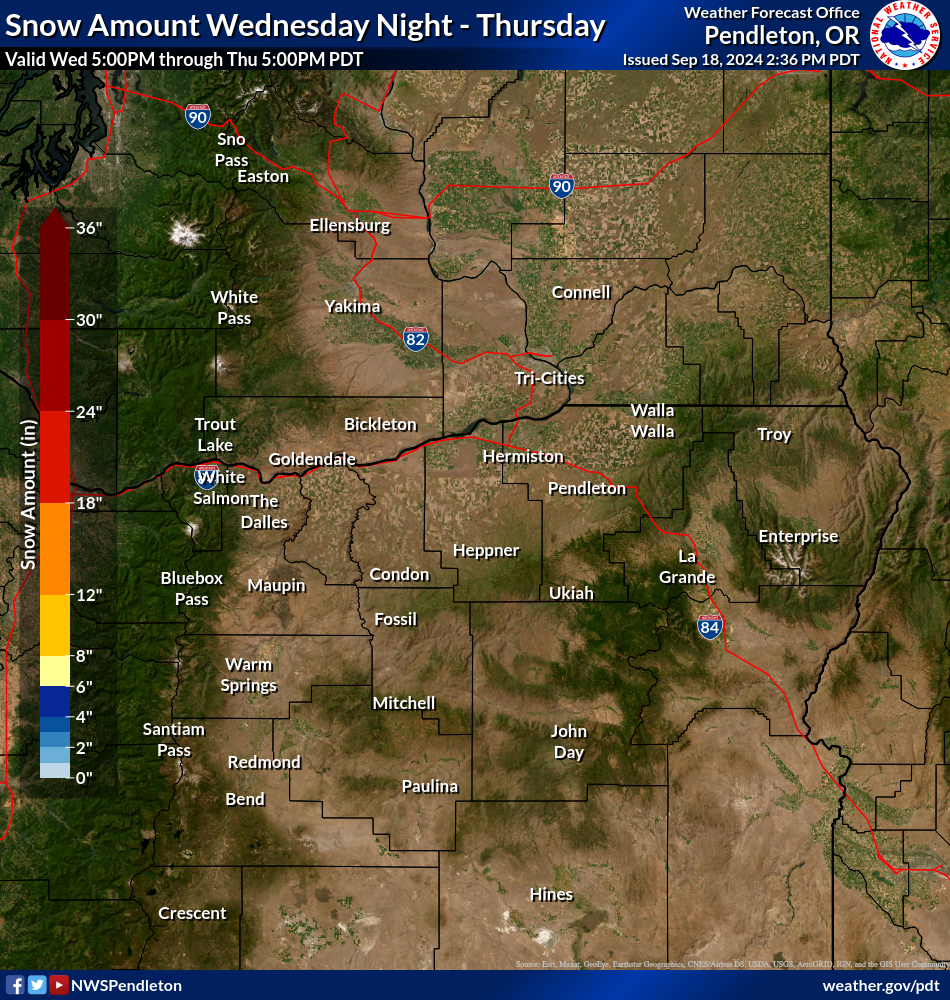
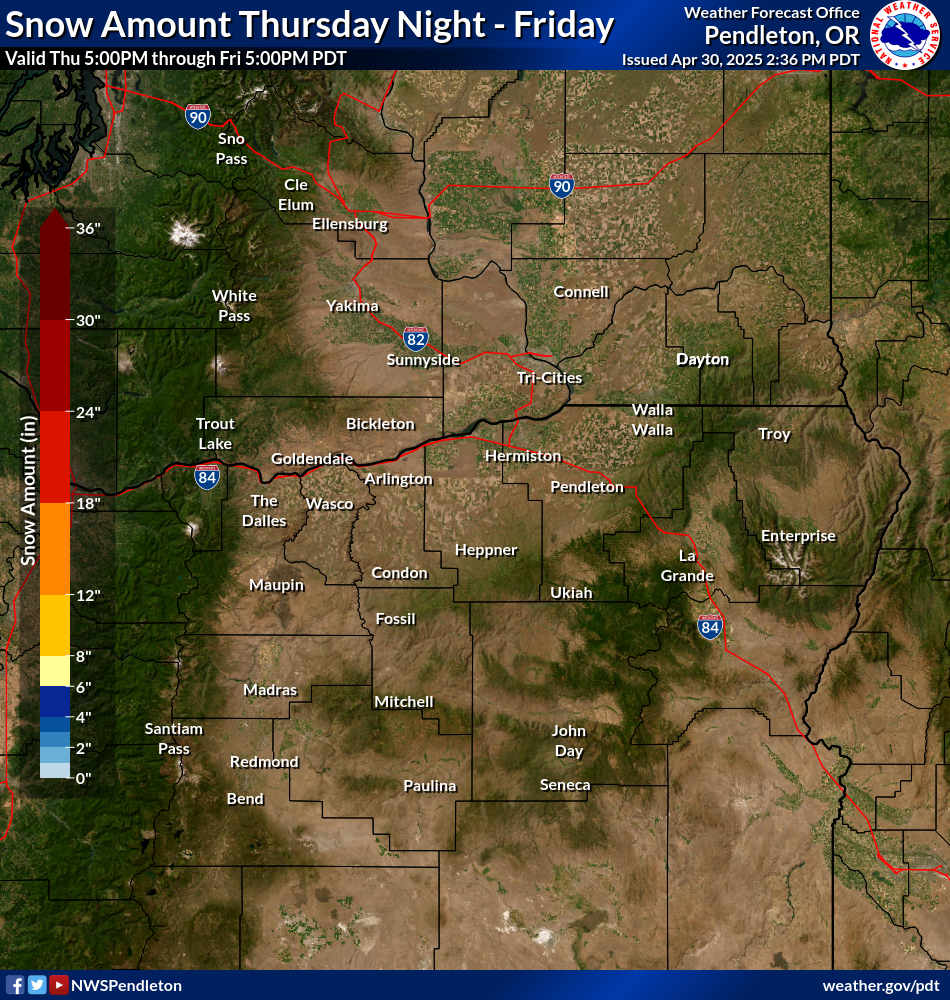
| Day 1 Snow | Day 2 Snow |
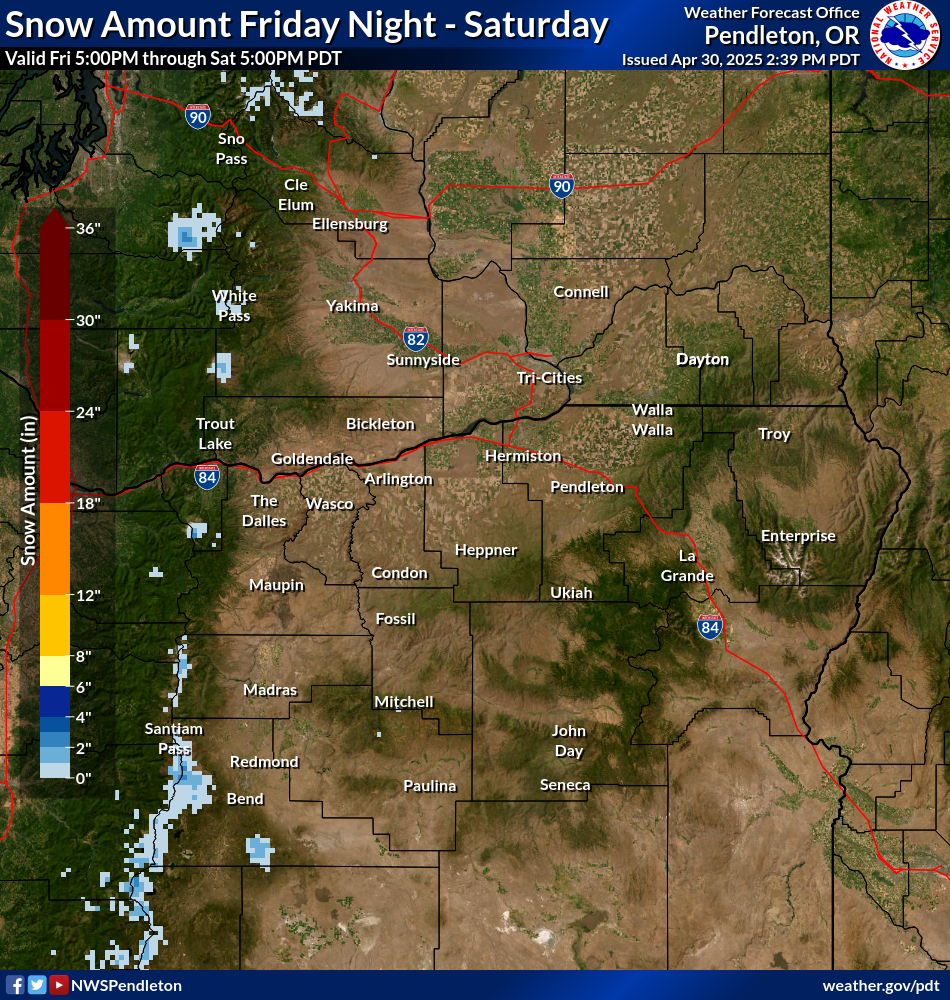
| Day 3 Snow | Day 4 Snow |

Click on an image to expand
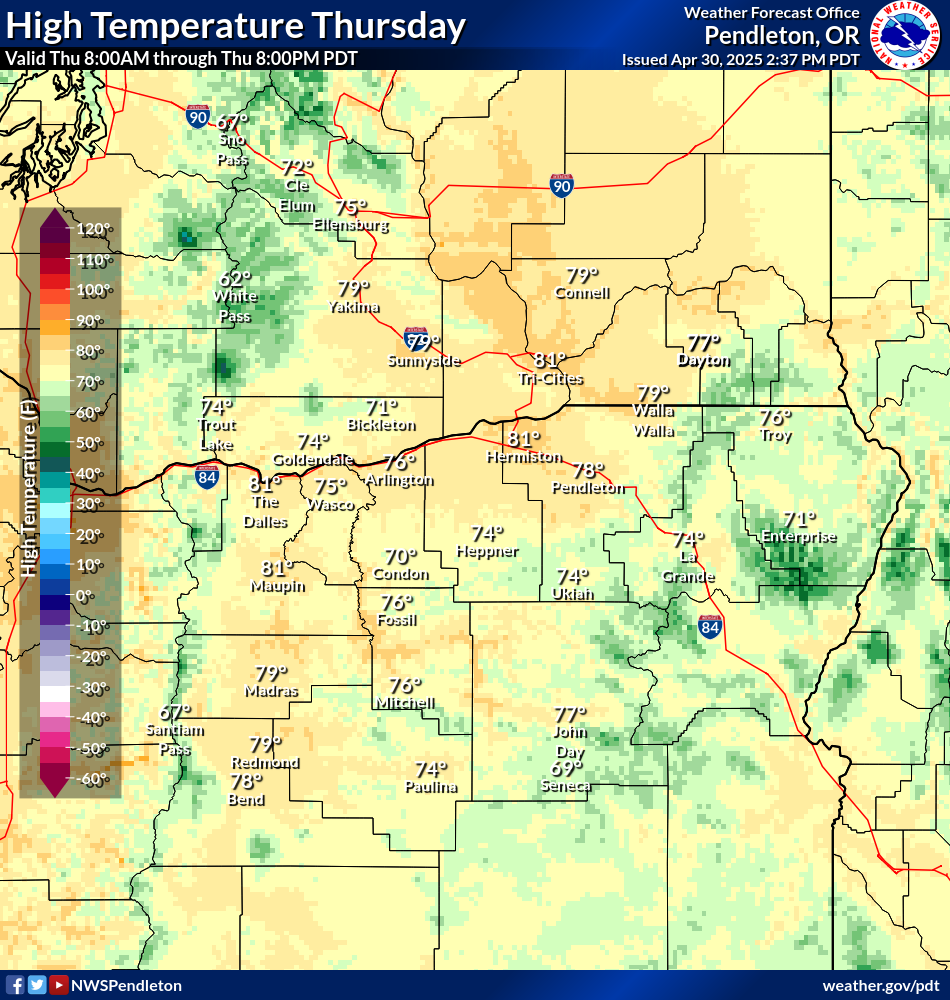
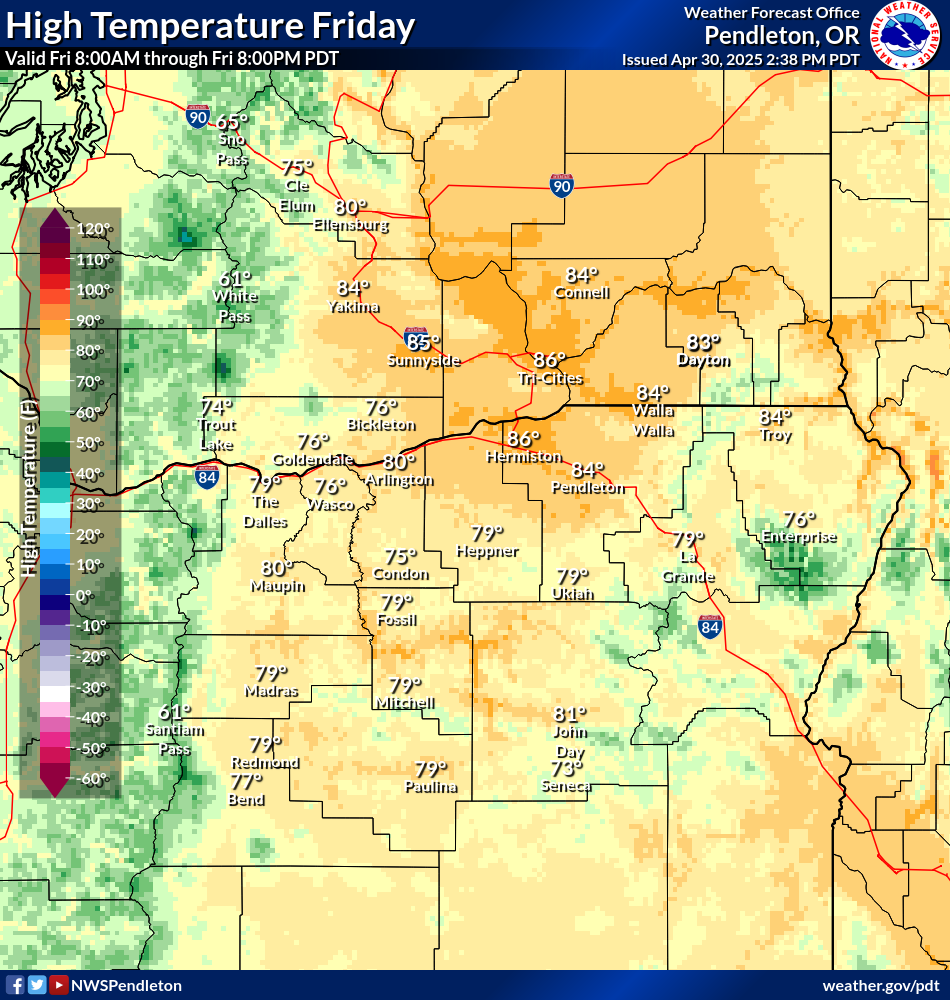
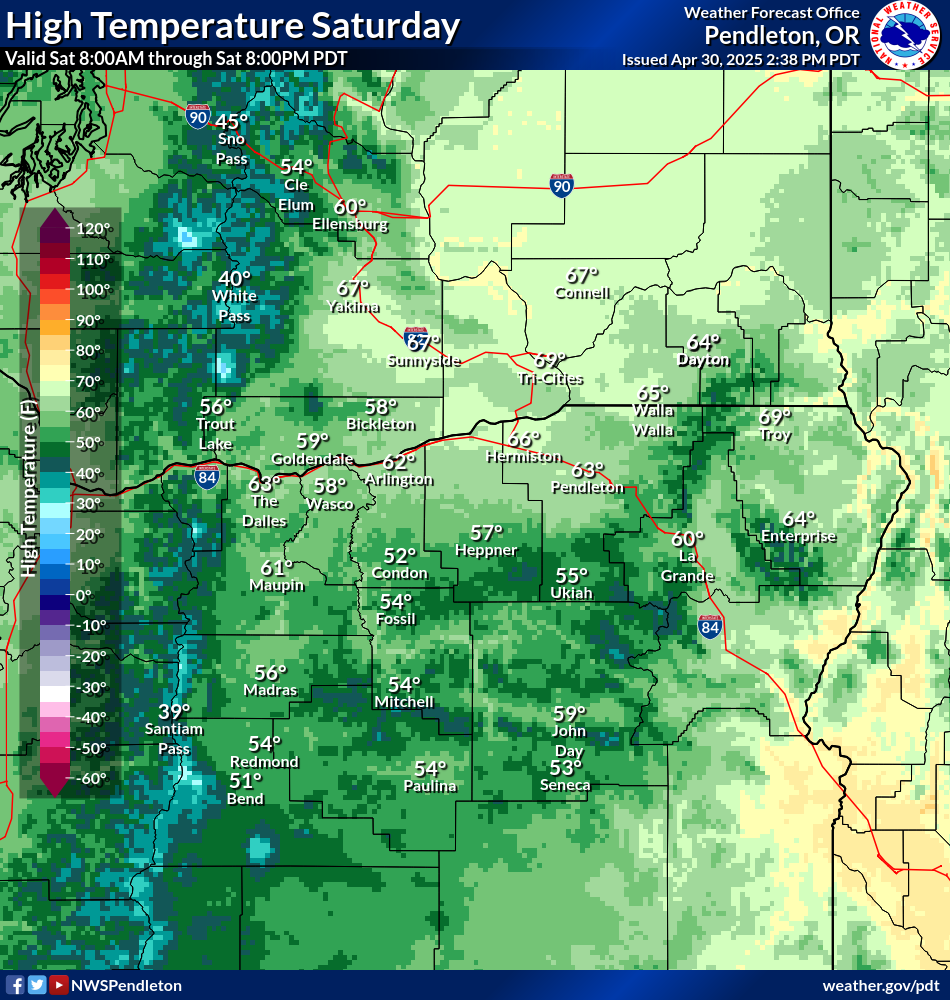
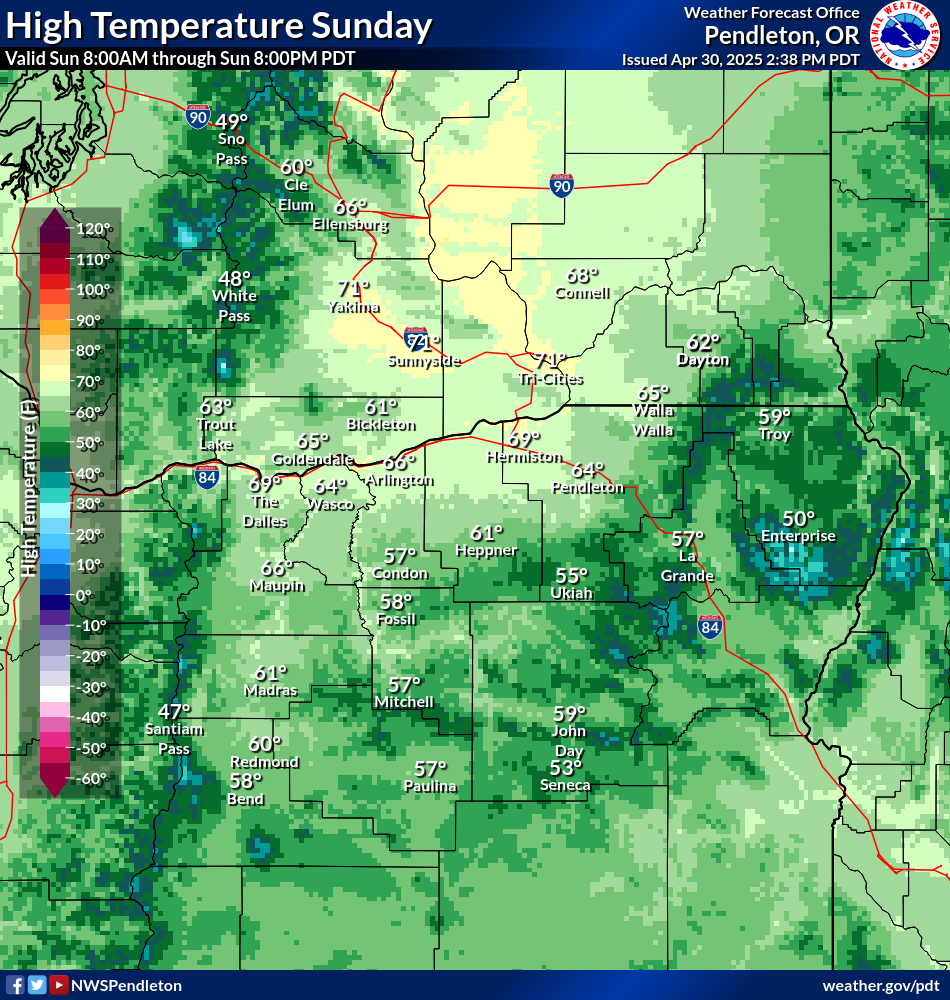
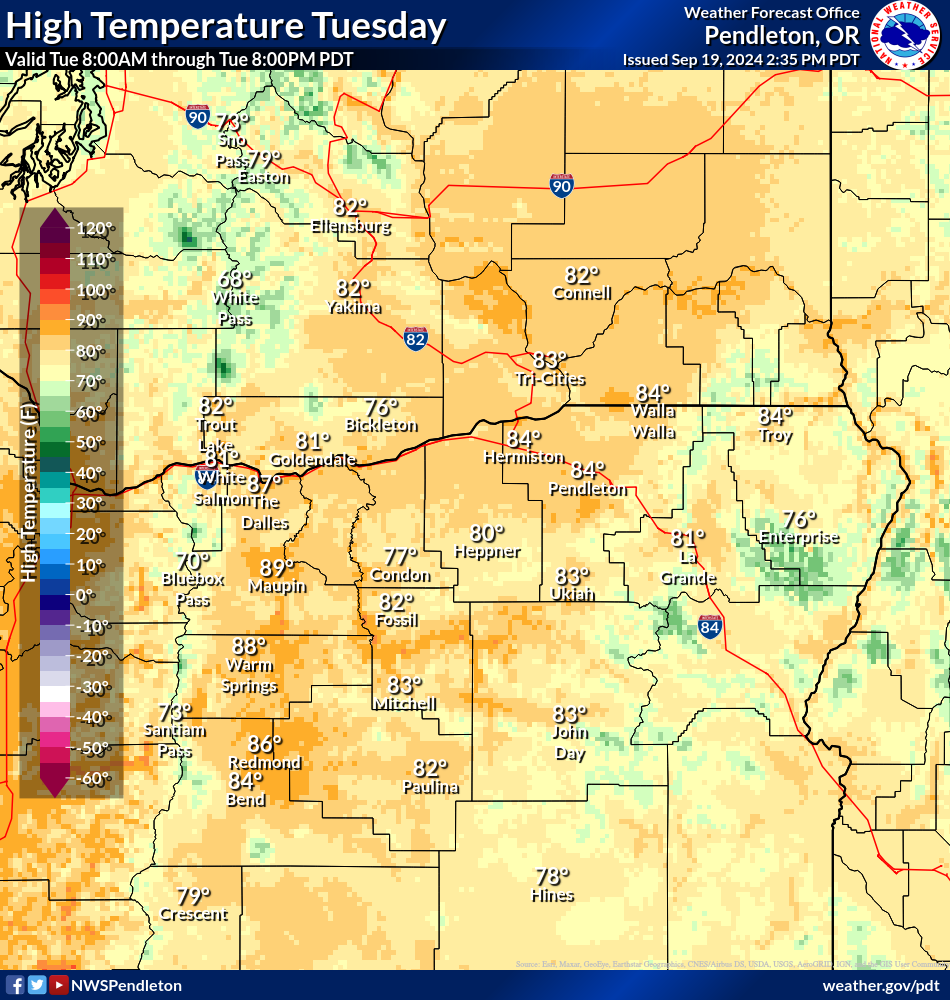
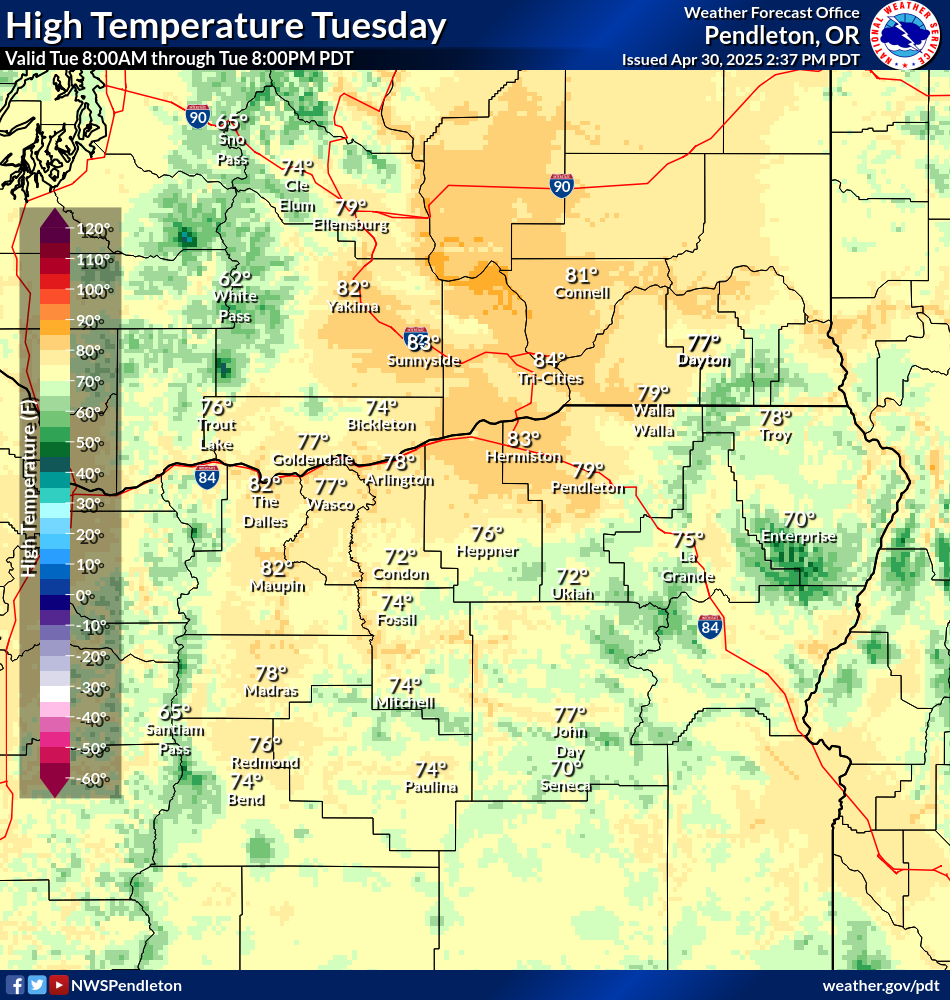
| Day 1 Highs | Day 2 Highs | Day 3 Highs |
| Day 4 Highs | Day 5 Highs | Day 6 Highs |
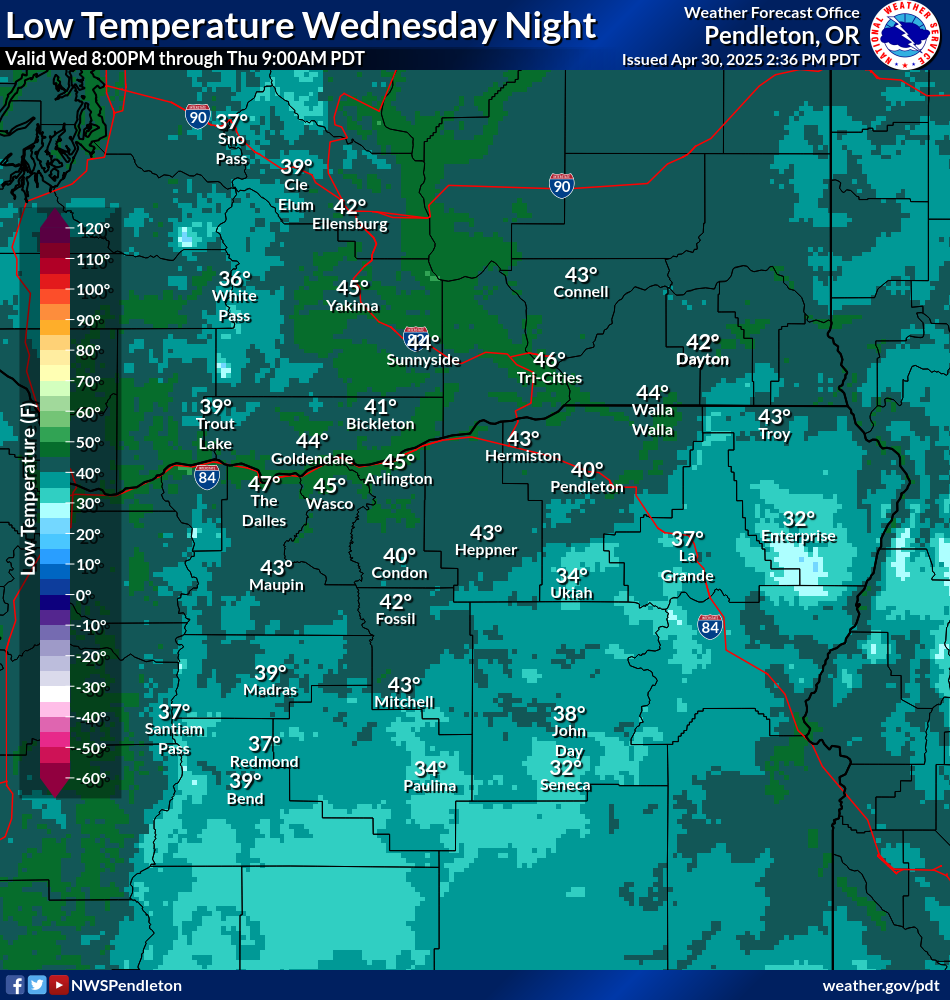
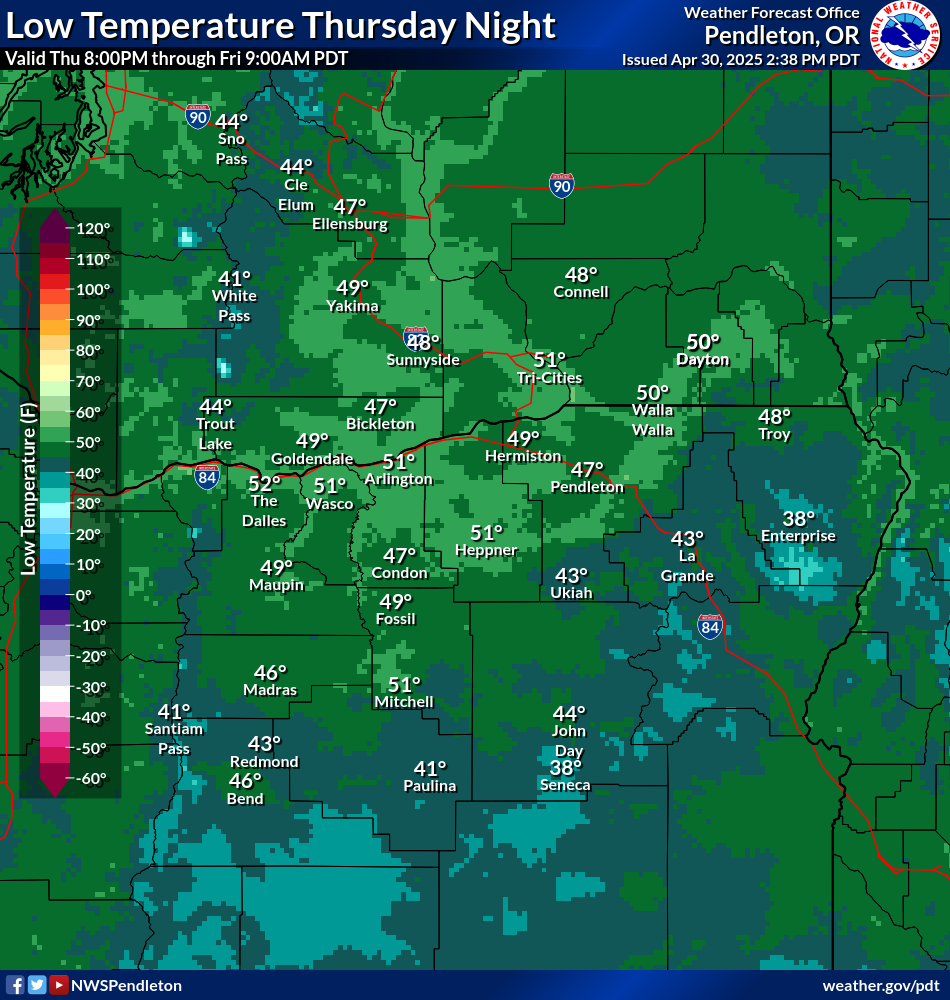
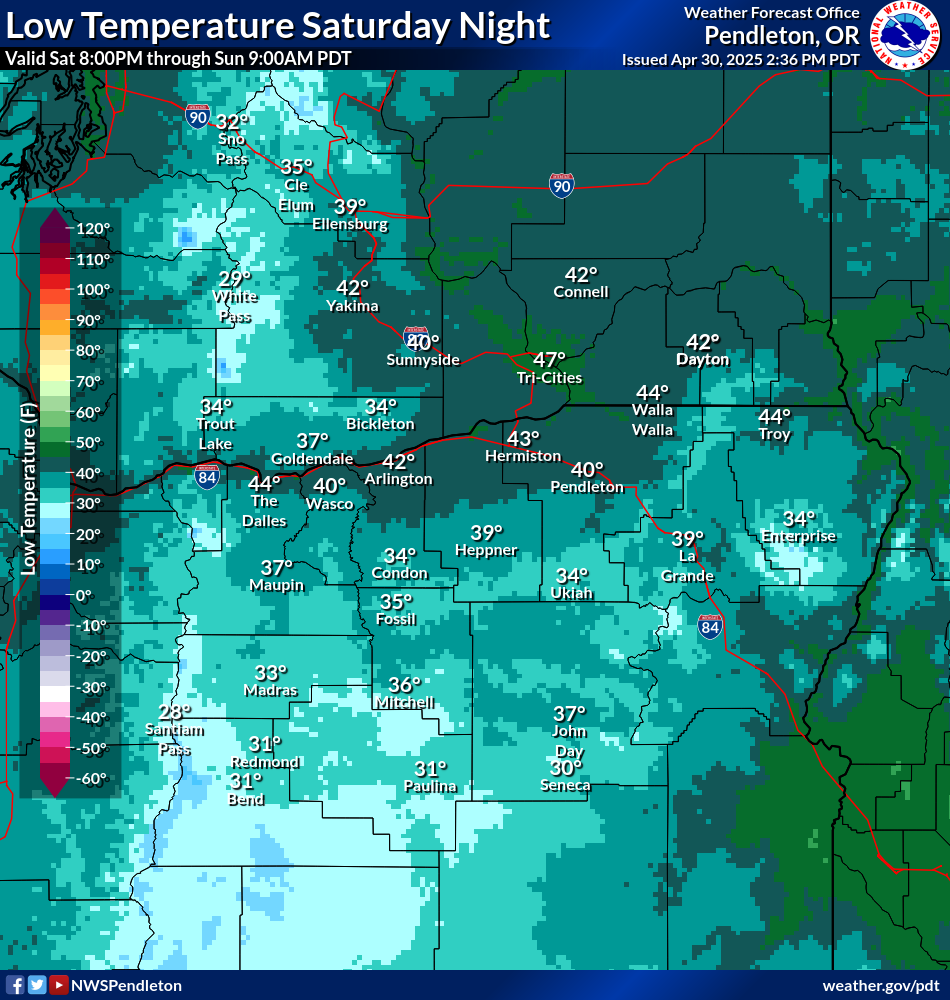
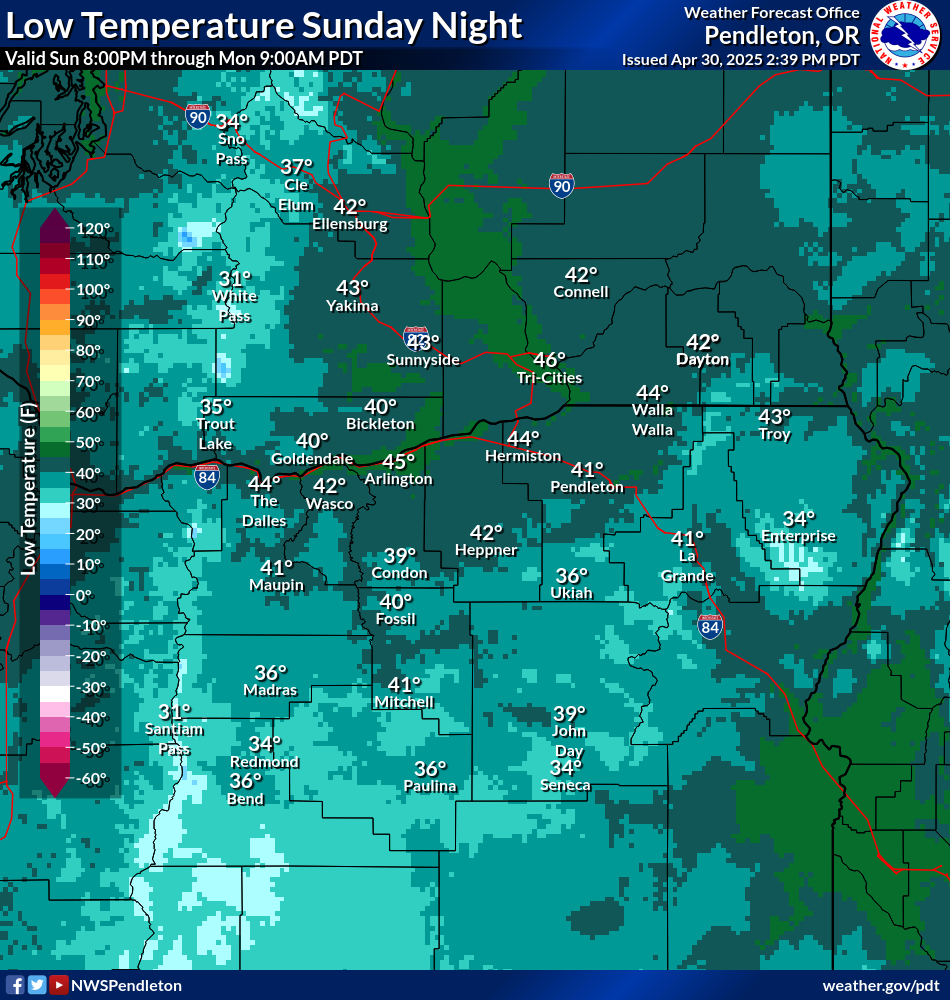
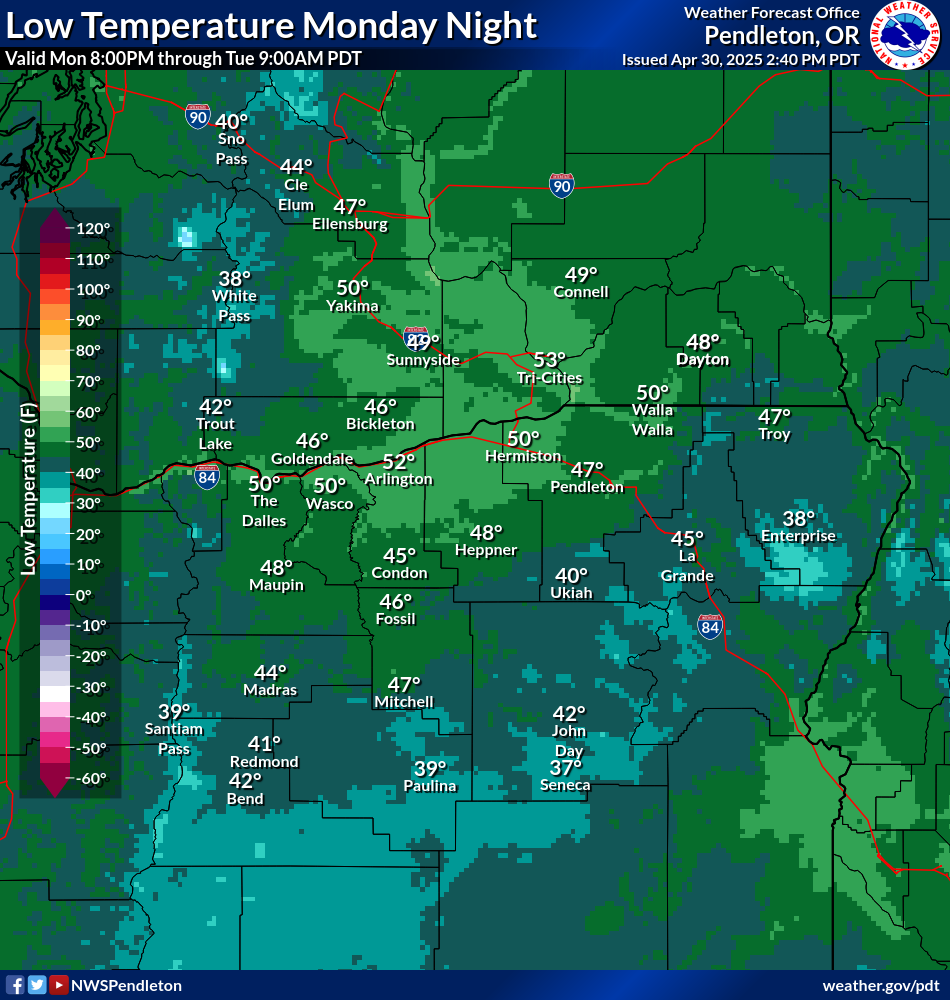
| Day 1 Lows | Day 2 Lows | Day 3 Lows |
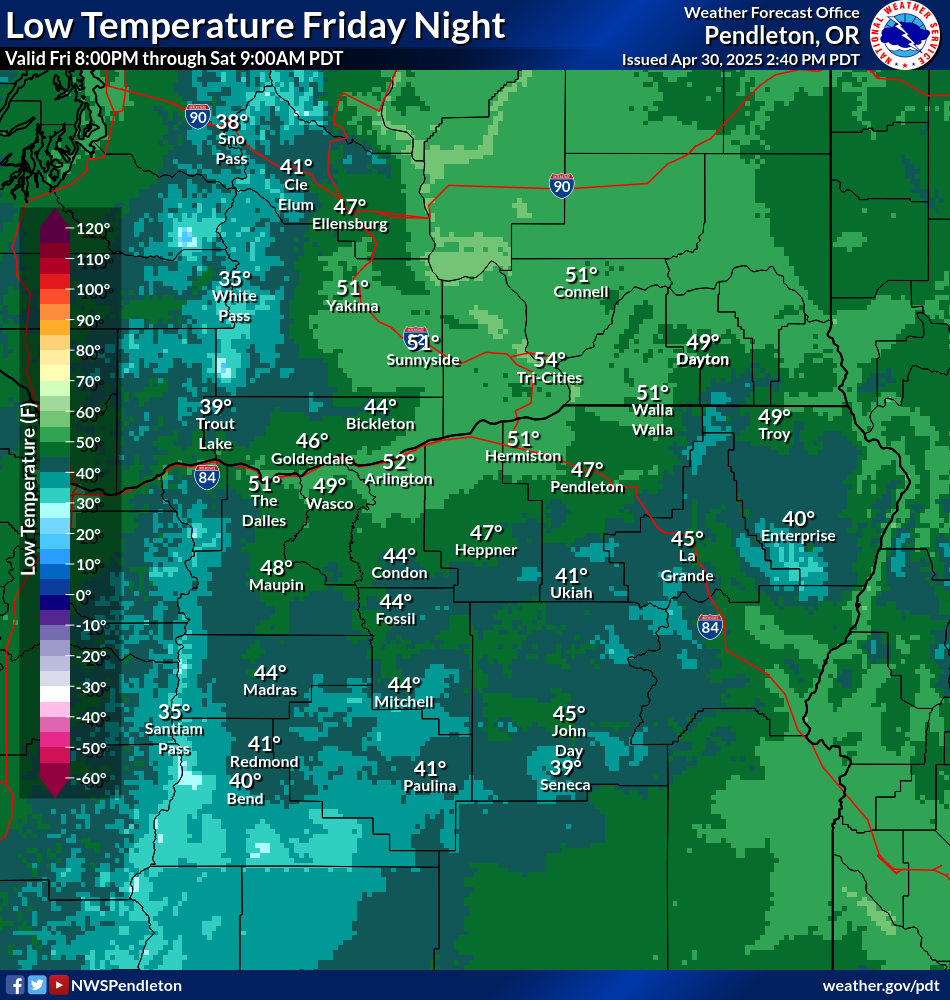
| Day 4 Lows | Day 5 Lows | Day 6 Lows |
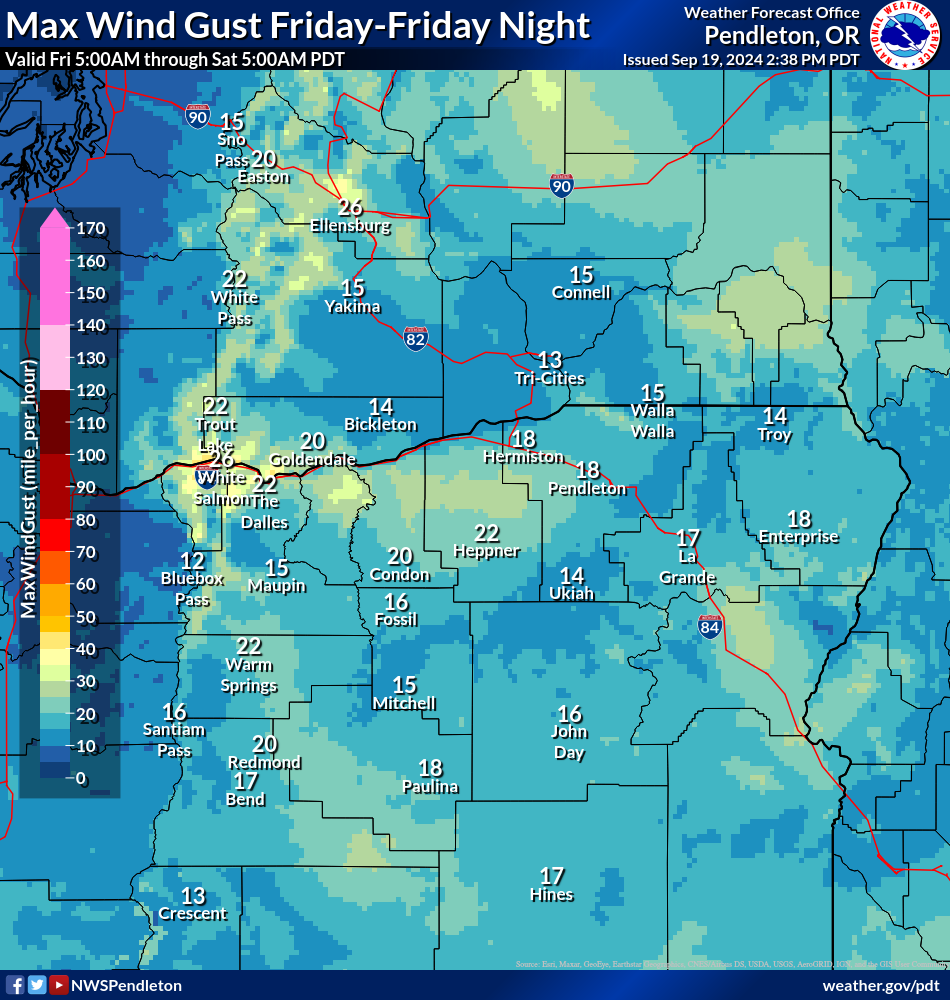
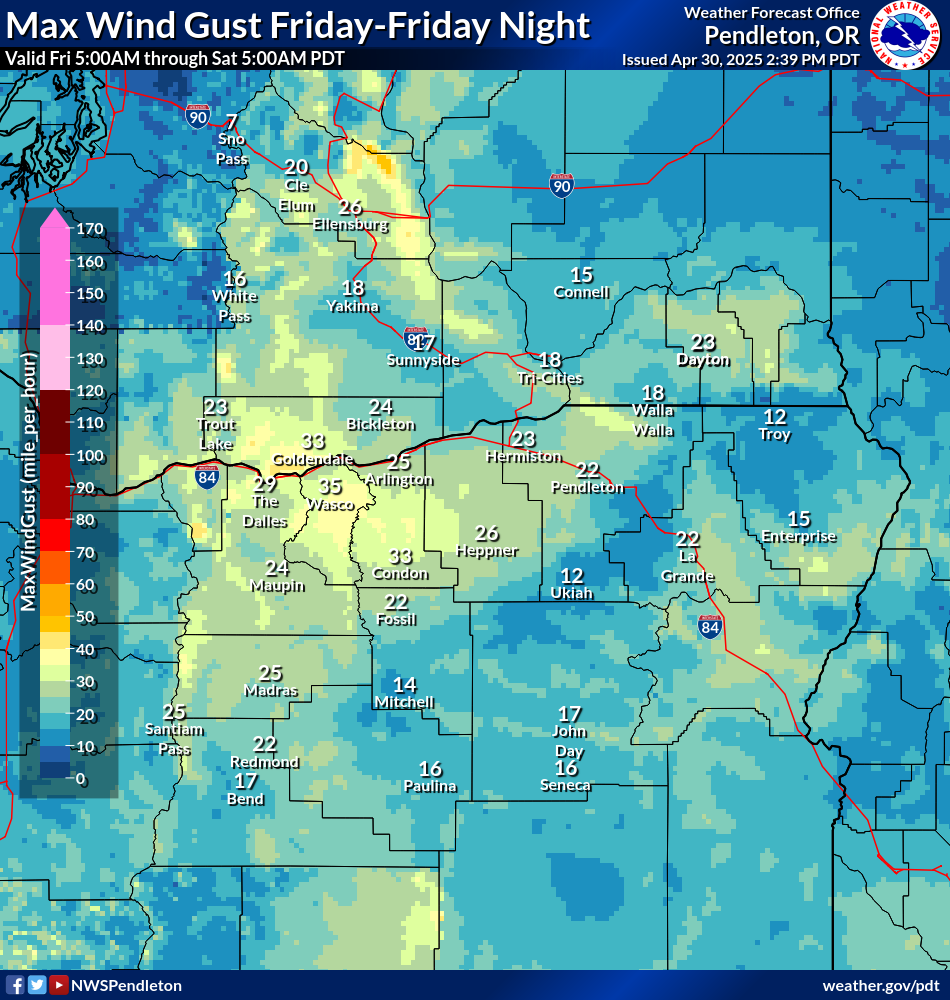
Click on an image to expand
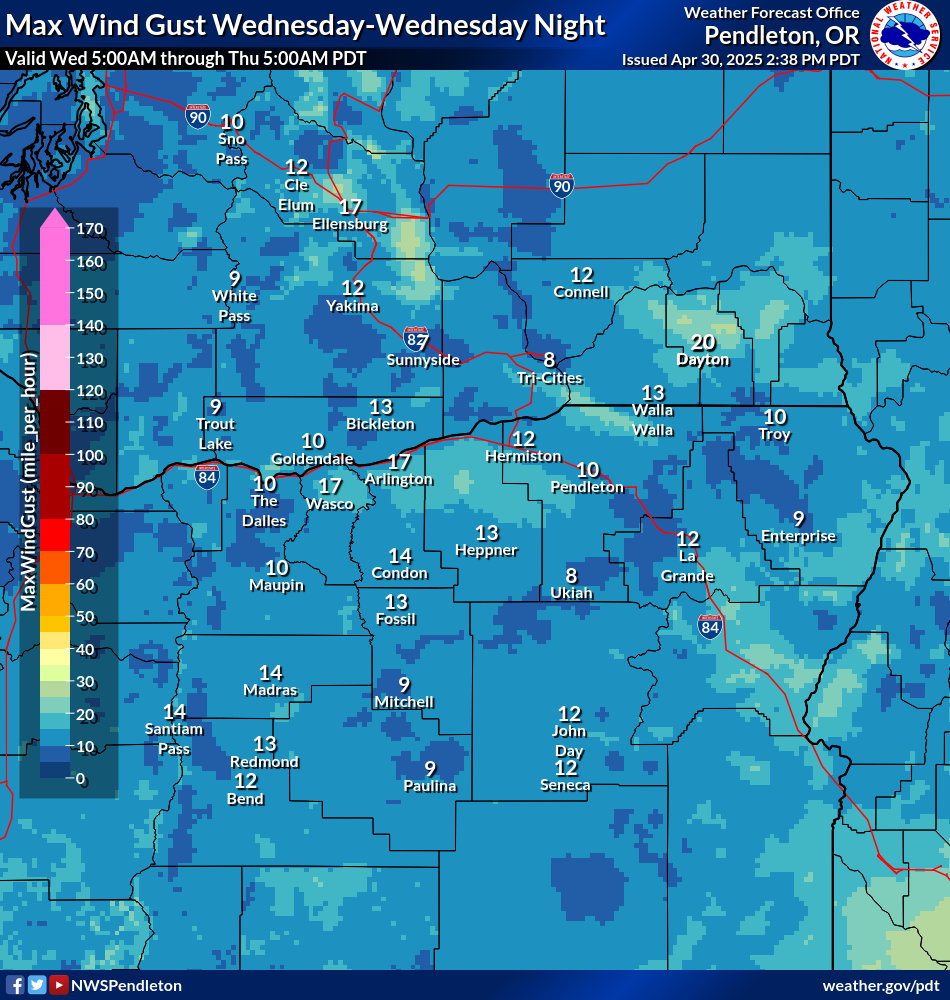
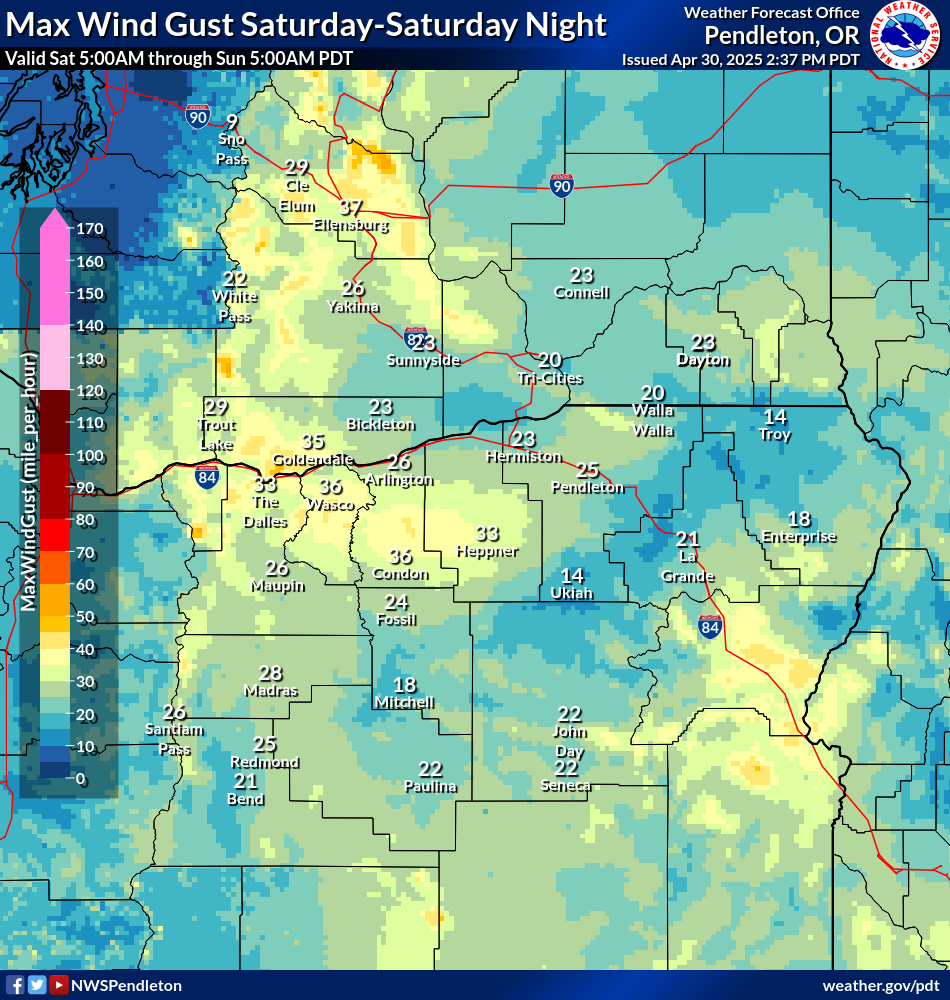
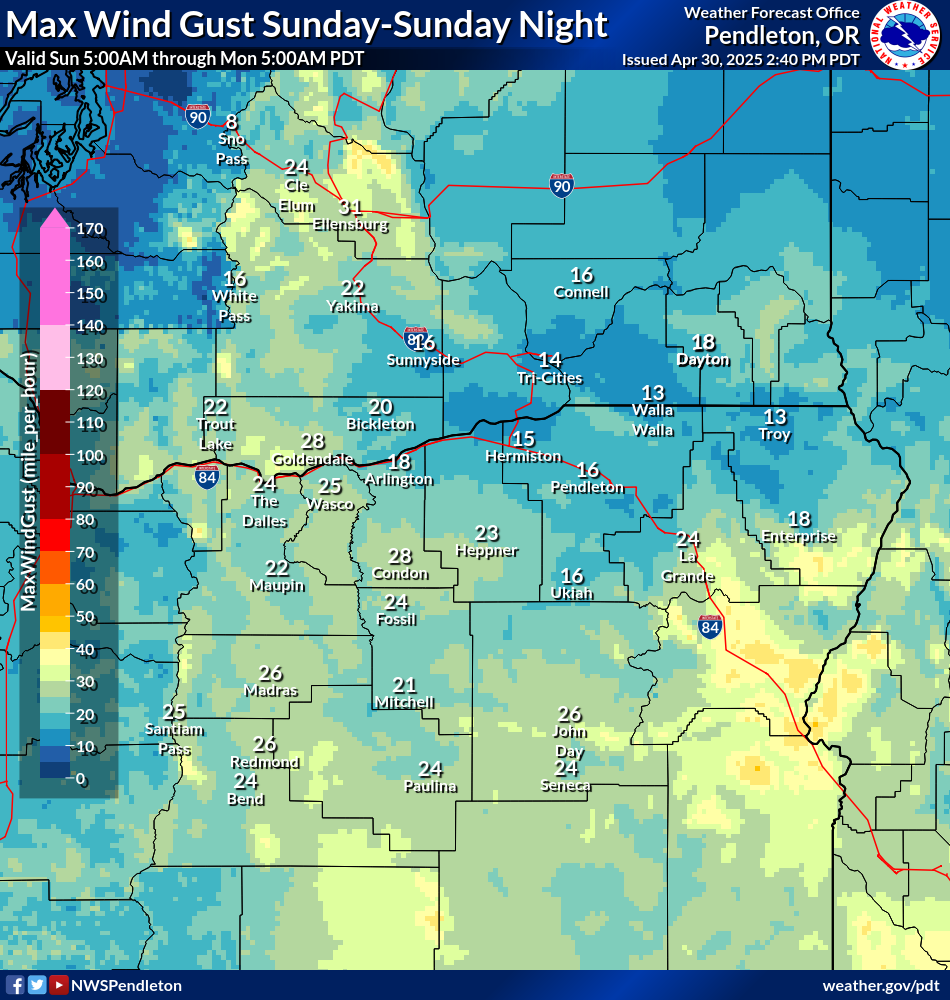
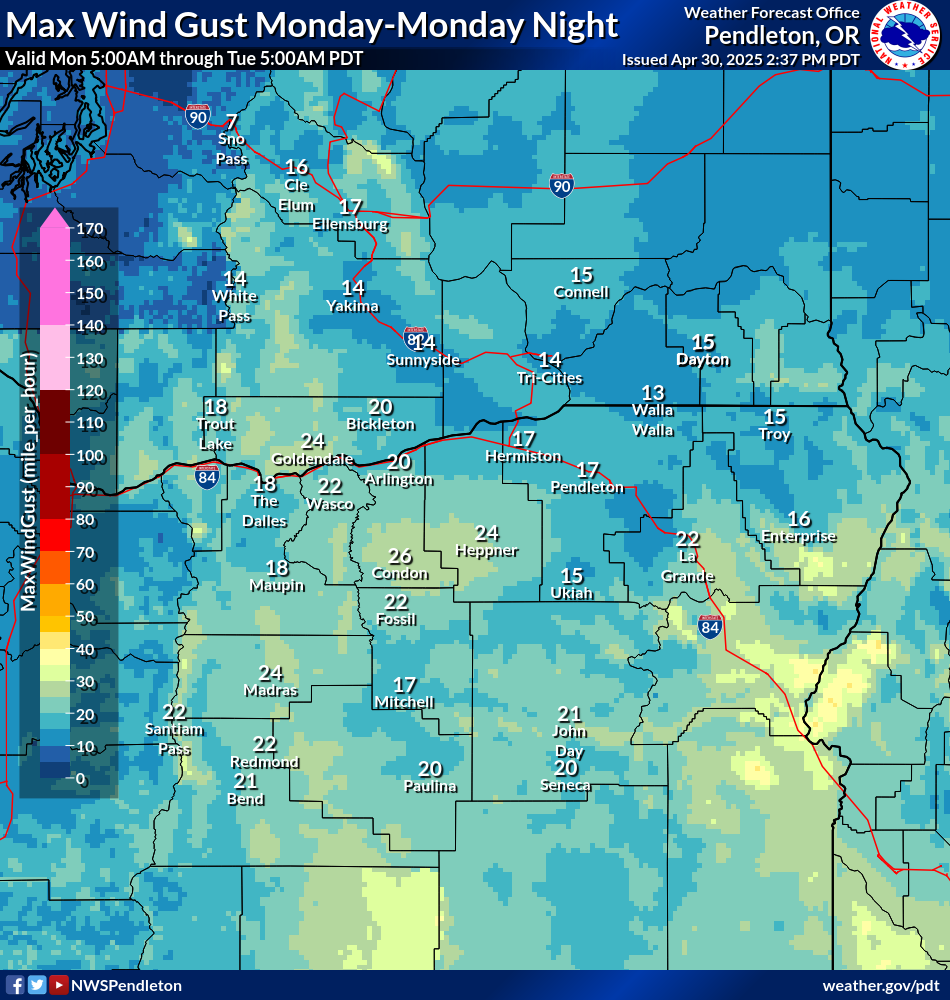
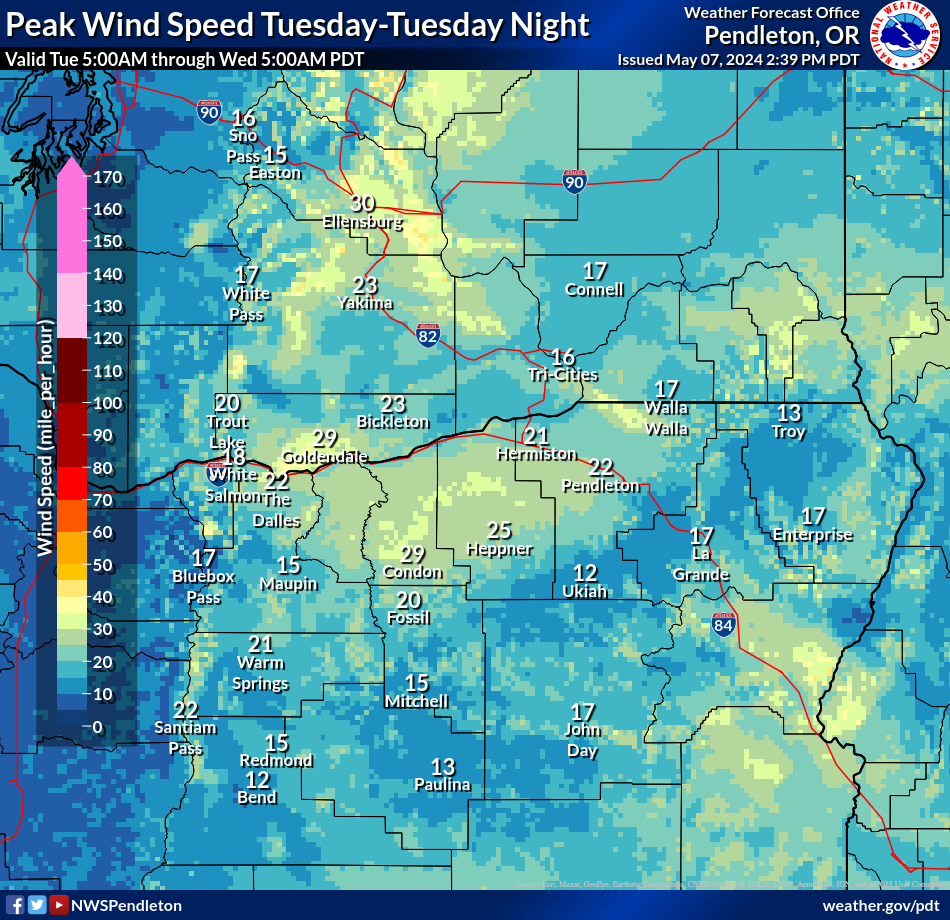
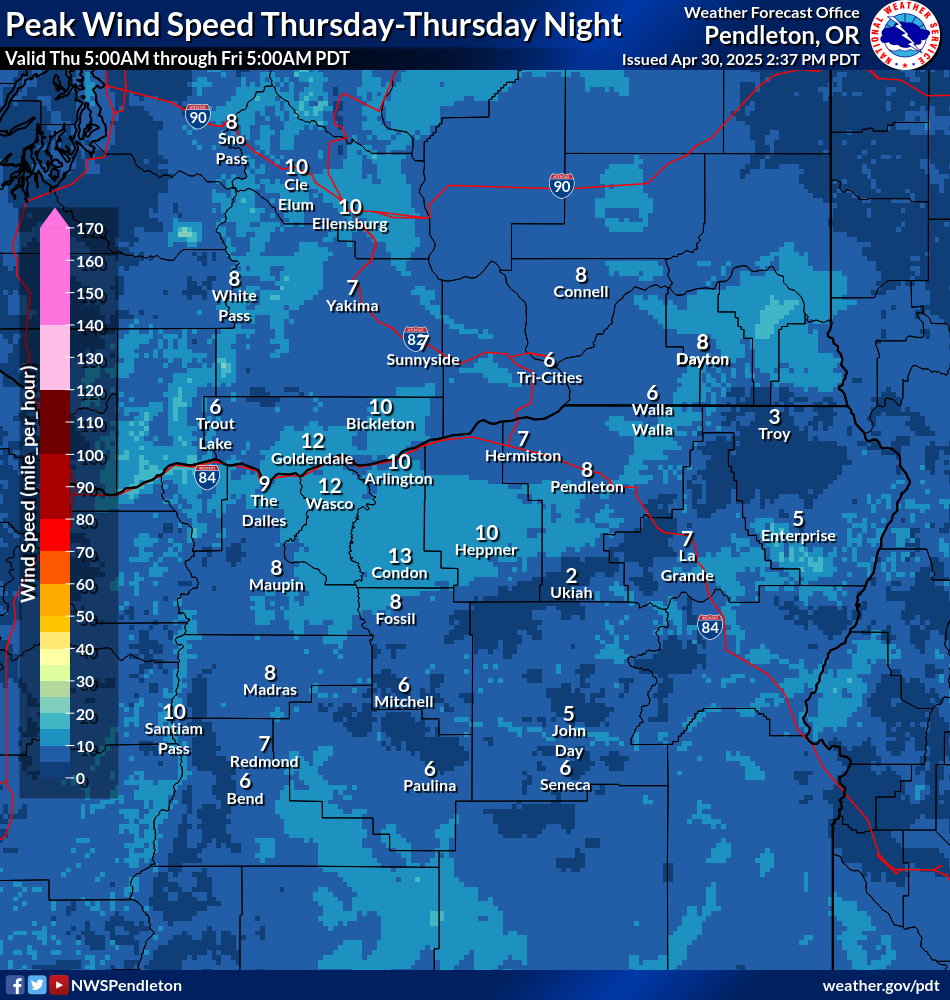
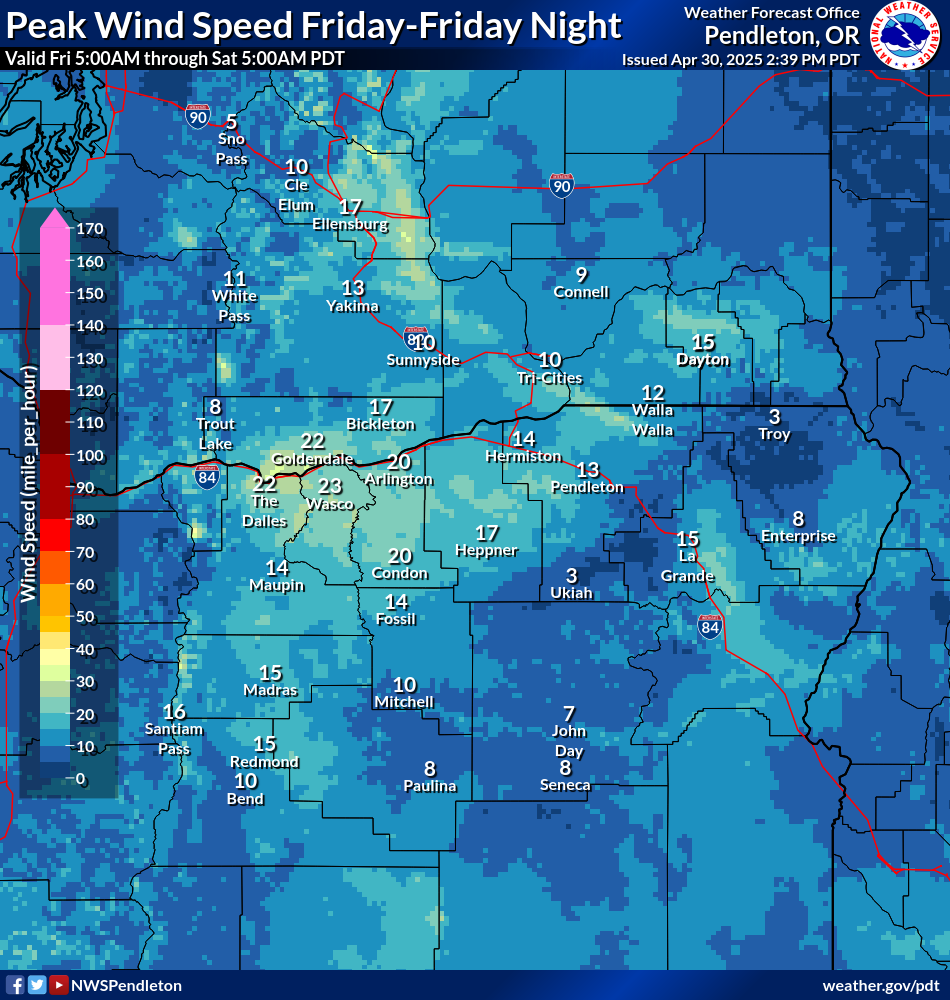
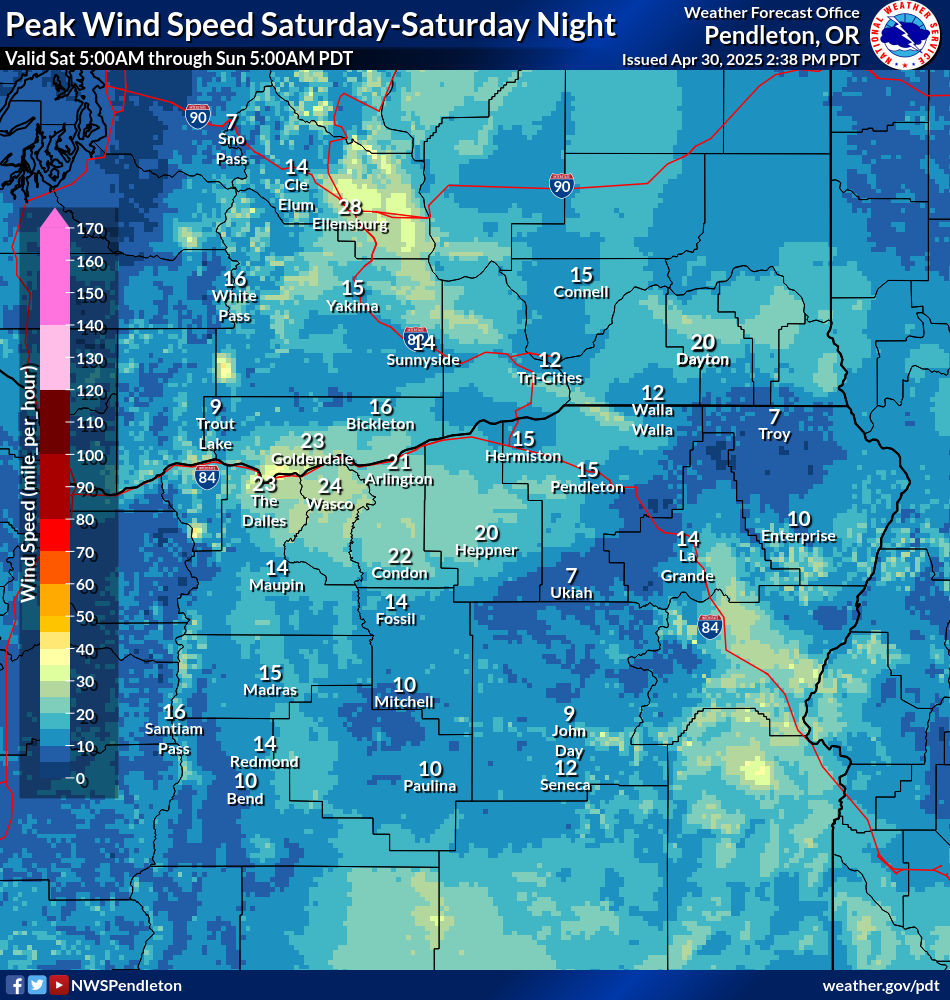
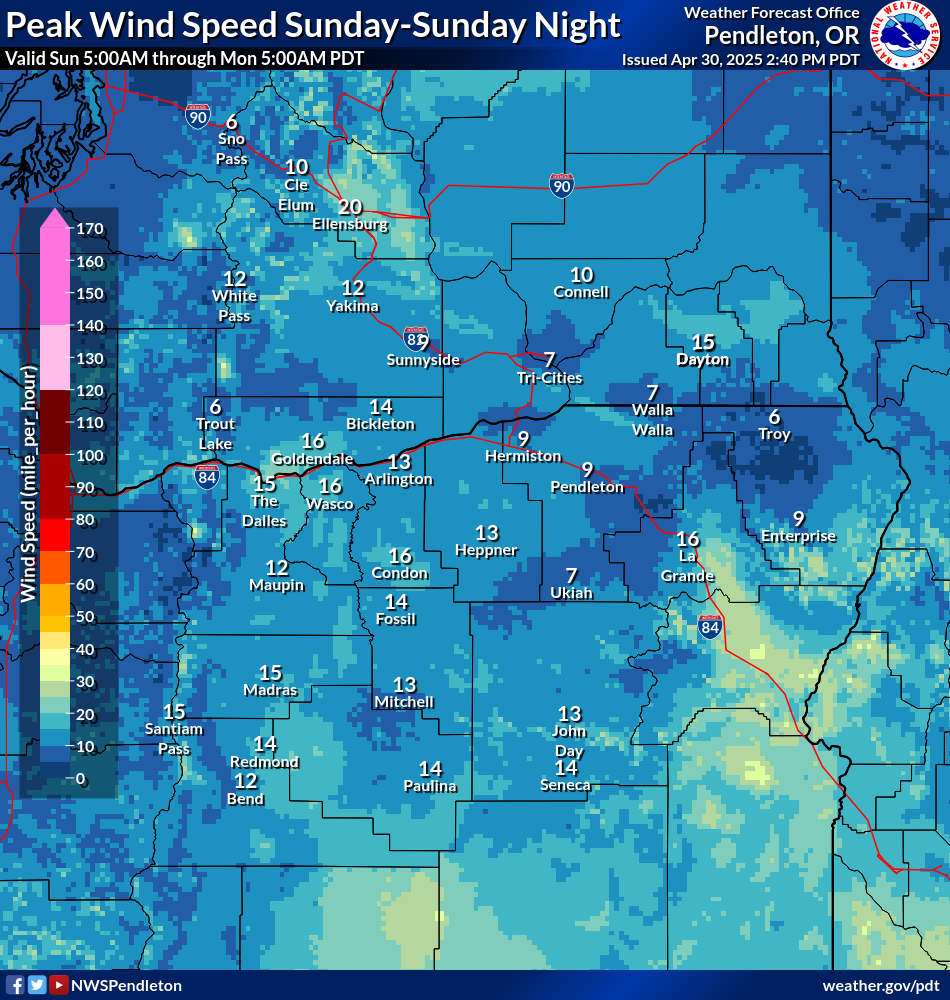
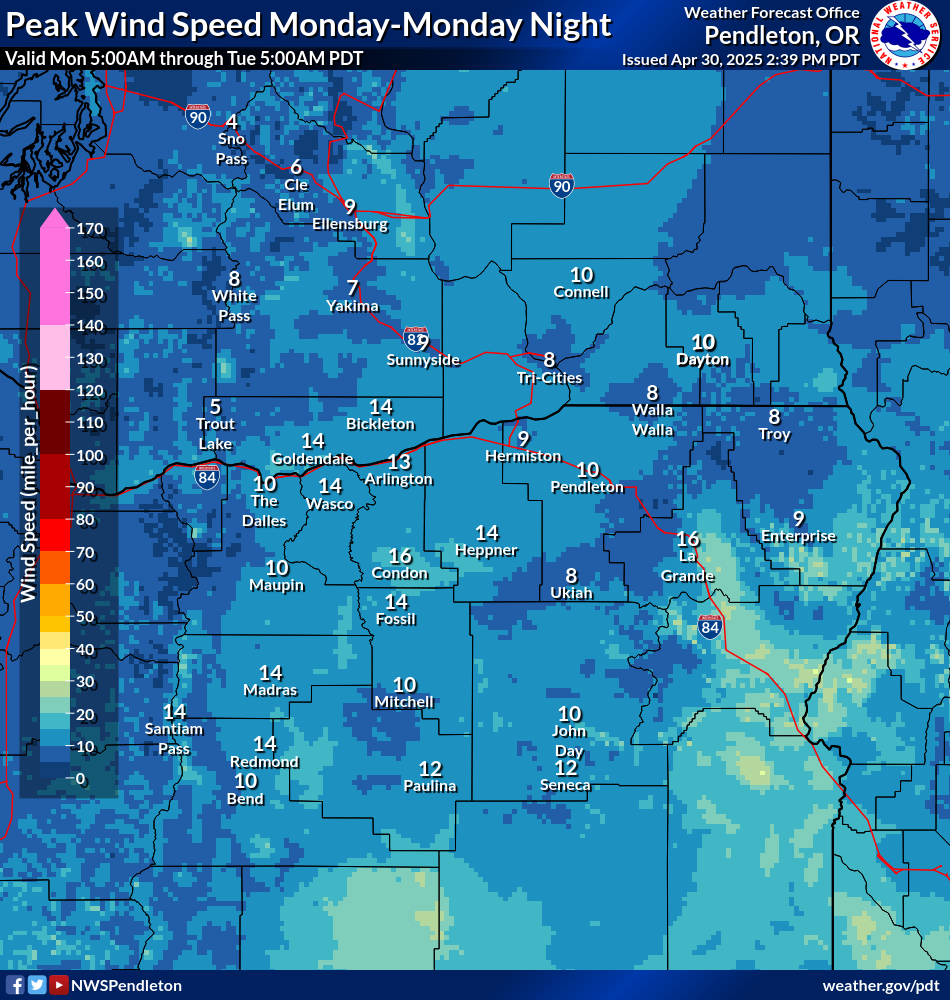
| Day 1 Peak Gusts | Day 2 Peak Gusts | Day 3 Peak Gusts |
| Day 4 Peak Gusts | Day 5 Peak Gusts | Day 6 Peak Gusts |
| Day 1 Peak Sustained Winds | Day 2 Peak Sustained Winds | Day 3 Peak Sustained Winds |
| Day 4 Peak Sustained Winds | Day 5 Peak Sustained Winds | Day 6 Peak Sustained Winds |
Click on an image to expand
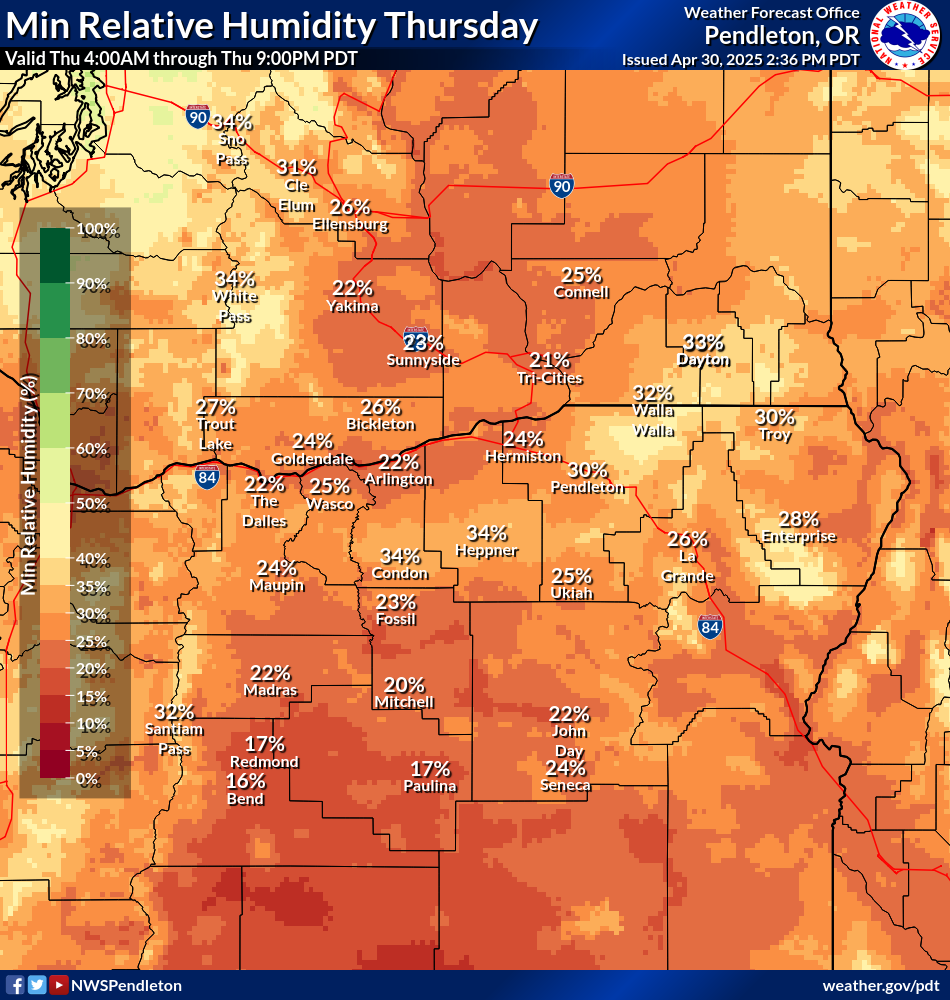
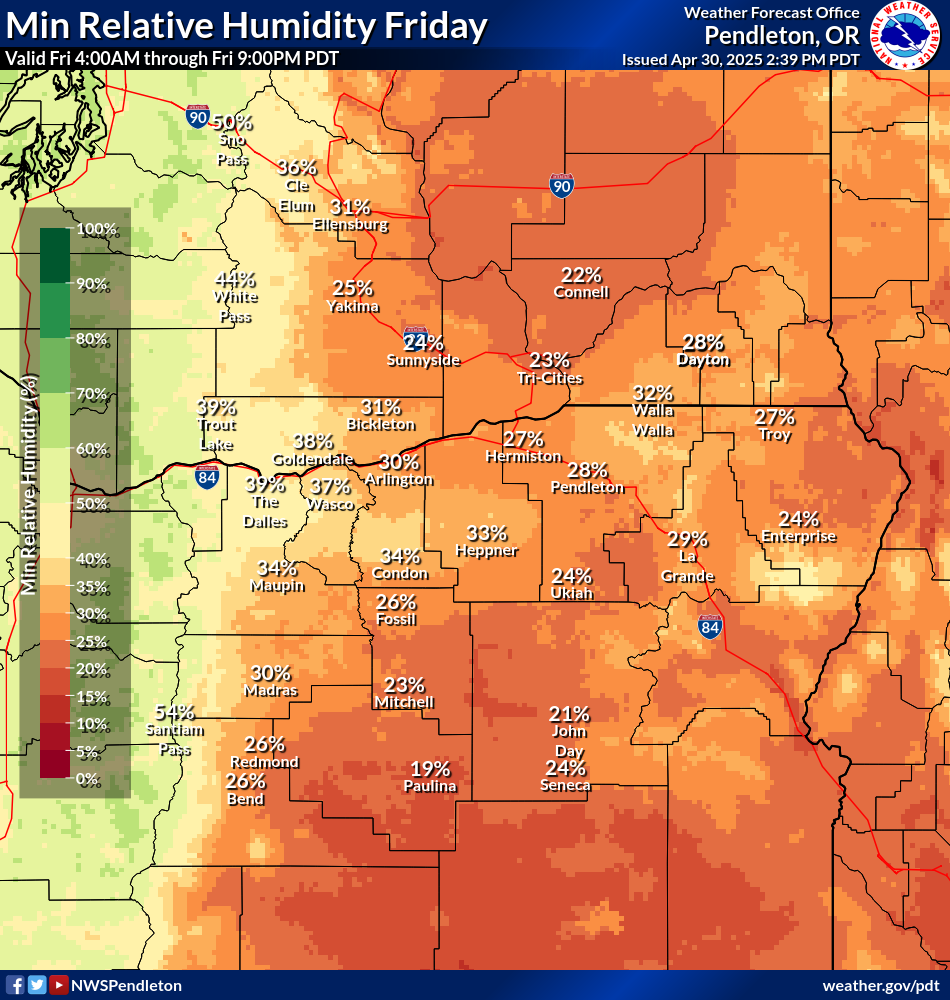
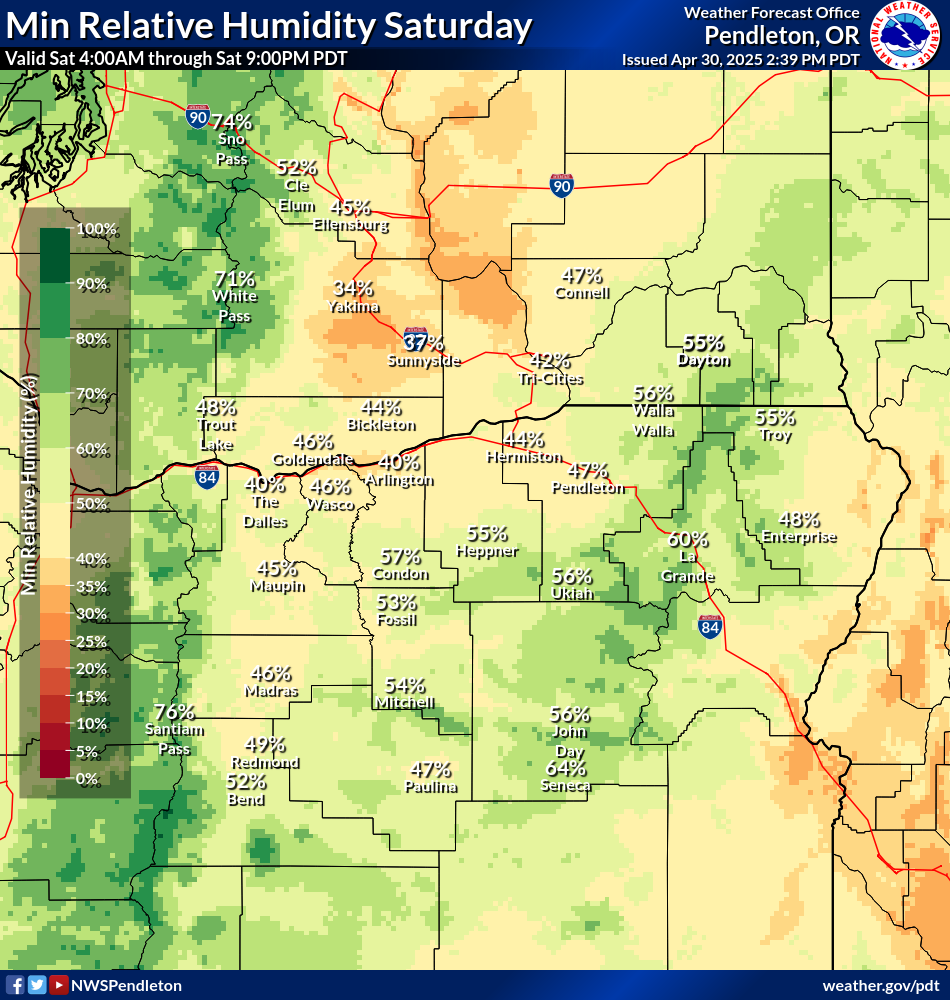
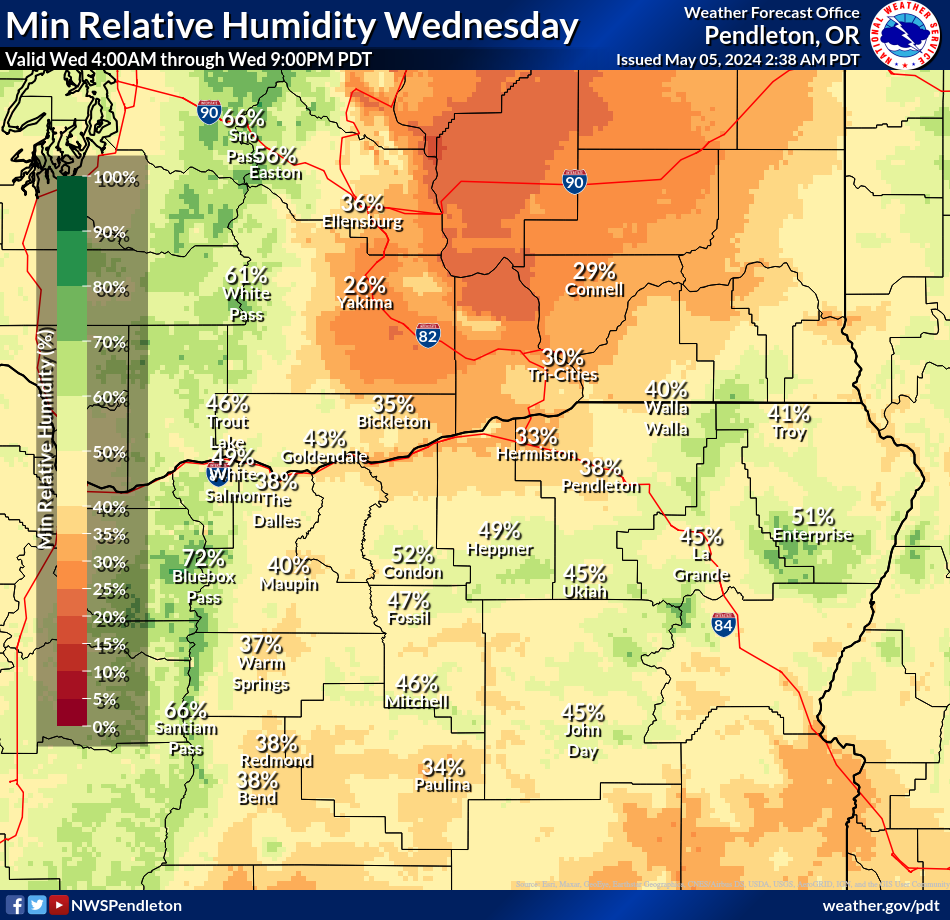
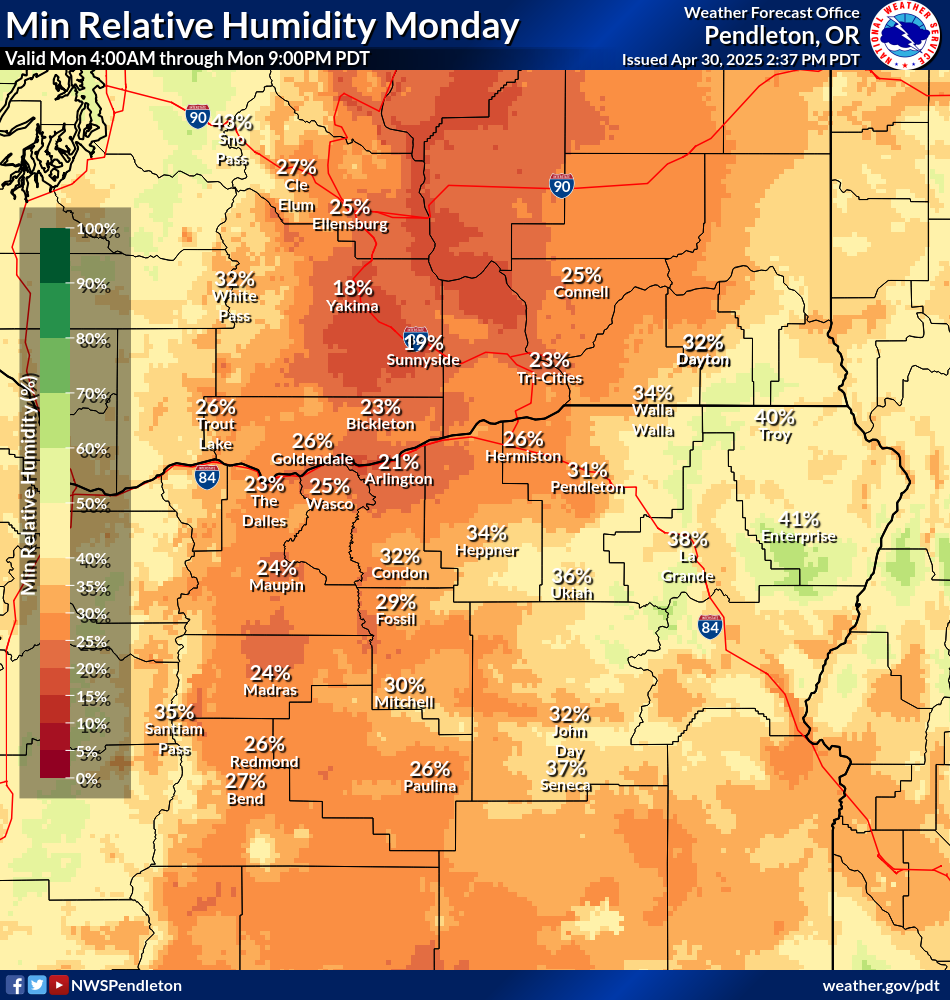
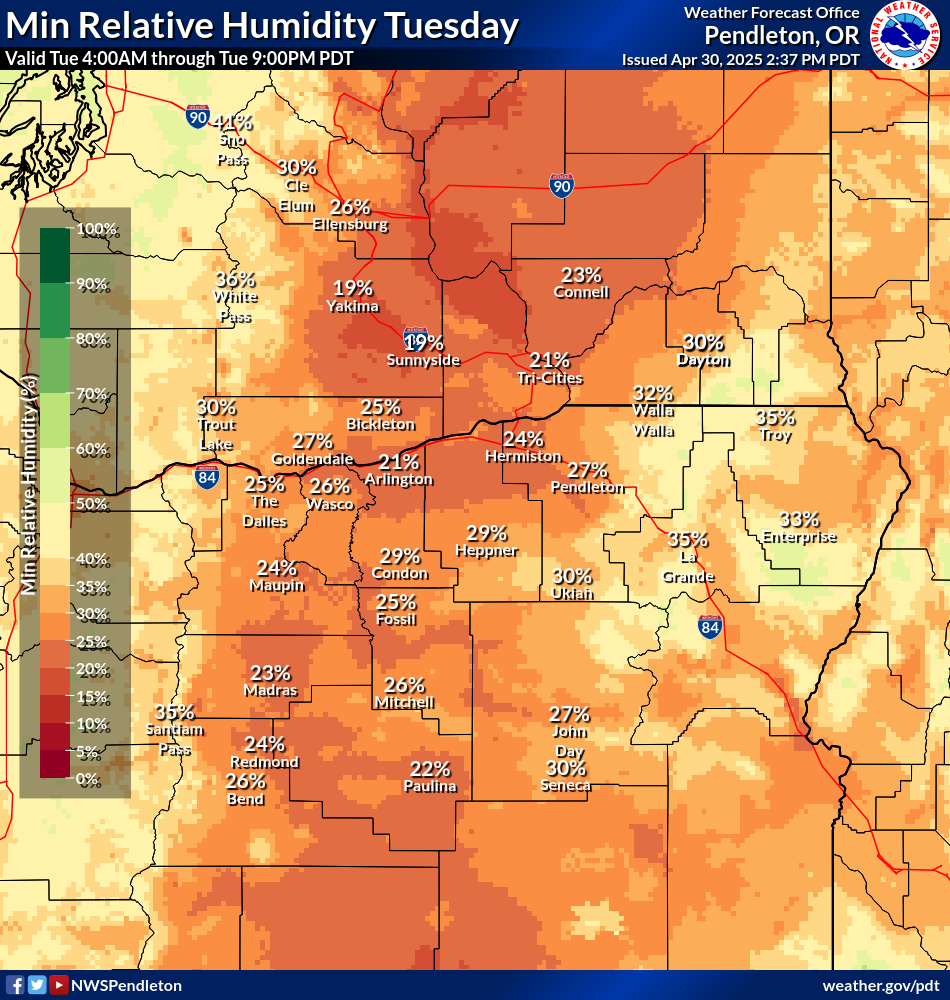
| Day 1 Min RH | Day 2 Min RH | Day 3 Min RH |
| Day 4 Min RH | Day 5 Min RH | Day 6 Min RH |
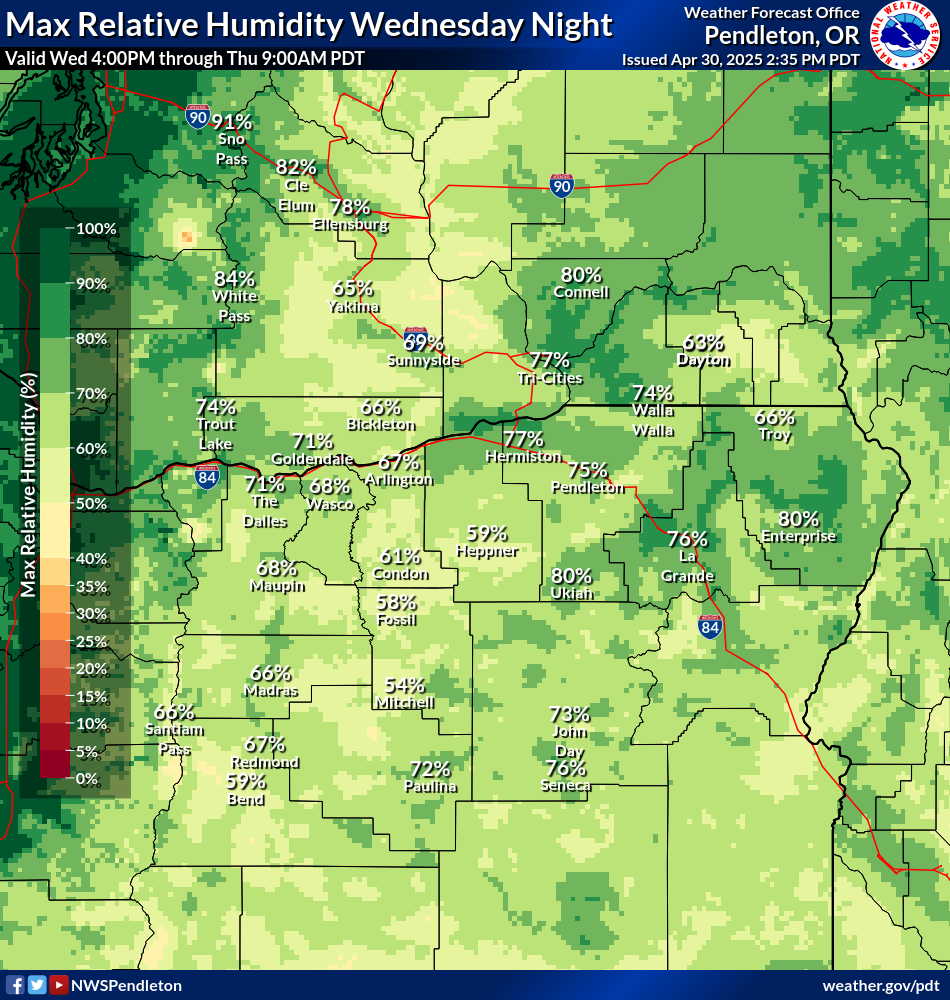
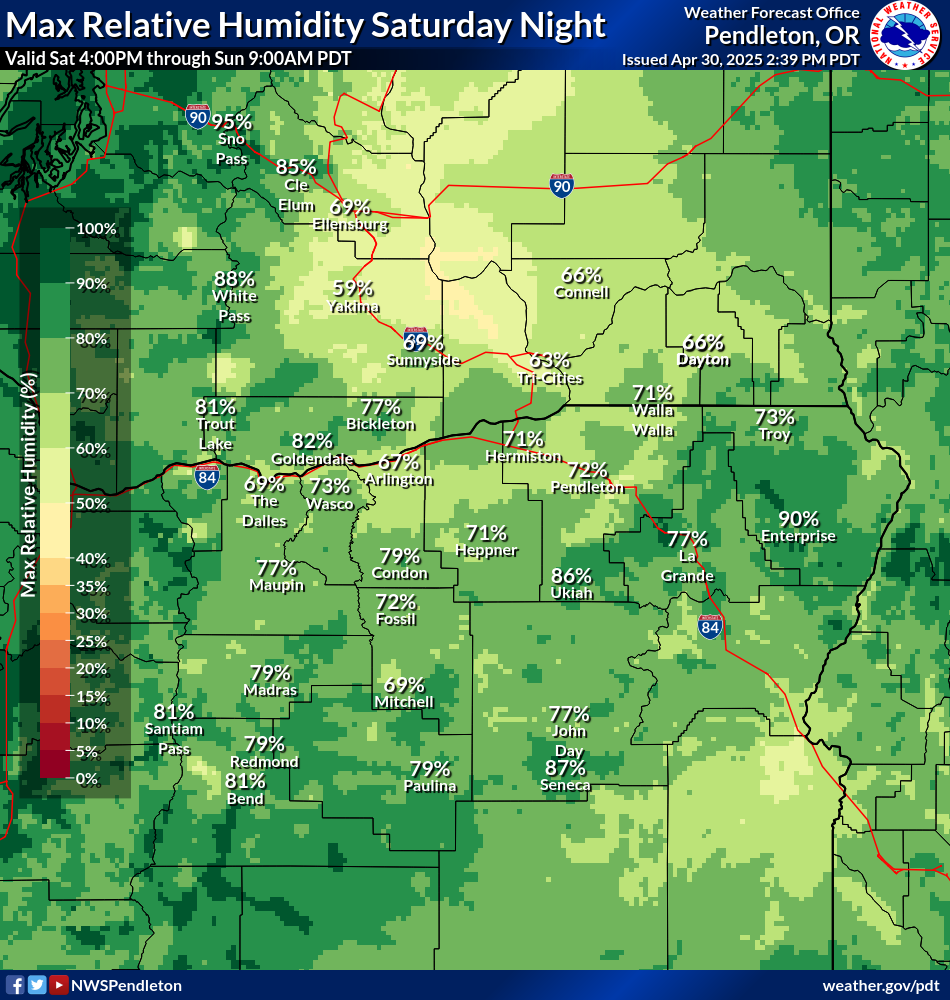
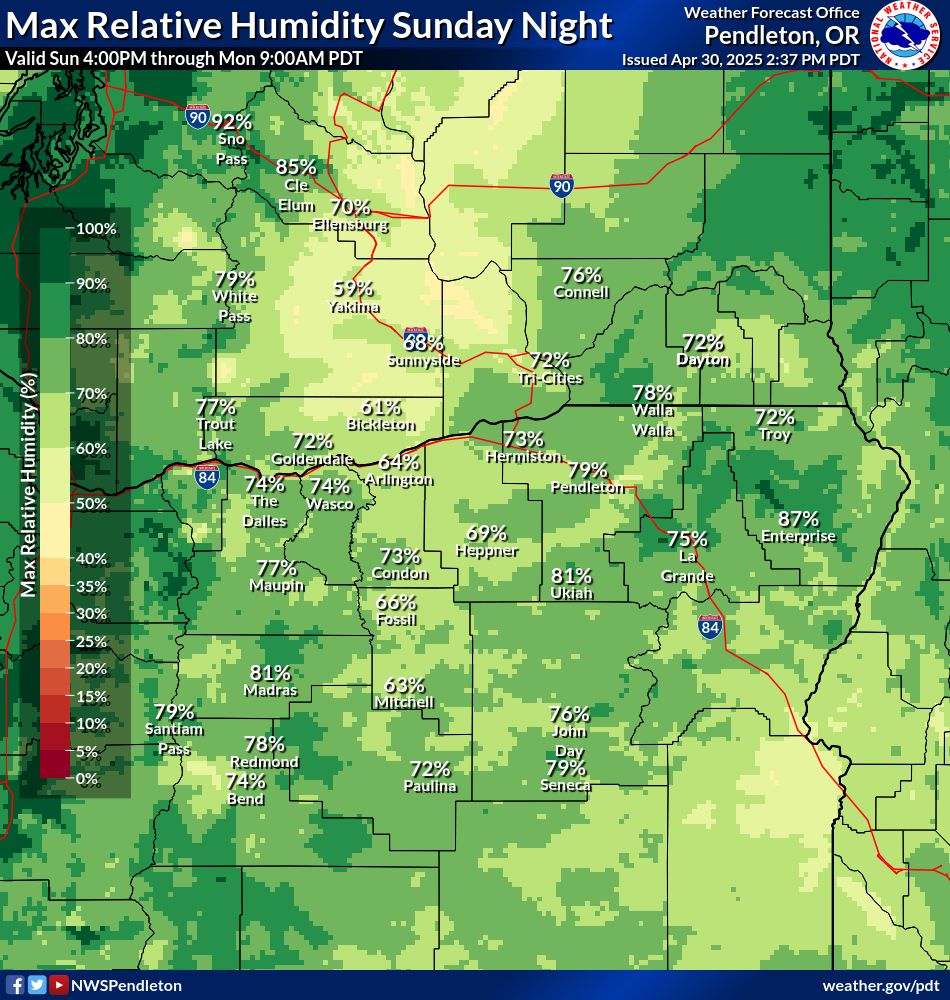
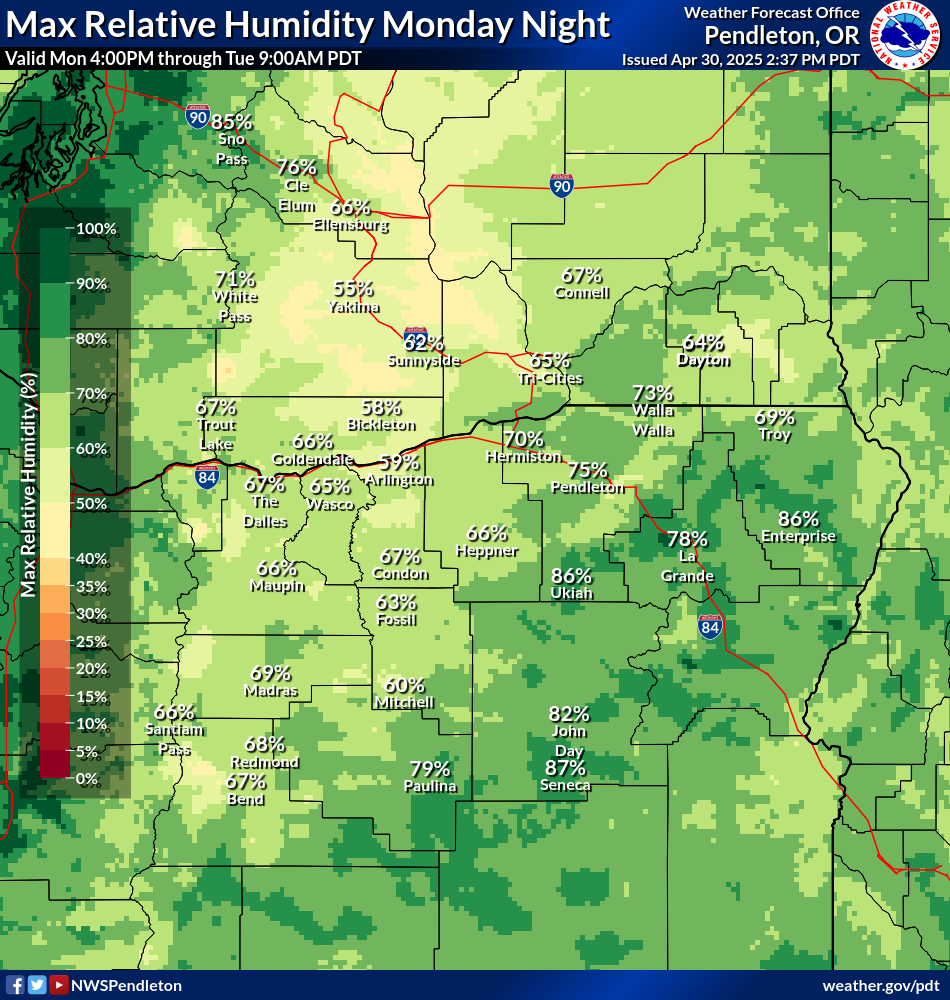
| Day 1 Max RH | Day 2 Max RH | Day 3 Max RH |
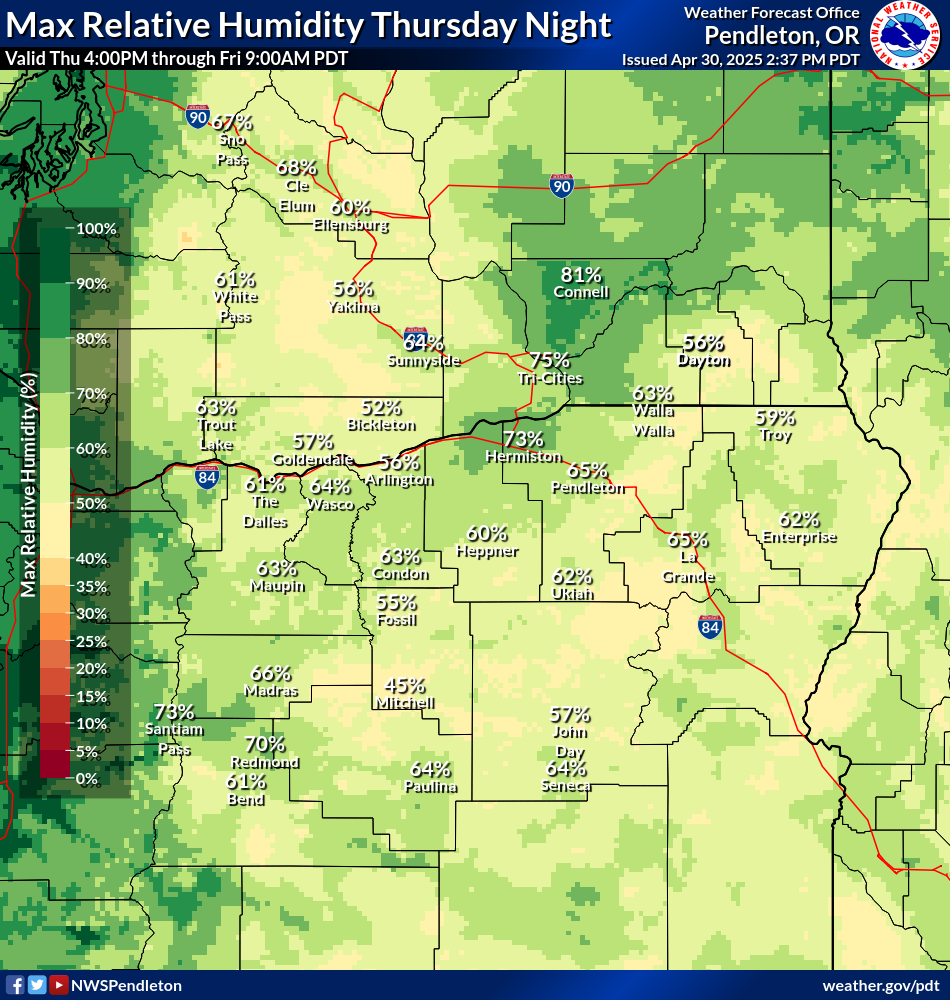
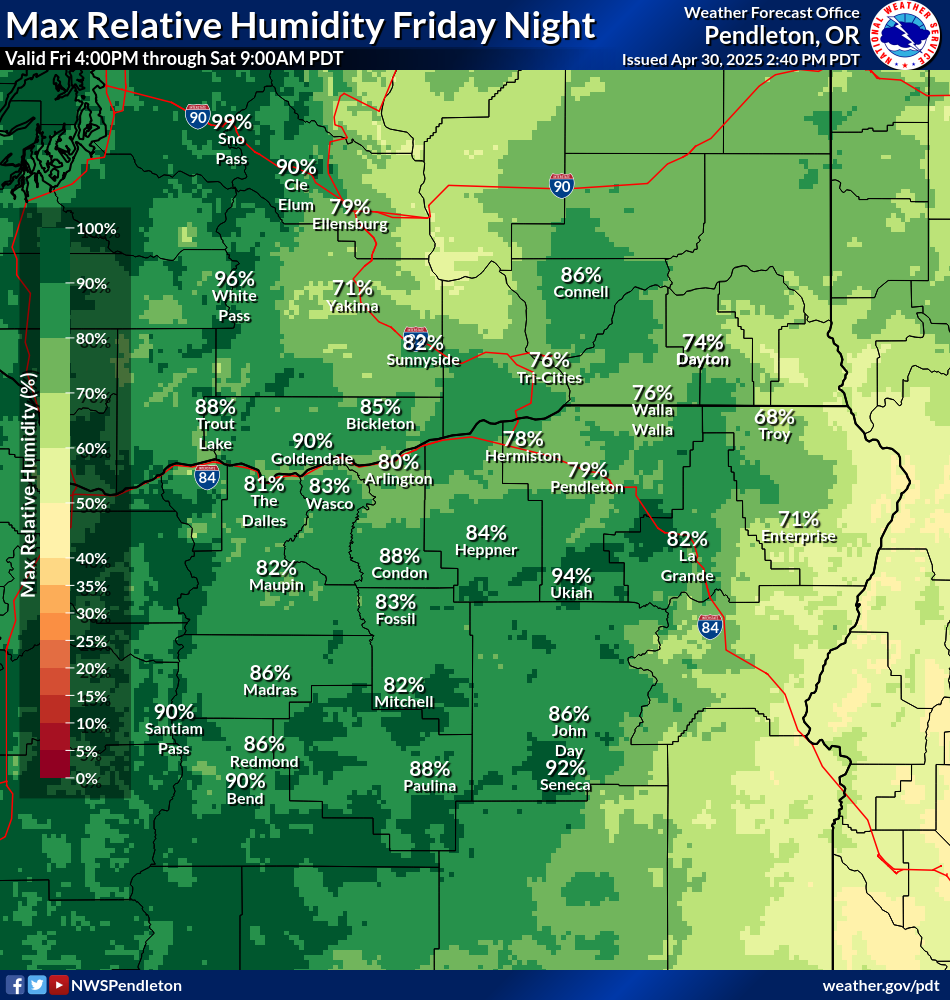
| Day 4 Max RH | Day 5 Max RH | Day 6 Max RH |
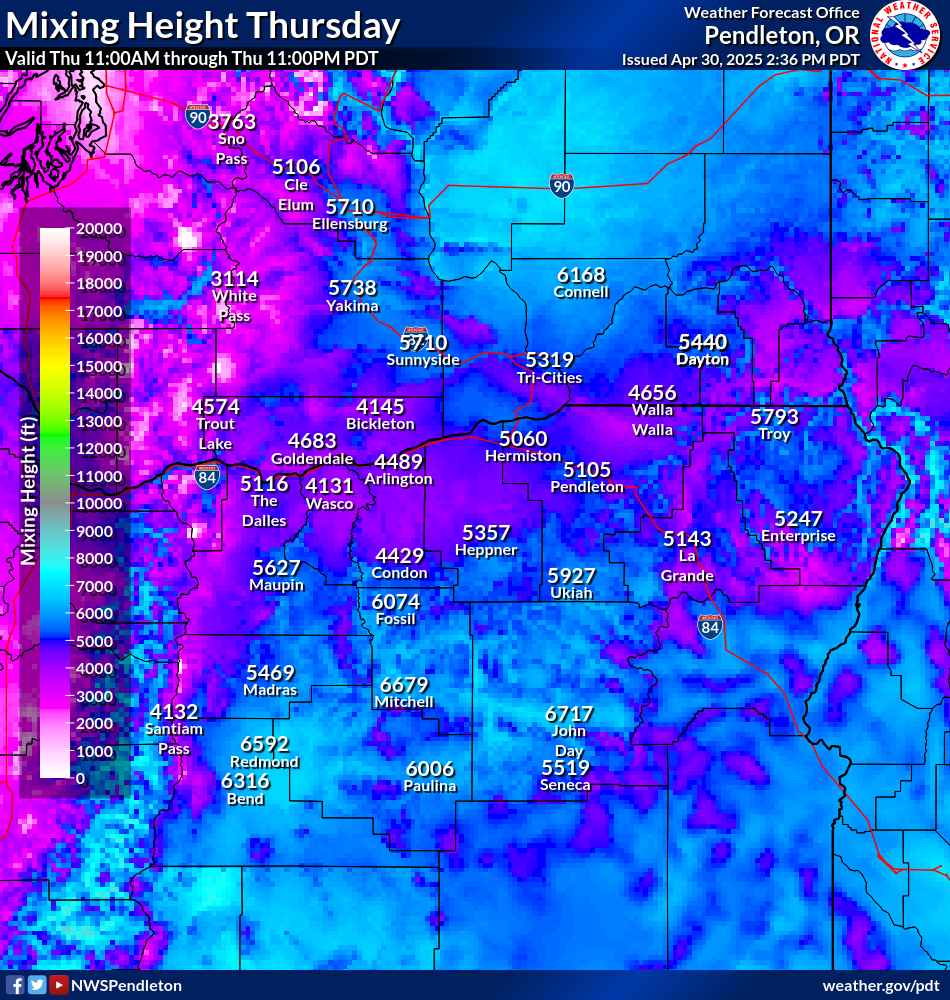
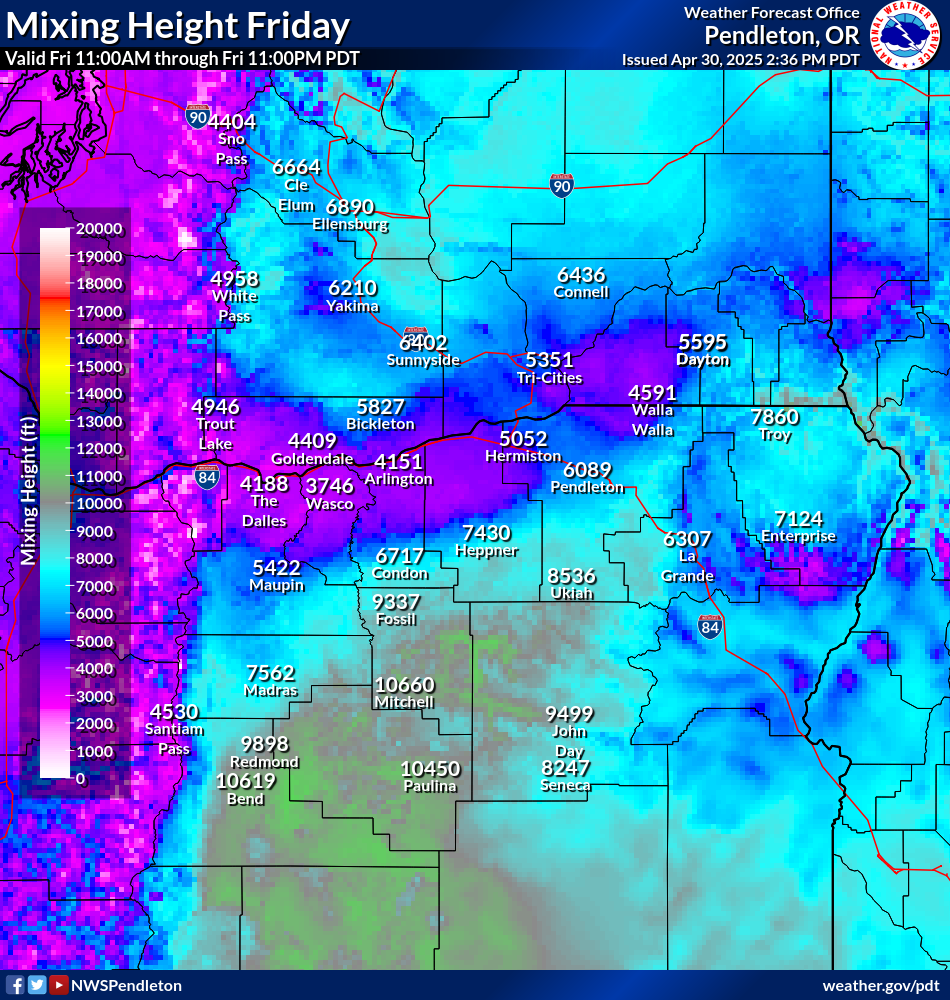
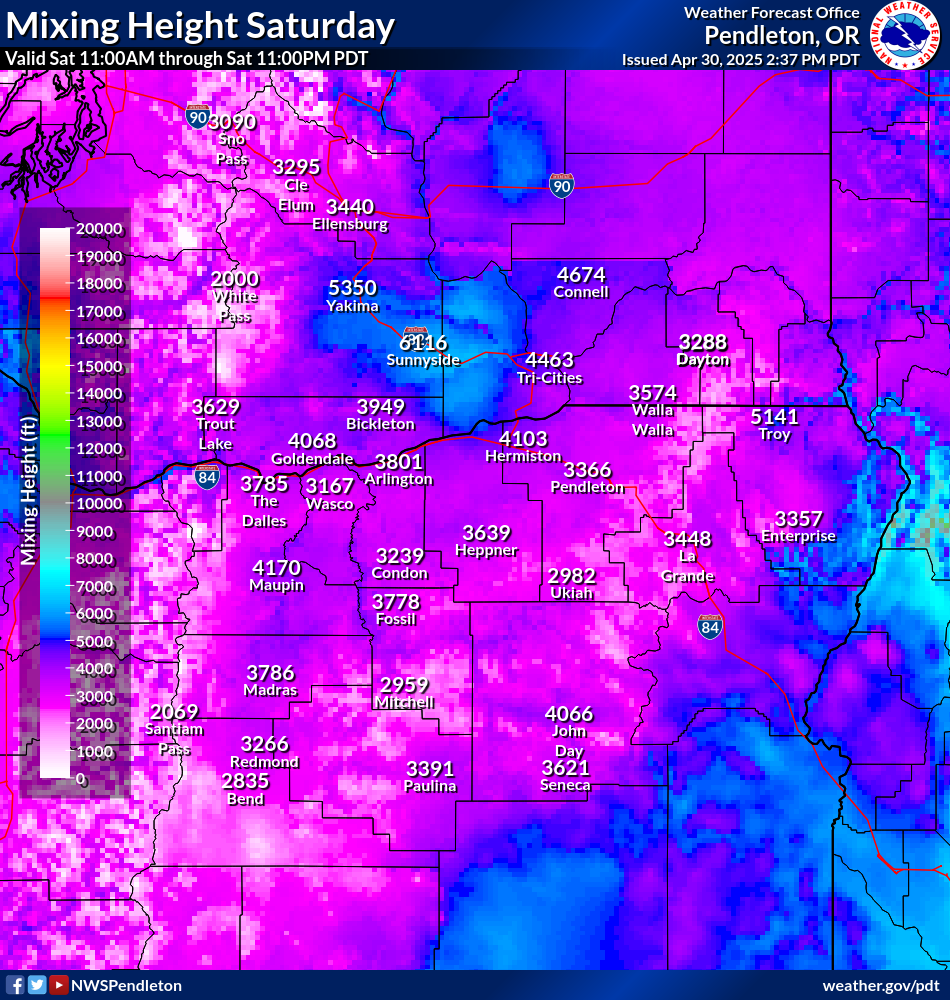
| Mixing Height Day 1 | Mixing Height Day 2 | Mixing Height Day 3 |
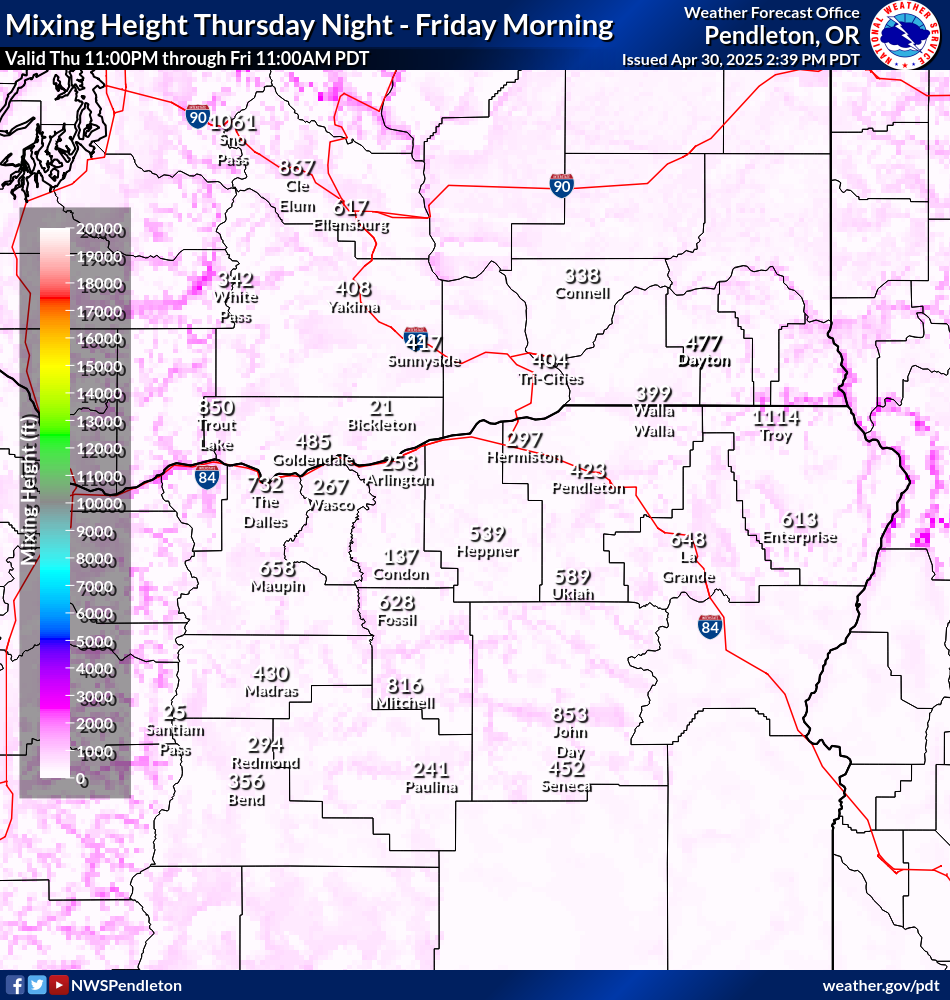
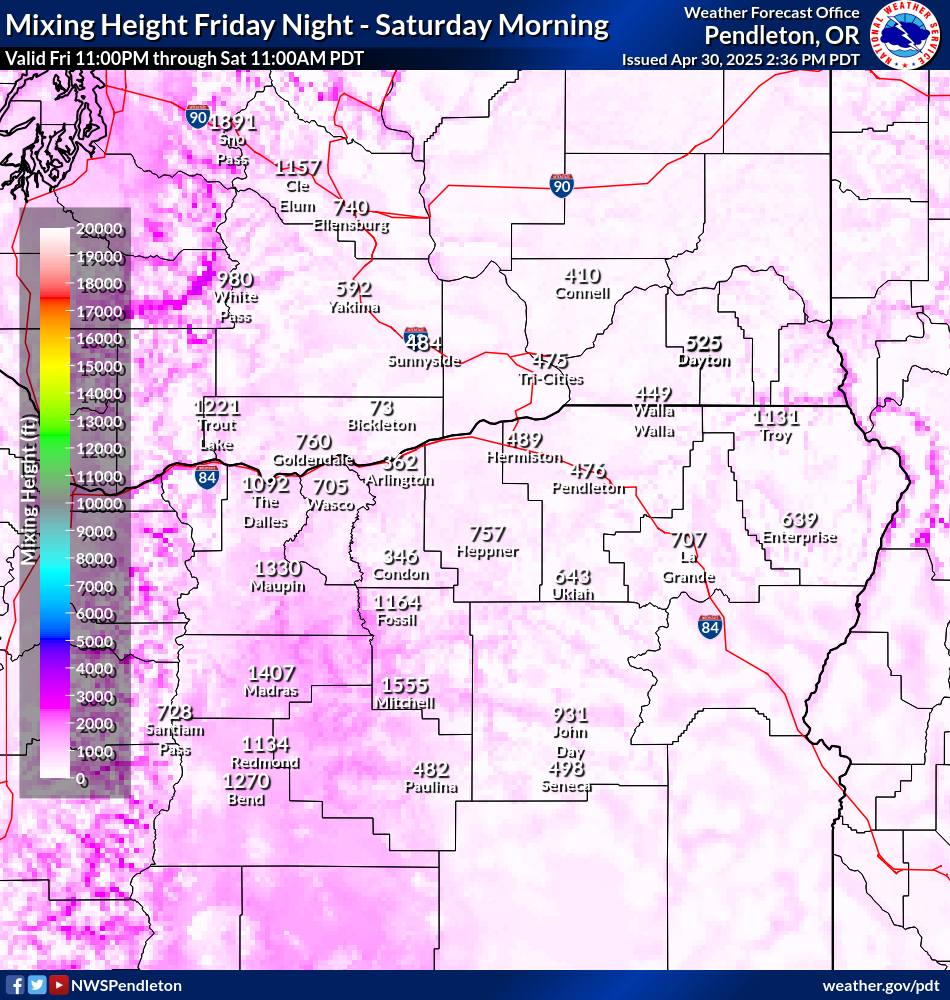
| Mixing Height Night 1 | Mixing Height Night 2 | Mixing Height Night 3 |

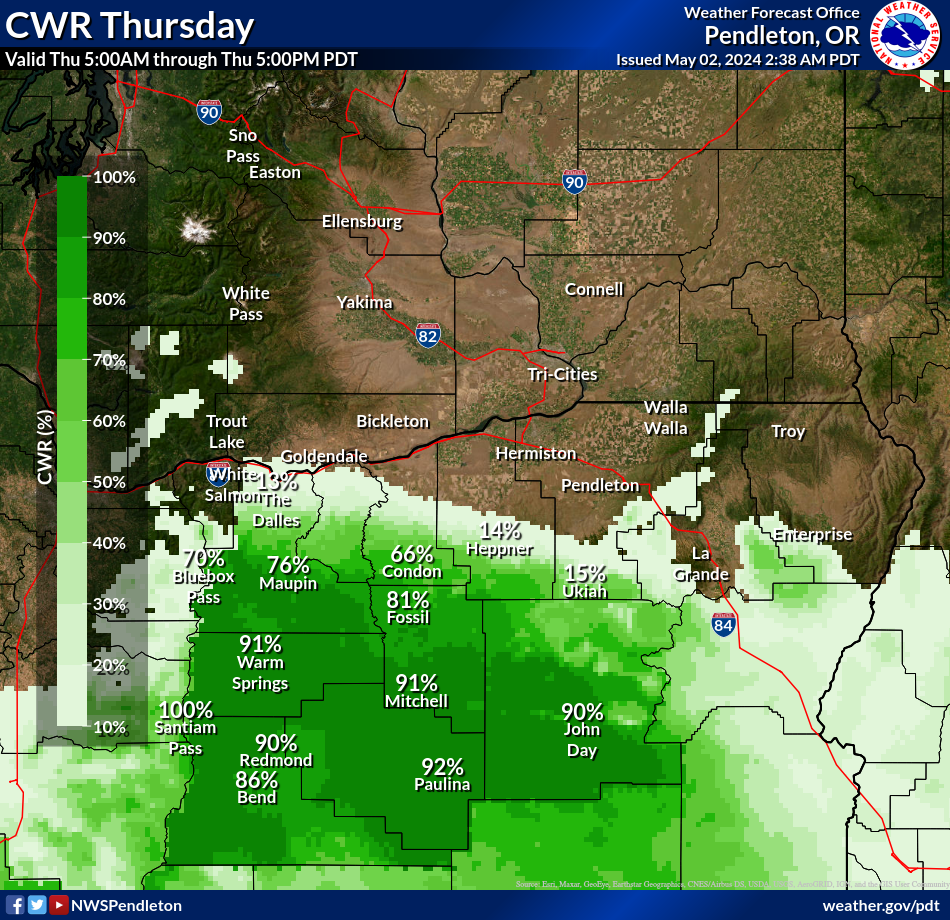
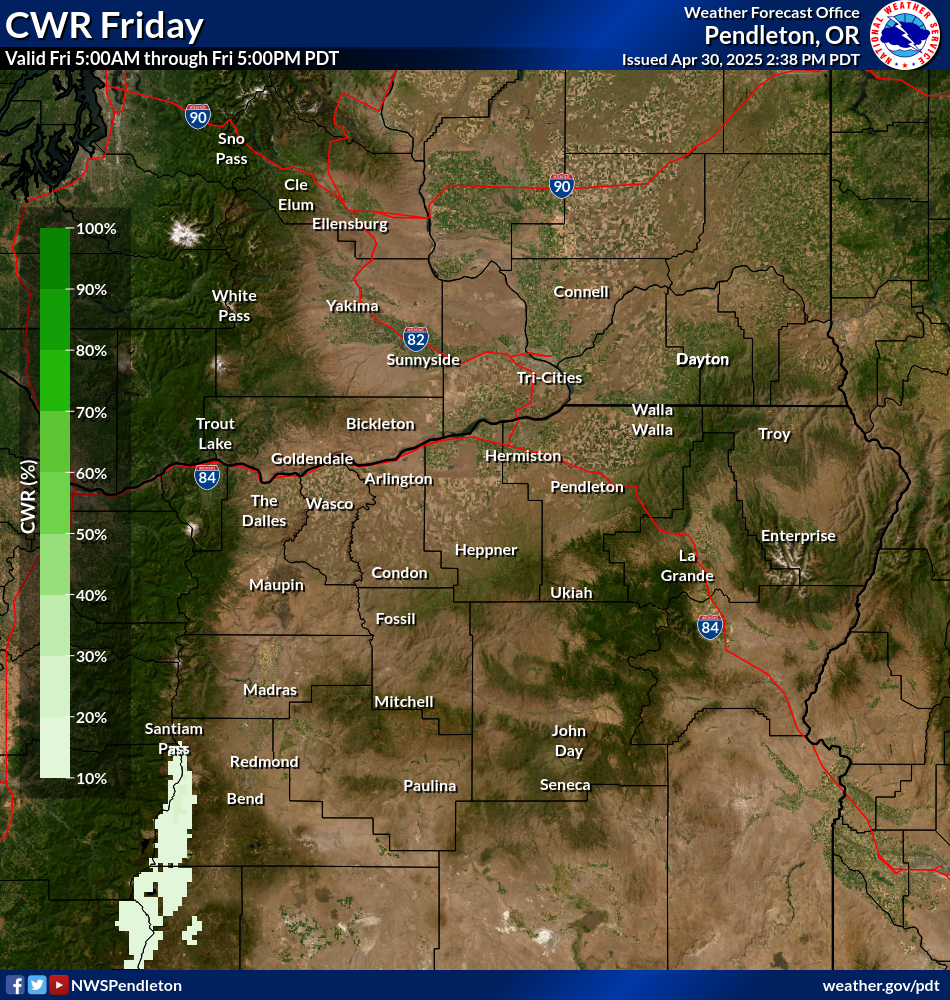
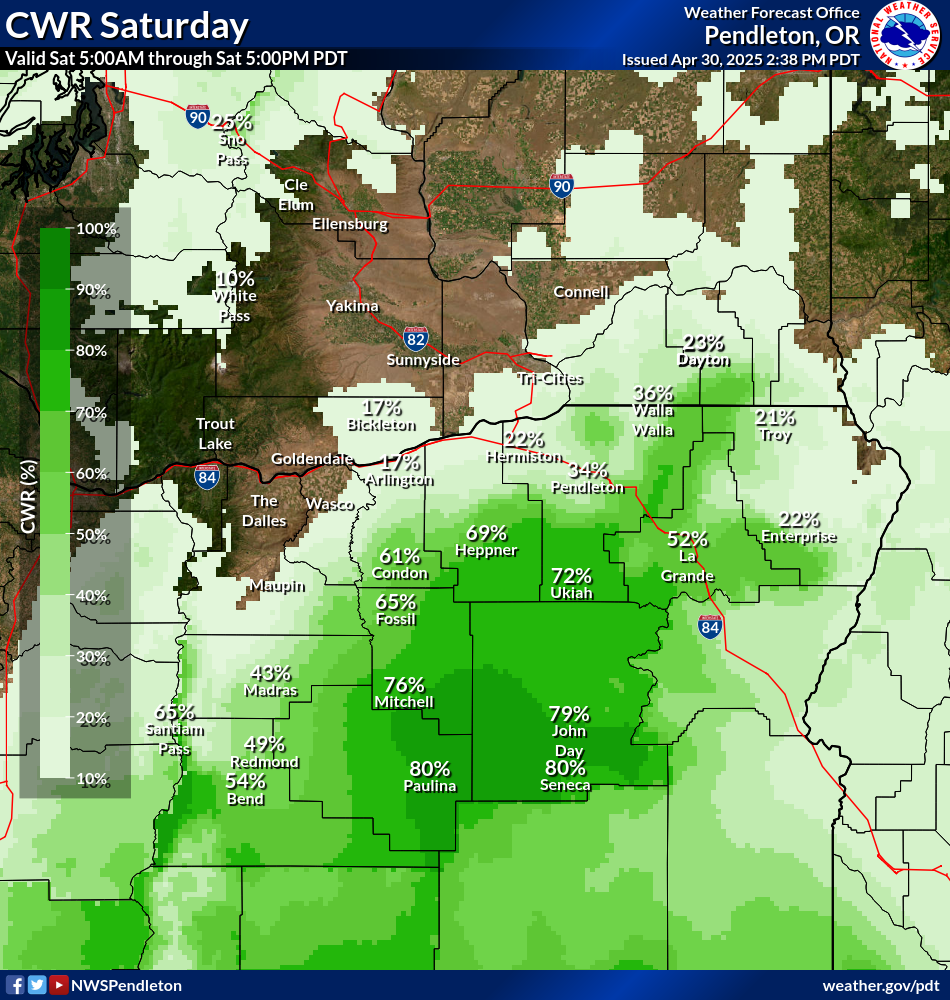
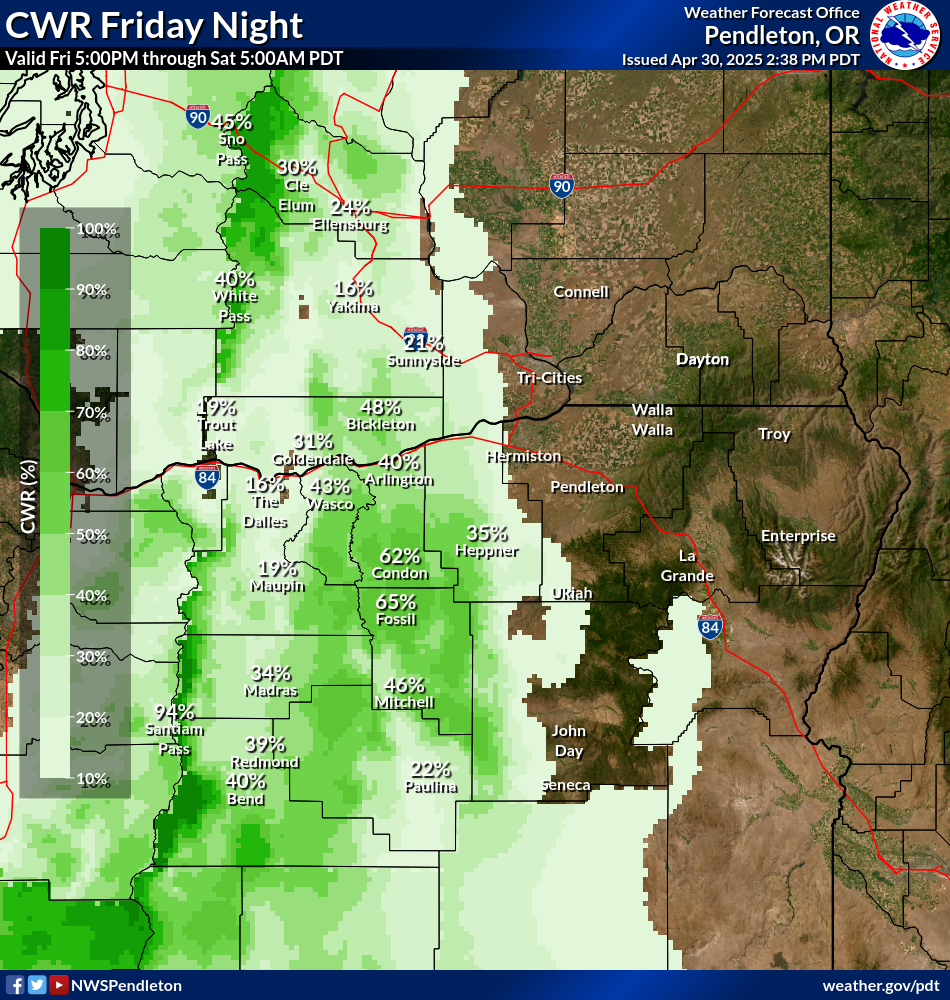
| Chance of Wetting Rain Day 1 | Chance of Wetting Rain Day 2 | Chance of Wetting Rain Day 3 |
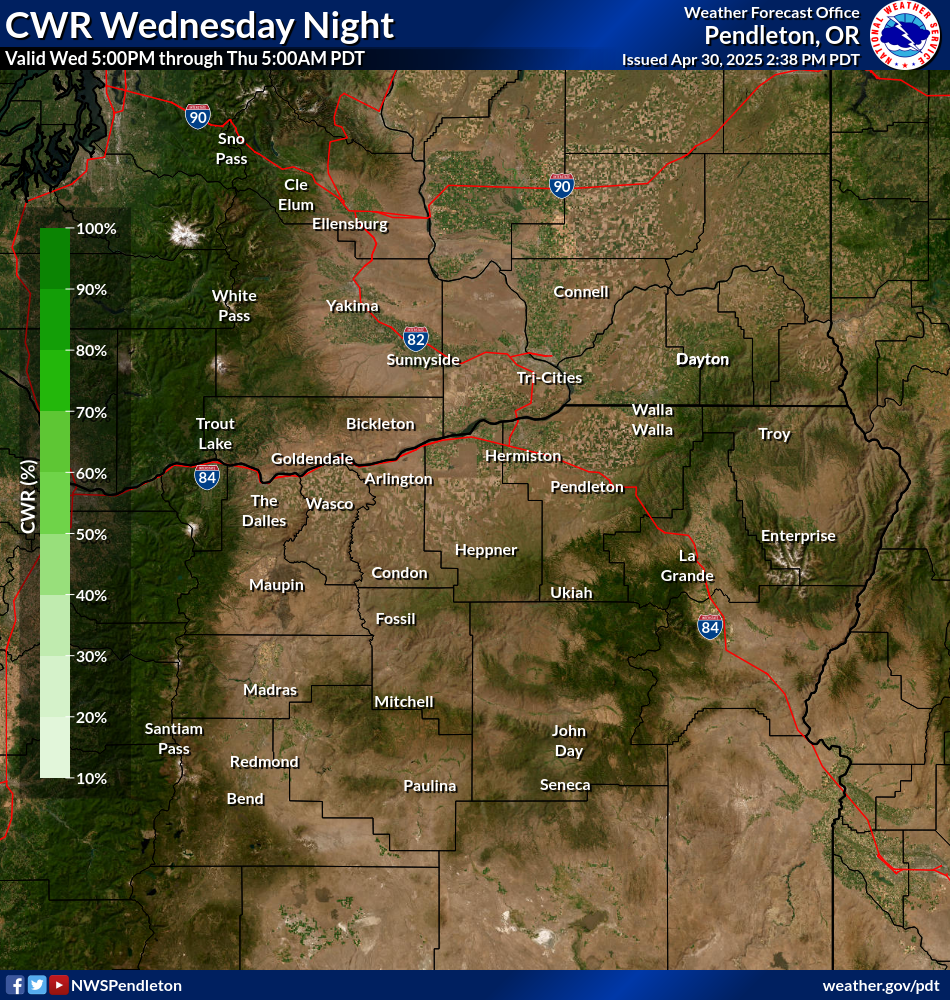
| Chance of Wetting Rain Night 1 | Chance of Wetting Rain Night 2 | Chance of Wetting Rain Night 3 |

Click on an image to expand
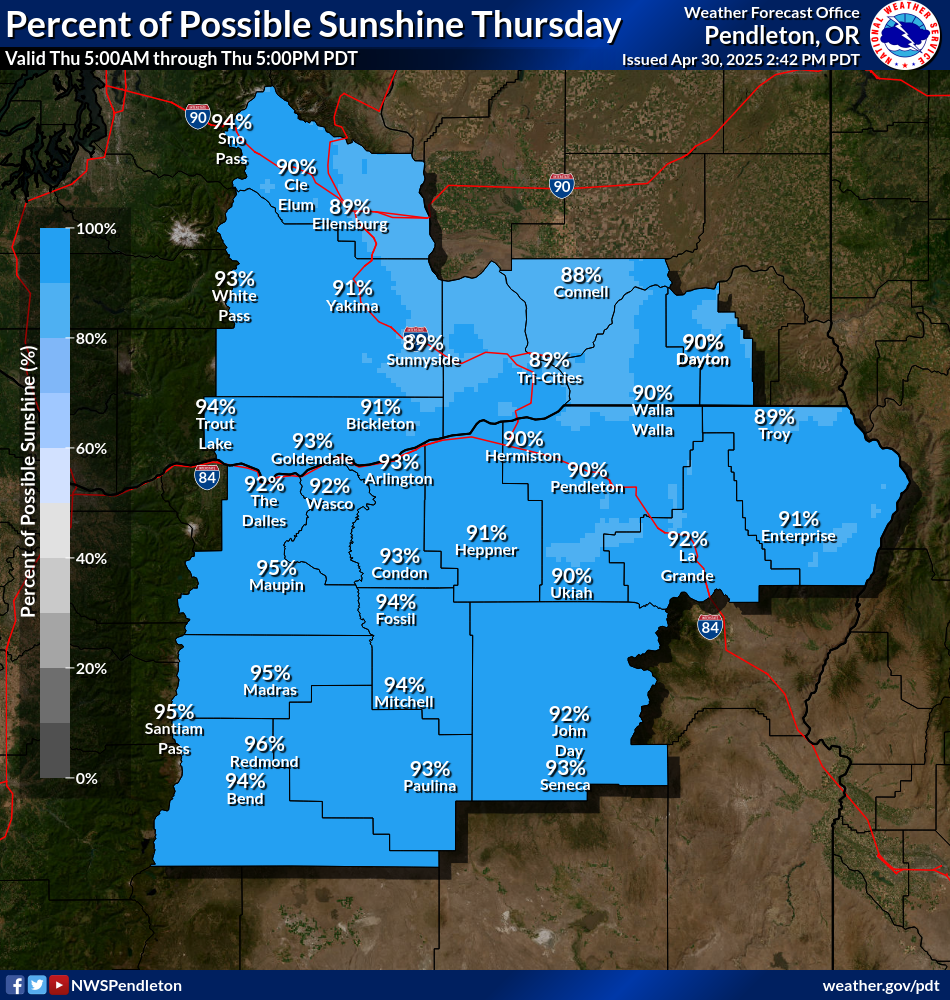
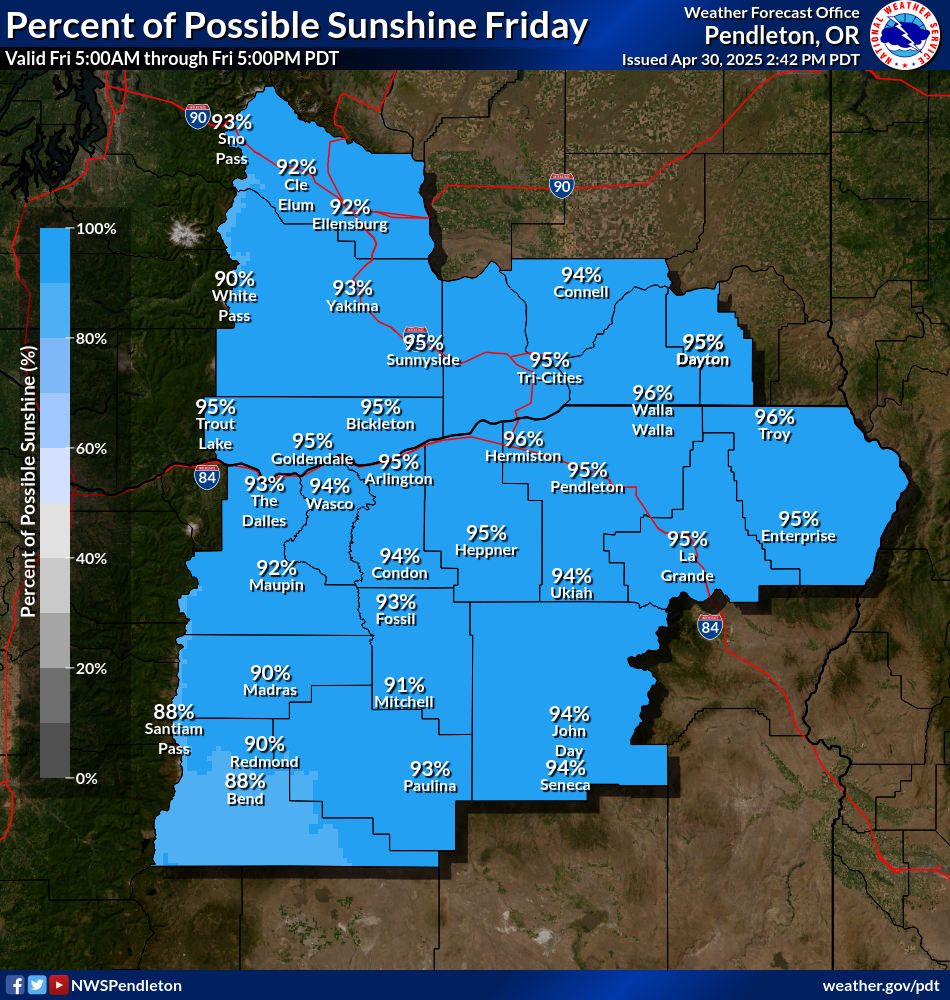
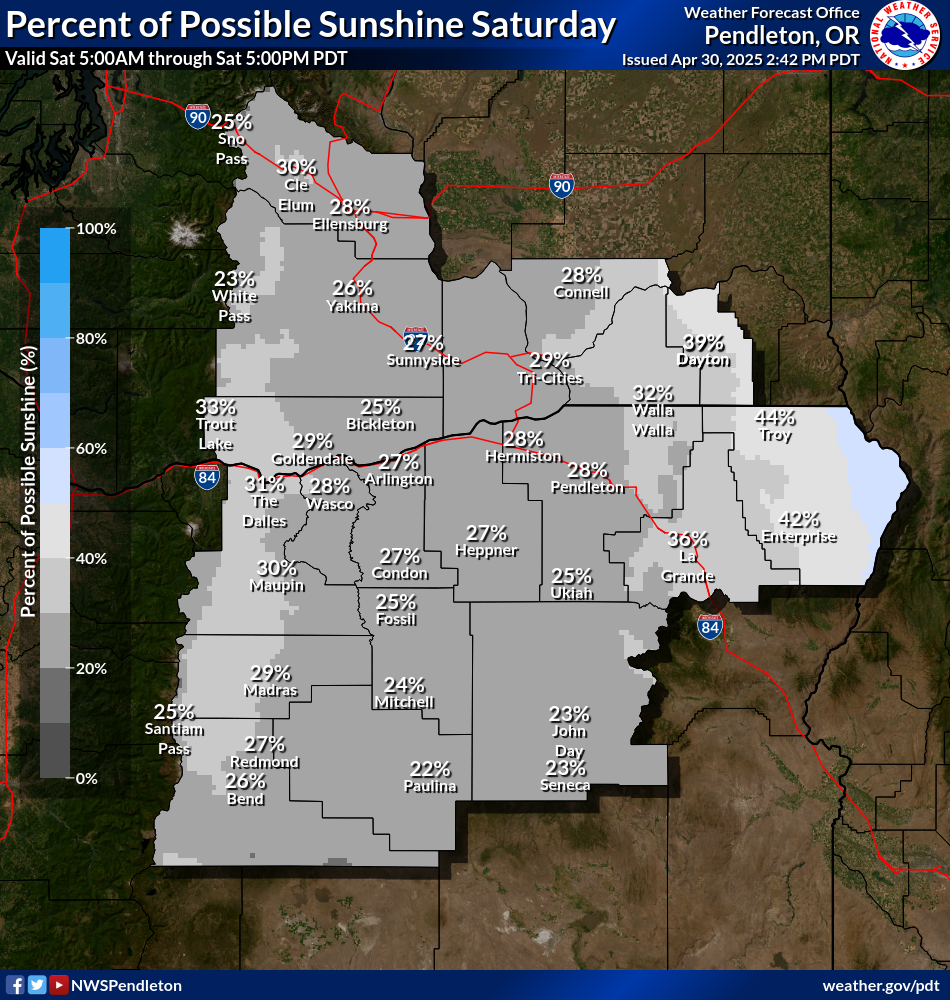
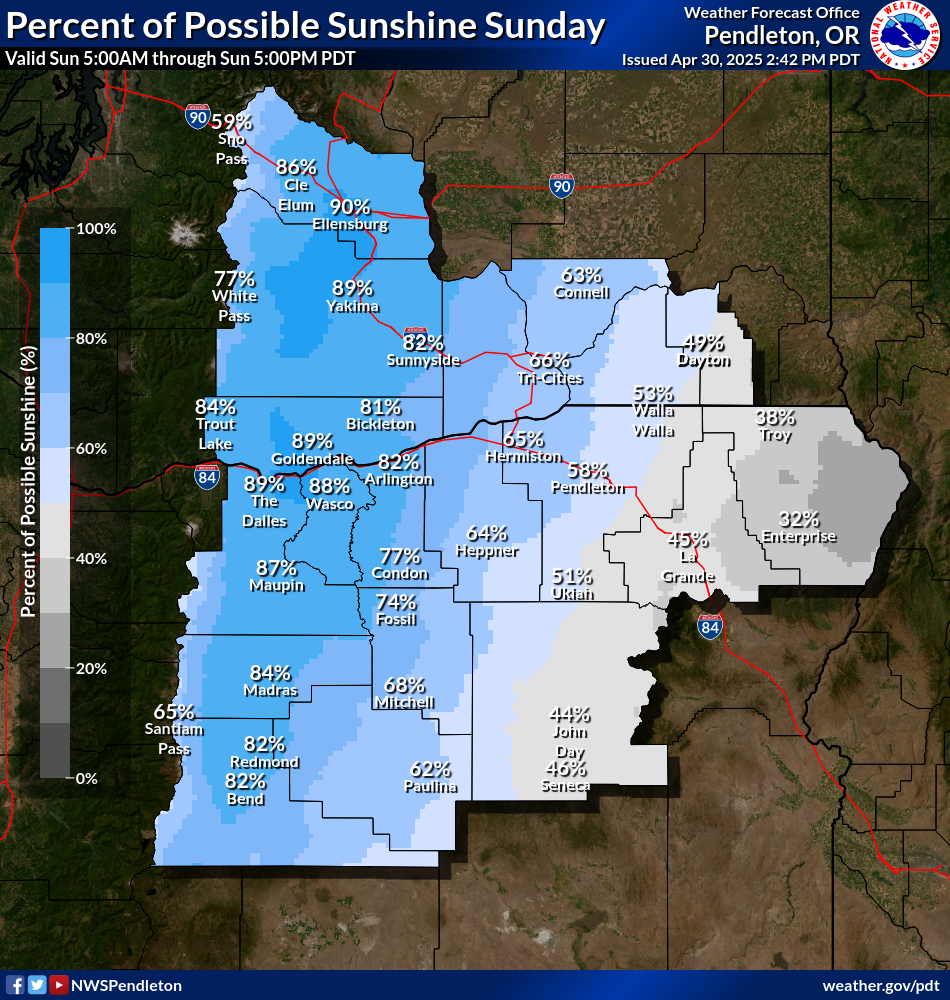
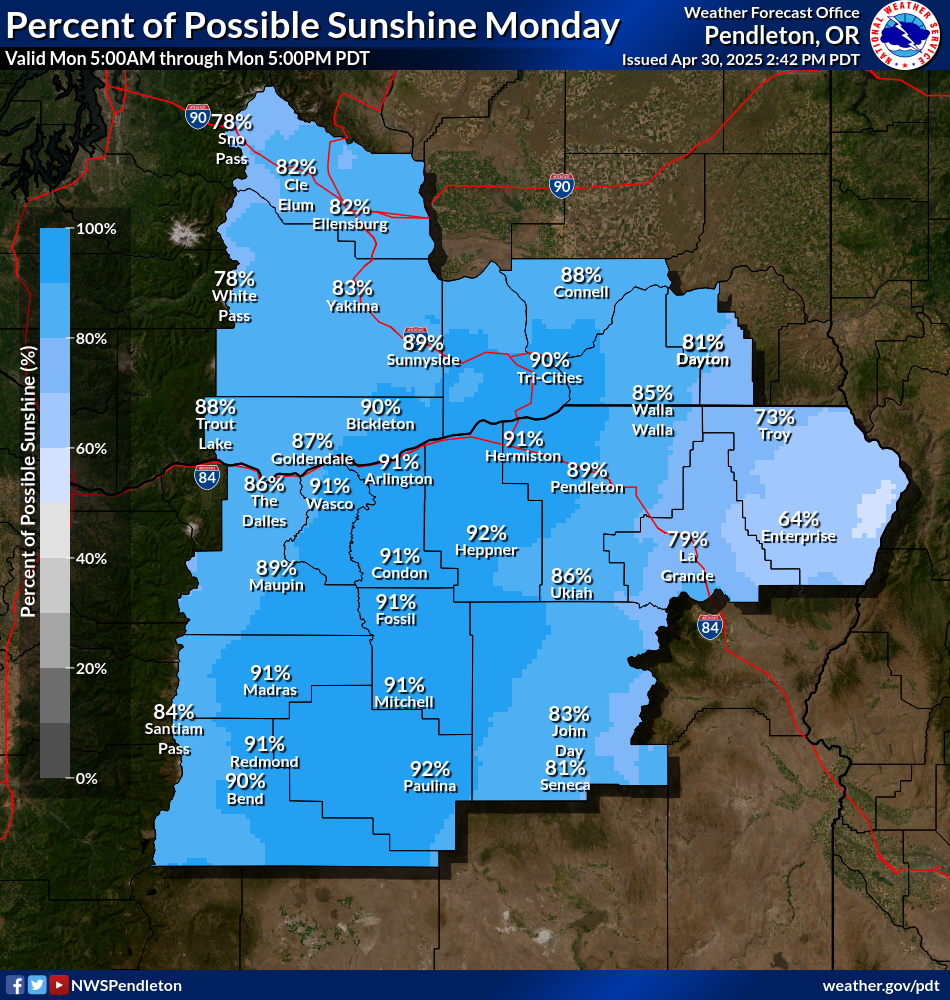
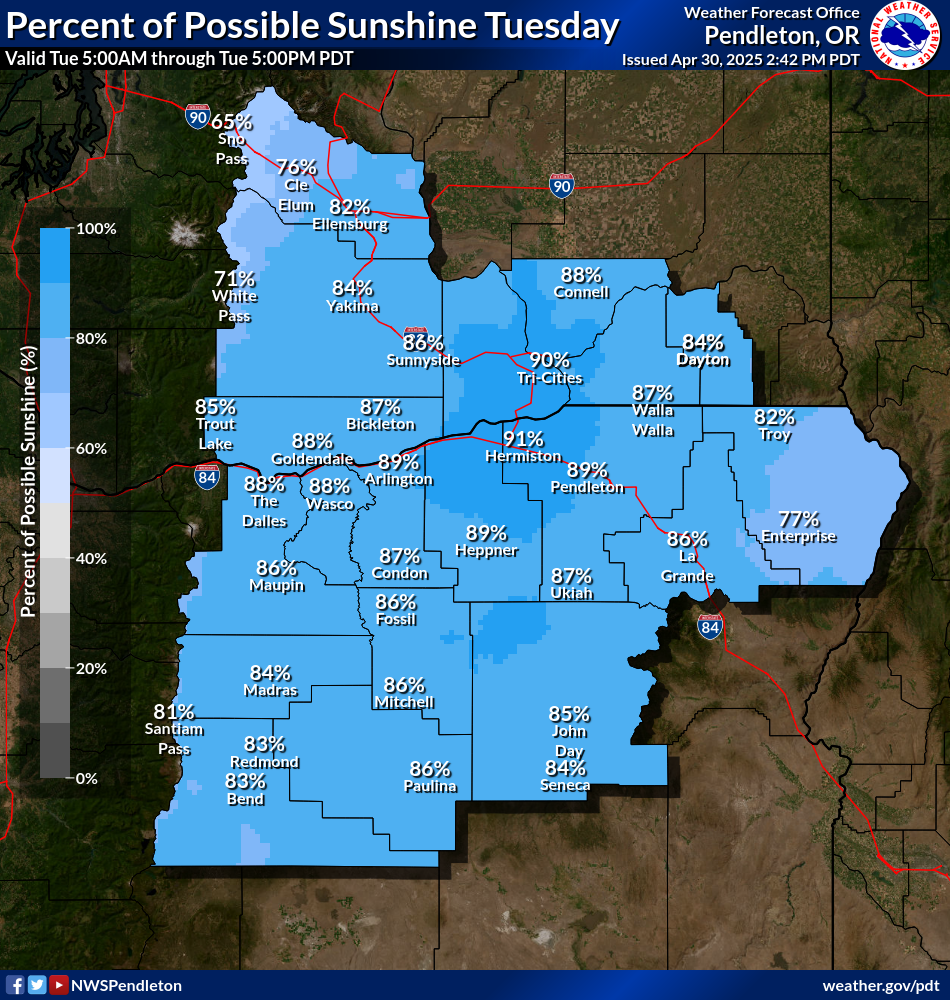
| Day 1 Percent of Sunshine Possible | Day 2 Percent of Sunshine Possible | Day 3 Percent of Sunshine Possible |
| Day 4 Percent of Sunshine Possible | Day 5 Percent of Sunshine Possible | Day 6 Percent of Sunshine Possible |
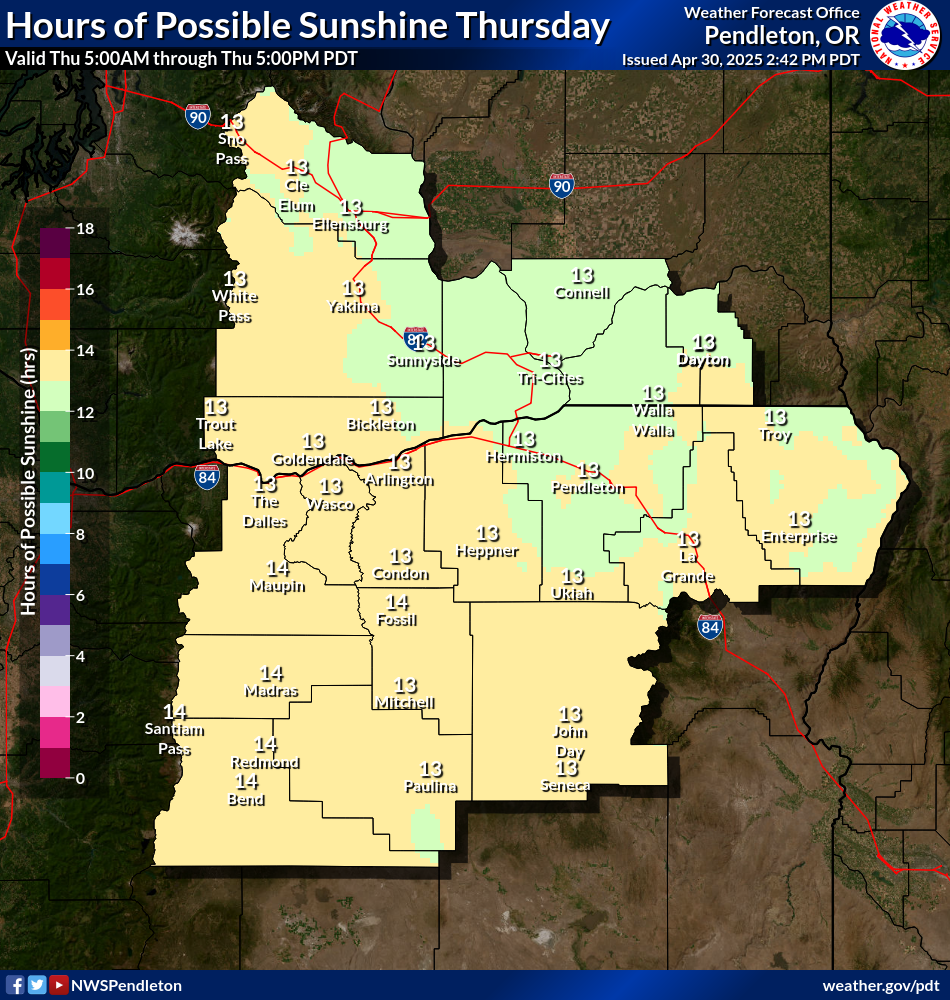
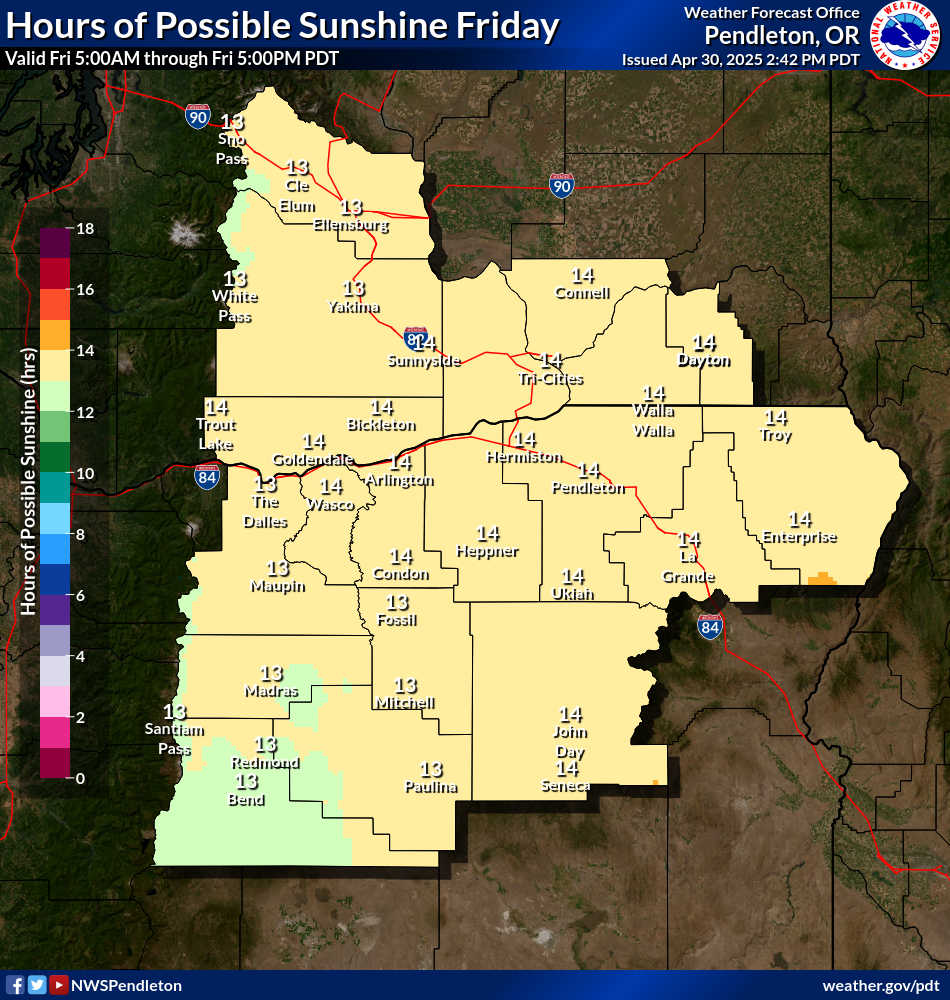
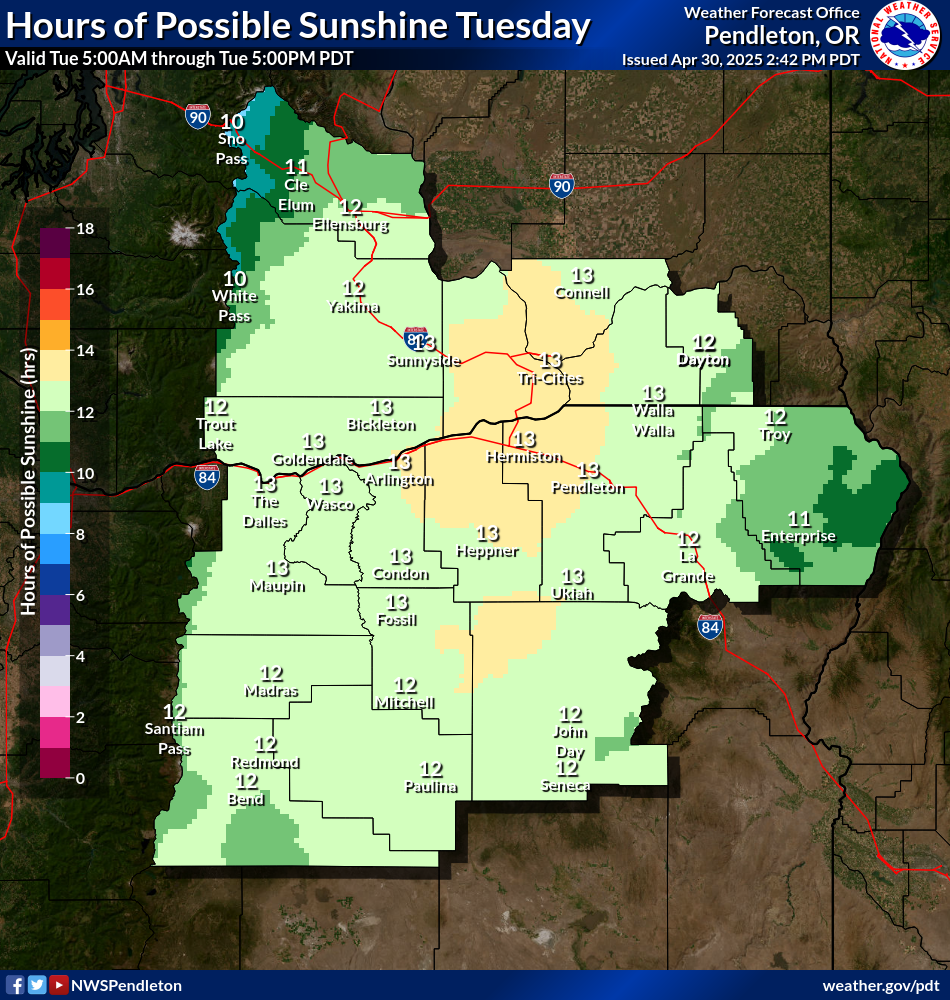
| Day 1 Hours of Sunshine | Day 2 Hours of Sunshine | Day 3 Hours of Sunshine |
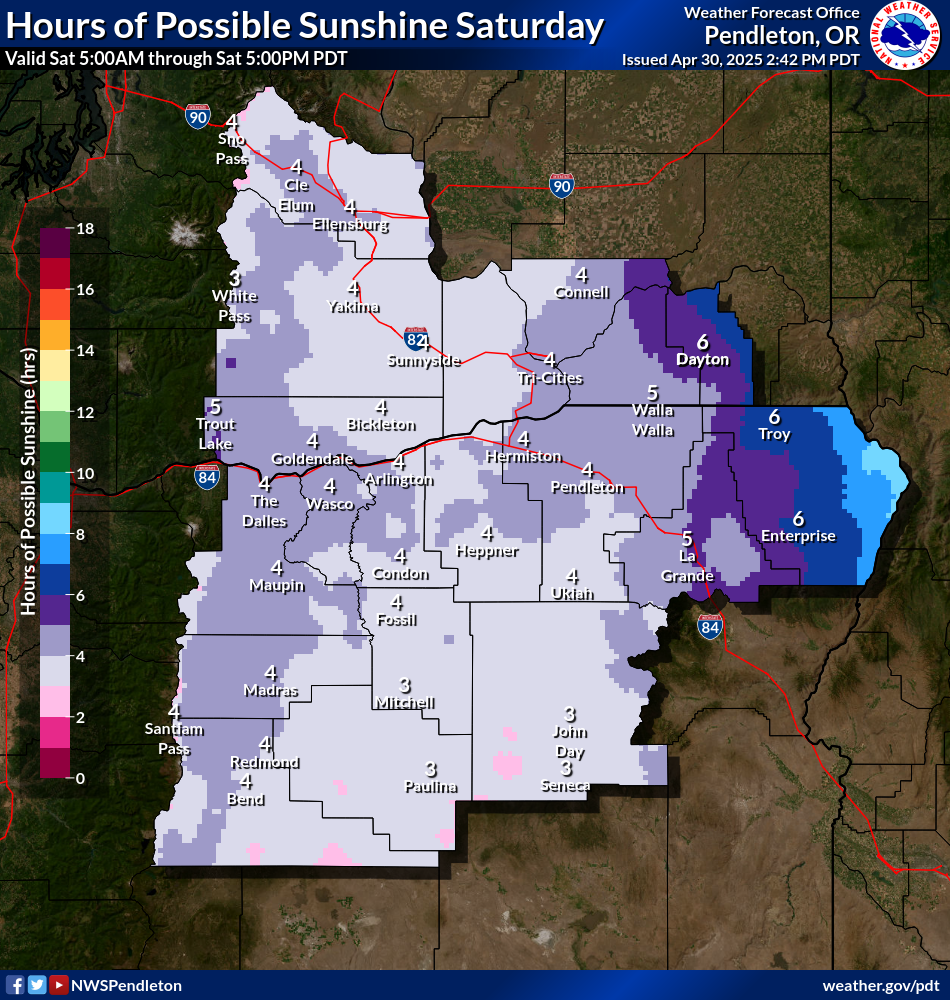
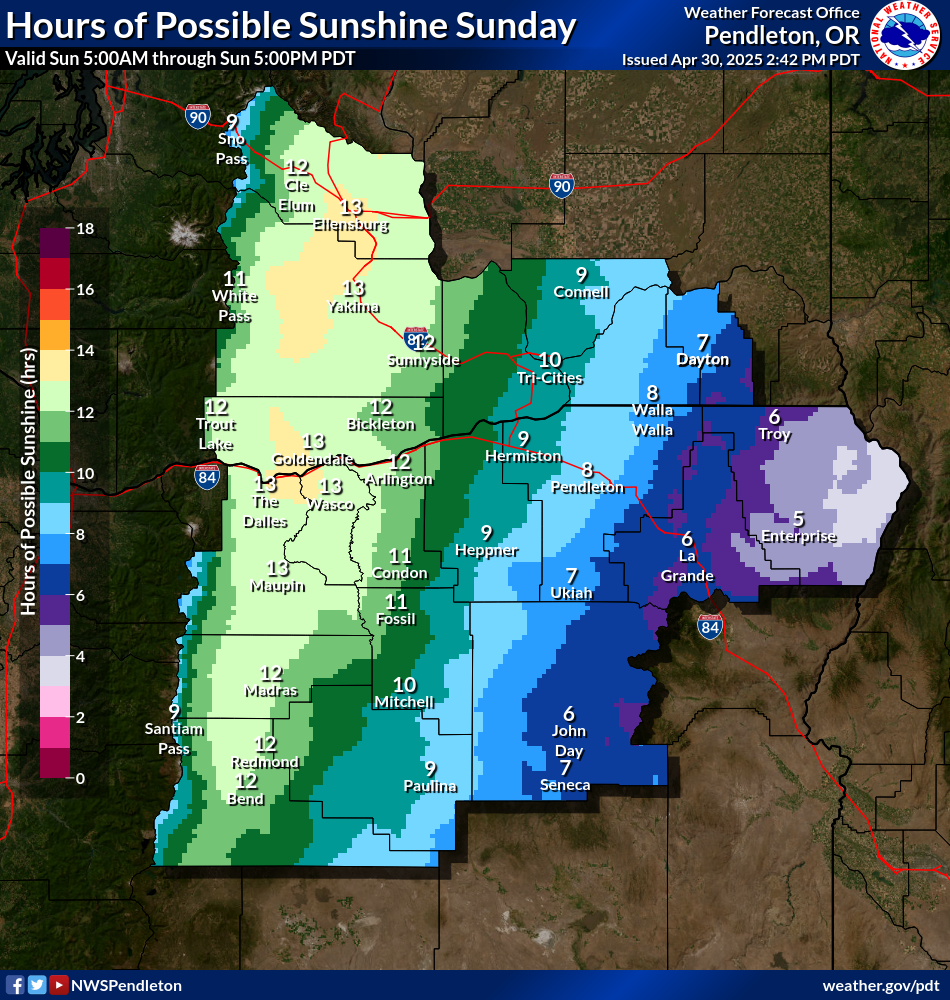
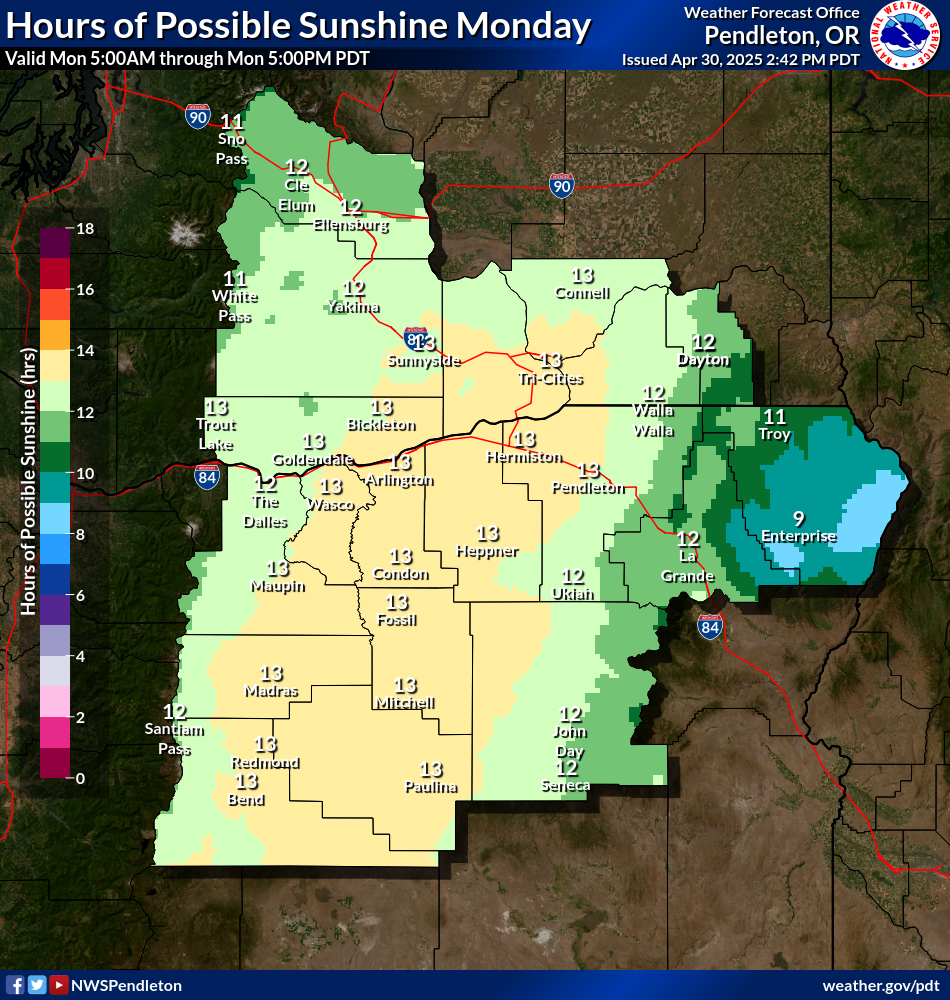
| Day 4 Hours of Sunshine | Day 5 Hours of Sunshine | Day 6 Hours of Sunshine |
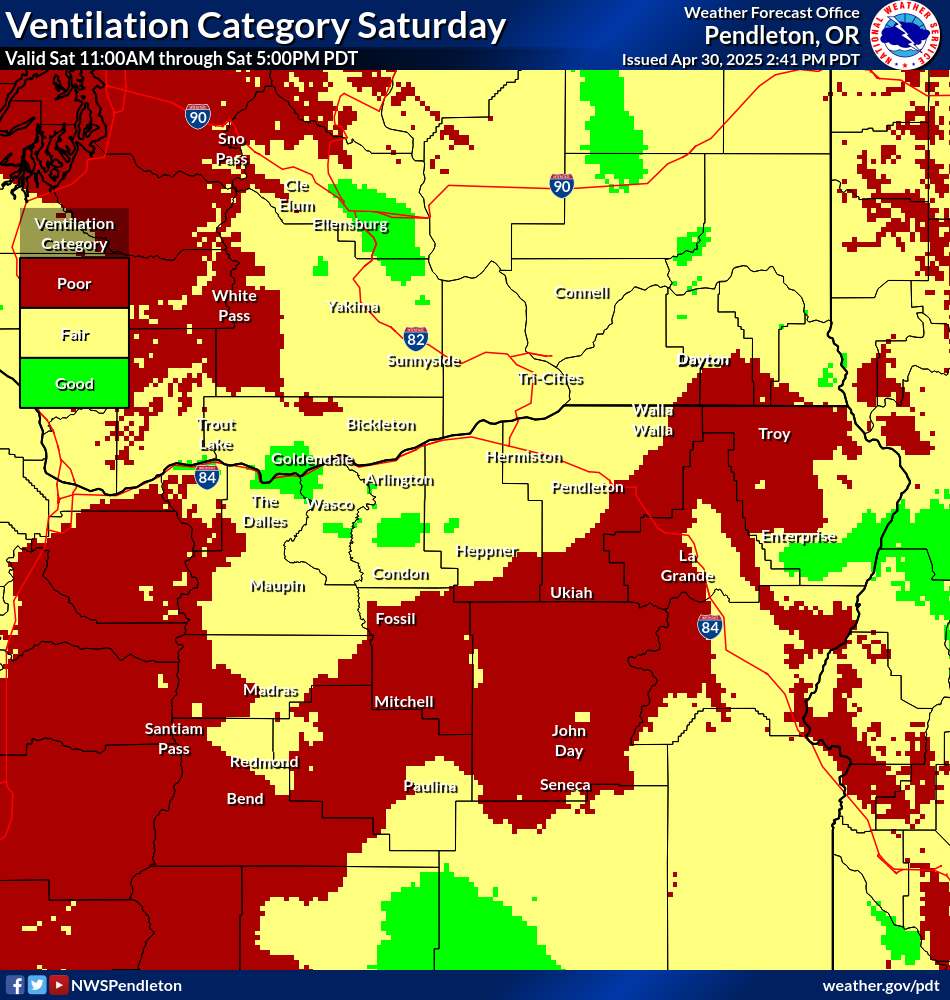
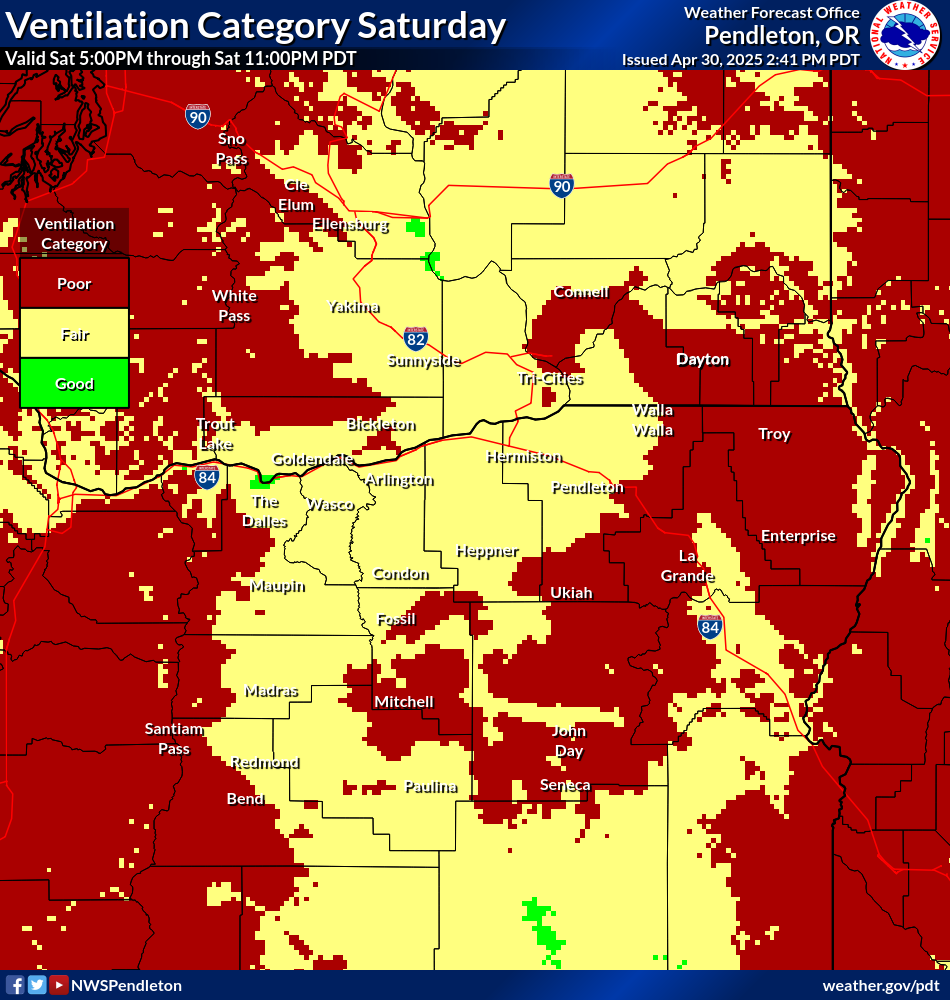
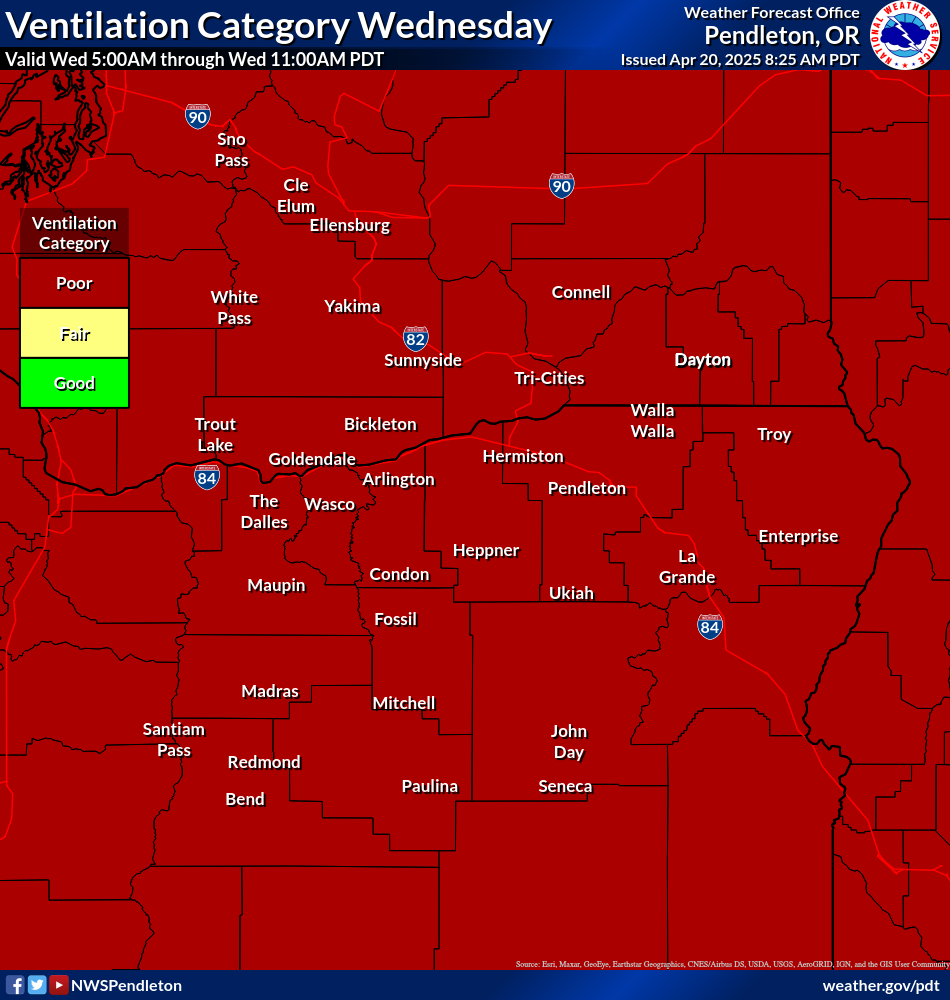
The Daily Dispersion Outlook is available here: https://forecast.weather.gov/product.php?site=pdt&issuedby=PDT&product=DDO.
Click on an image to expand
| 0-hr Forecast Ventilation Category | 6-hr Forecast Ventilation Category | 12-hr Forecast Ventilation Category |
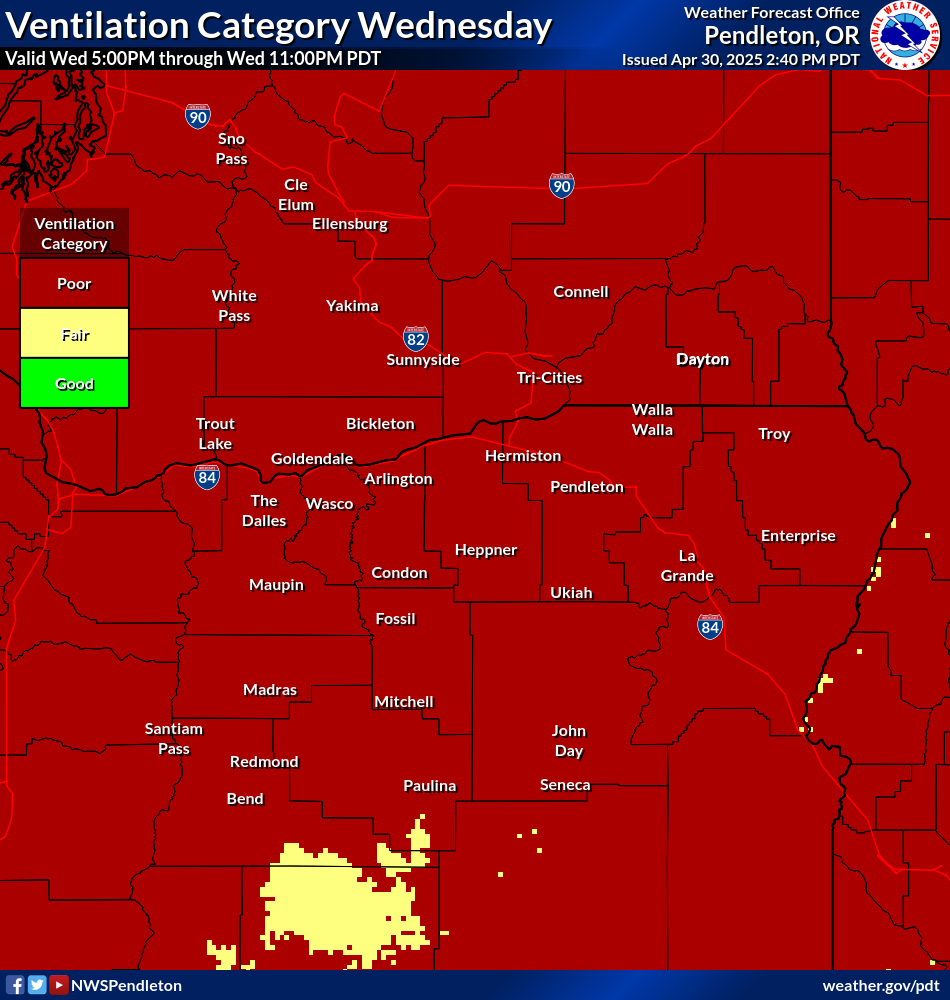


| 18-hr Forecast Ventilation Category | 24-hr Forecast Ventilation Category | 30-hr Forecast Ventilation Category |
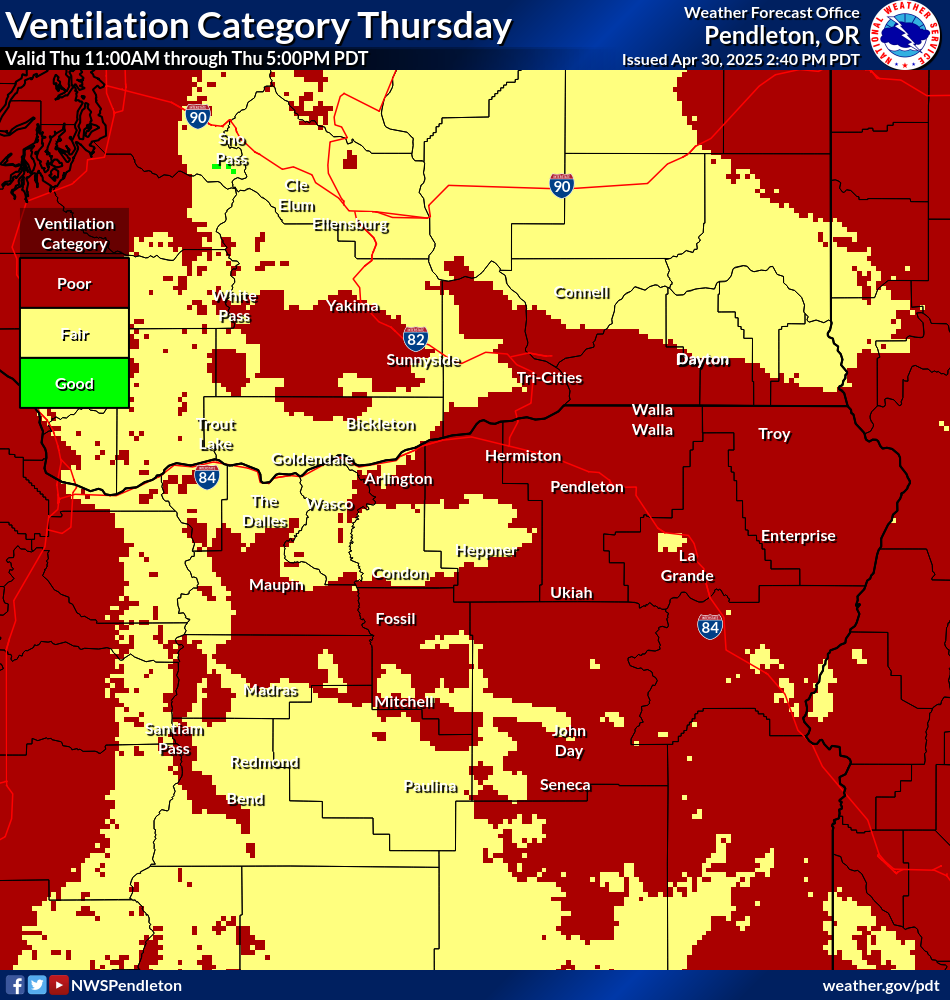
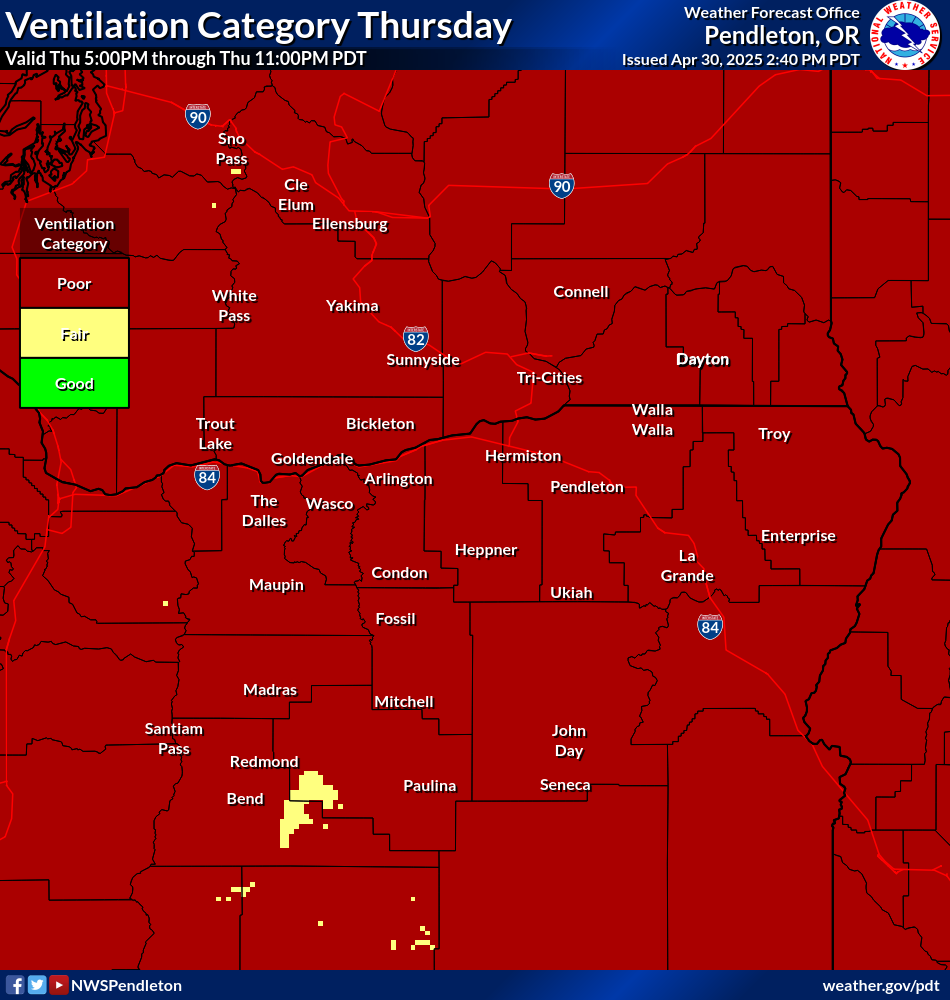
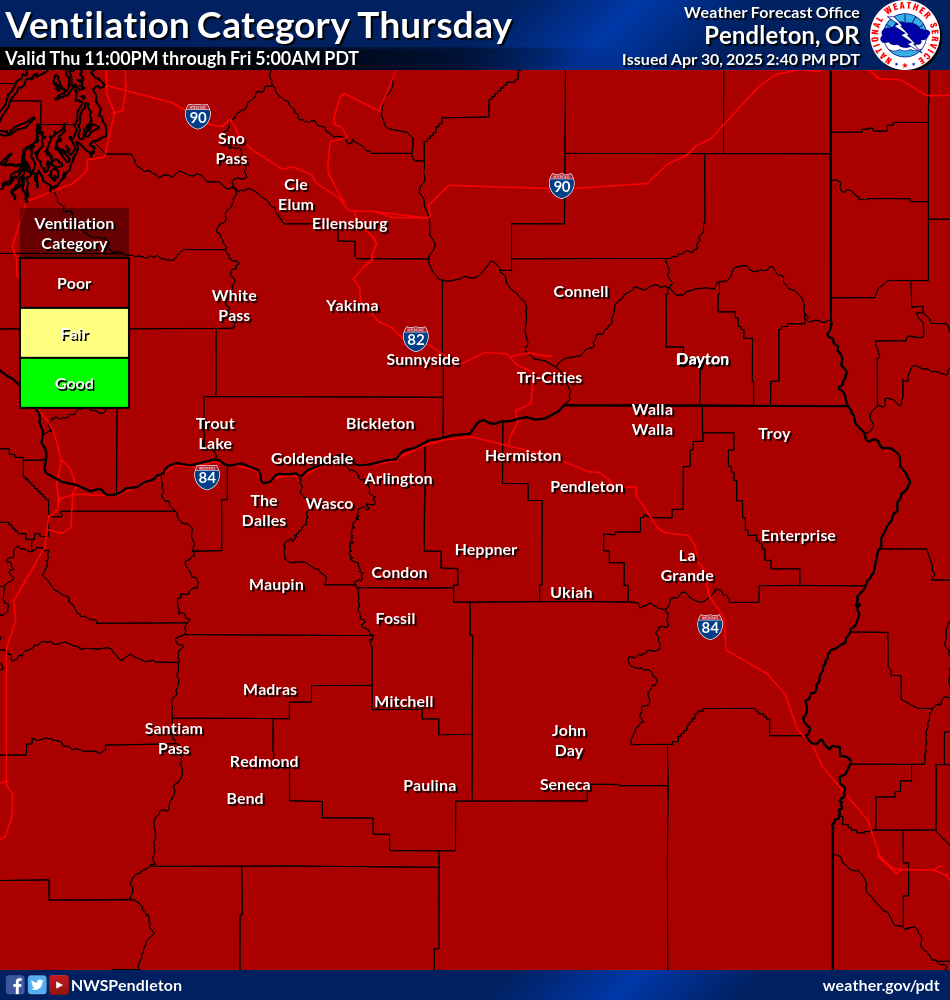
| 36-hr Forecast Ventilation Category | 42-hr Forecast Ventilation Category | 48-hr Forecast Ventilation Category |
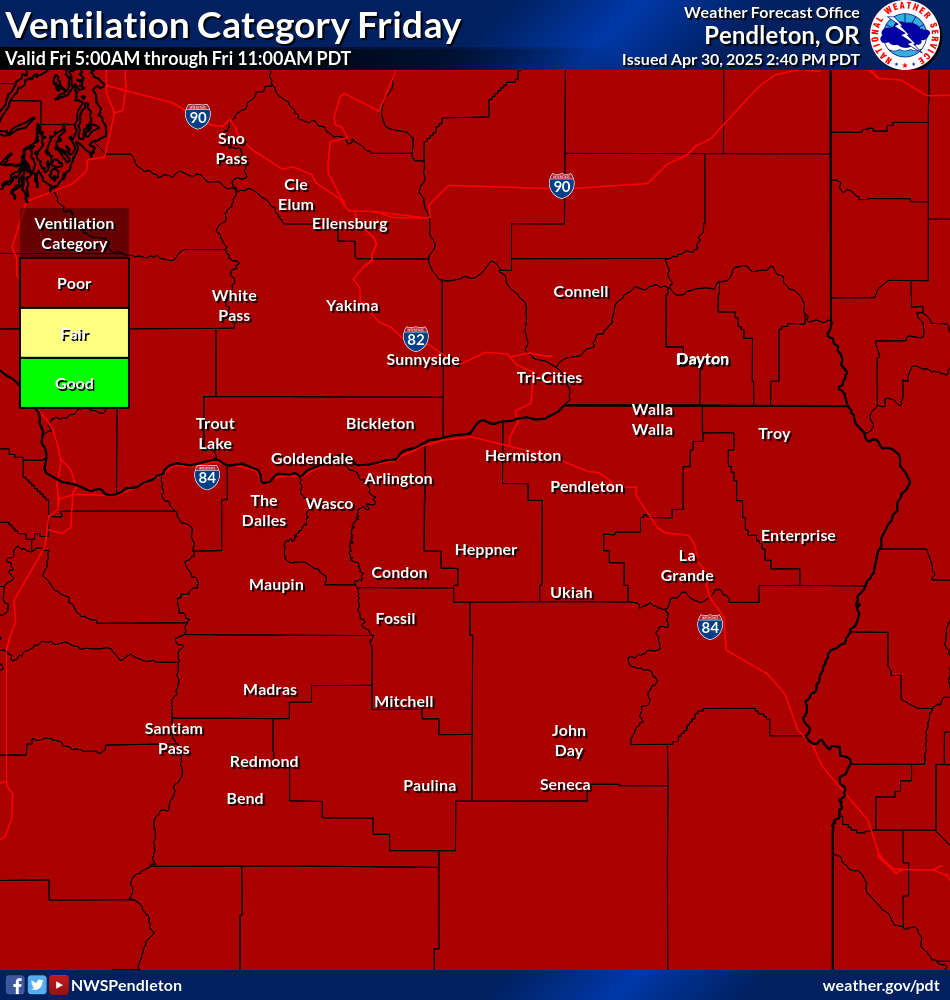
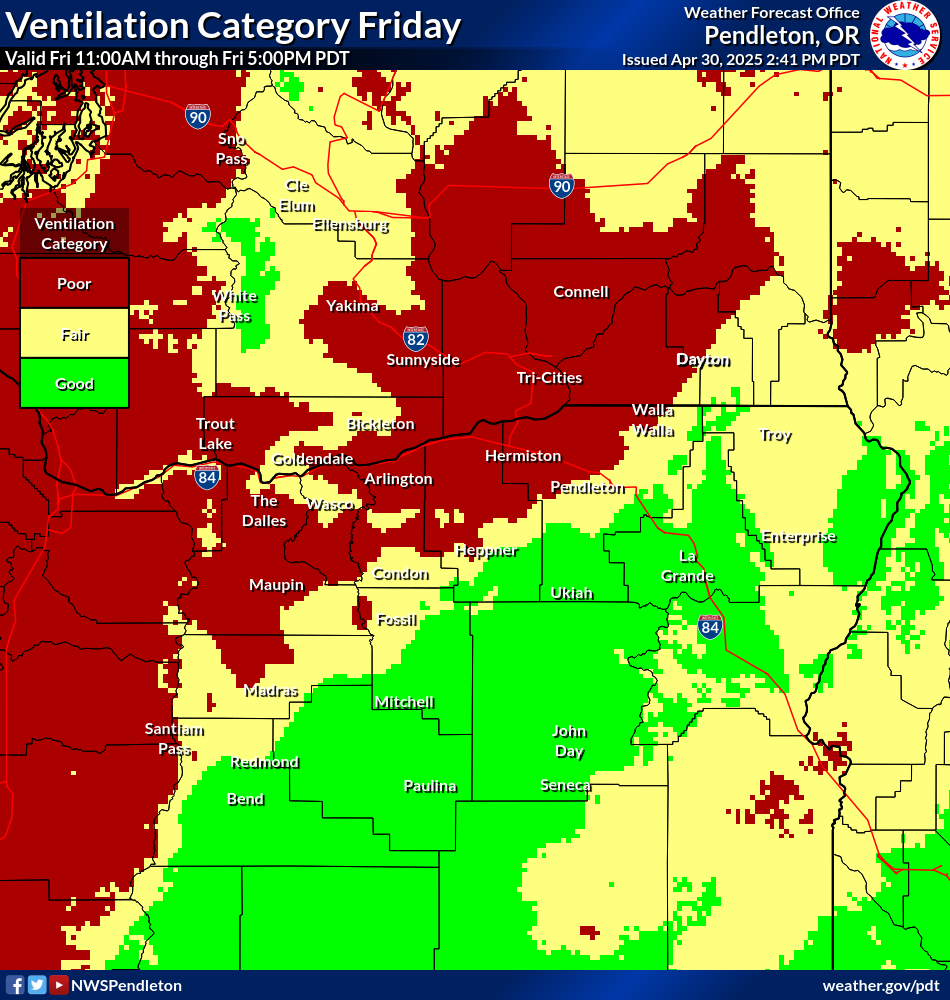

| 54-hr Forecast Ventilation Category | 60-hr Forecast Ventilation Category | 66-hr Forecast Ventilation Category |

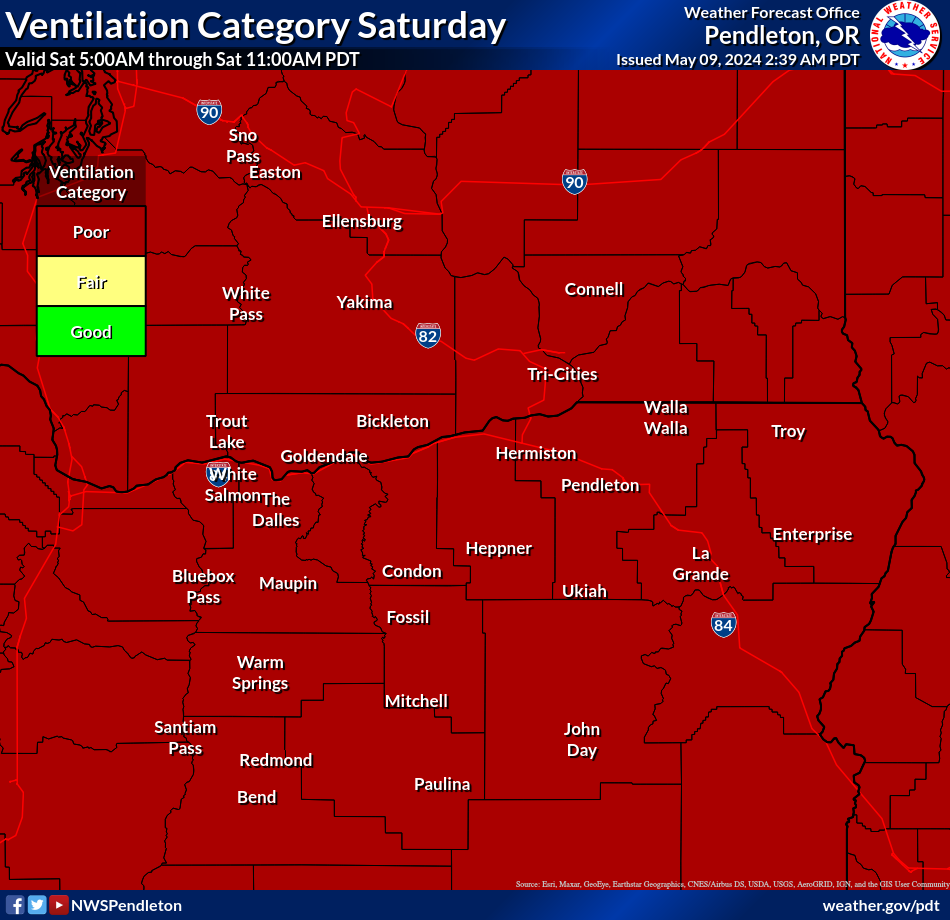
| 72-hr Forecast Ventilation Category | 78-hr Forecast Ventilation Category | 84-hr Forecast Ventilation Category |

NWS Links and Resources:
Mountain Snowpack Information from the NRCS:
| OR SNOTEL Current SWE % of Normal | WA SNOTEL Current SWE % of Normal |


Click on an image to expand
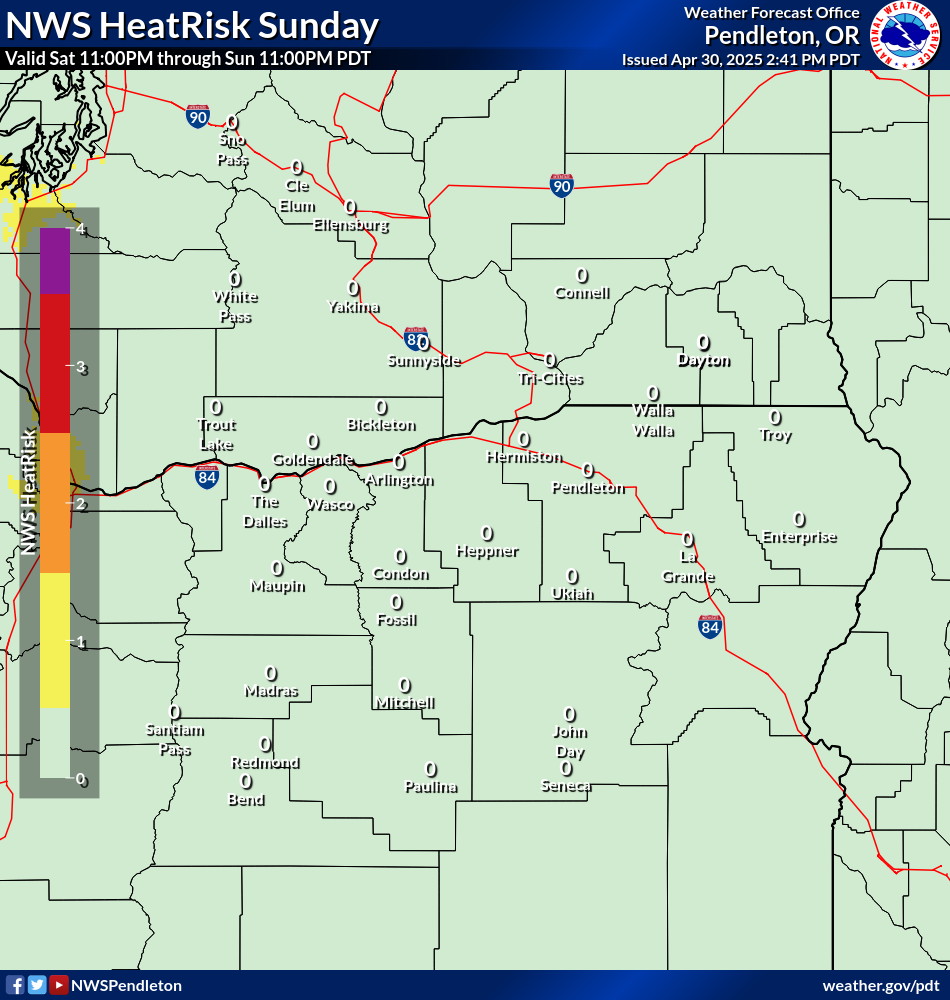
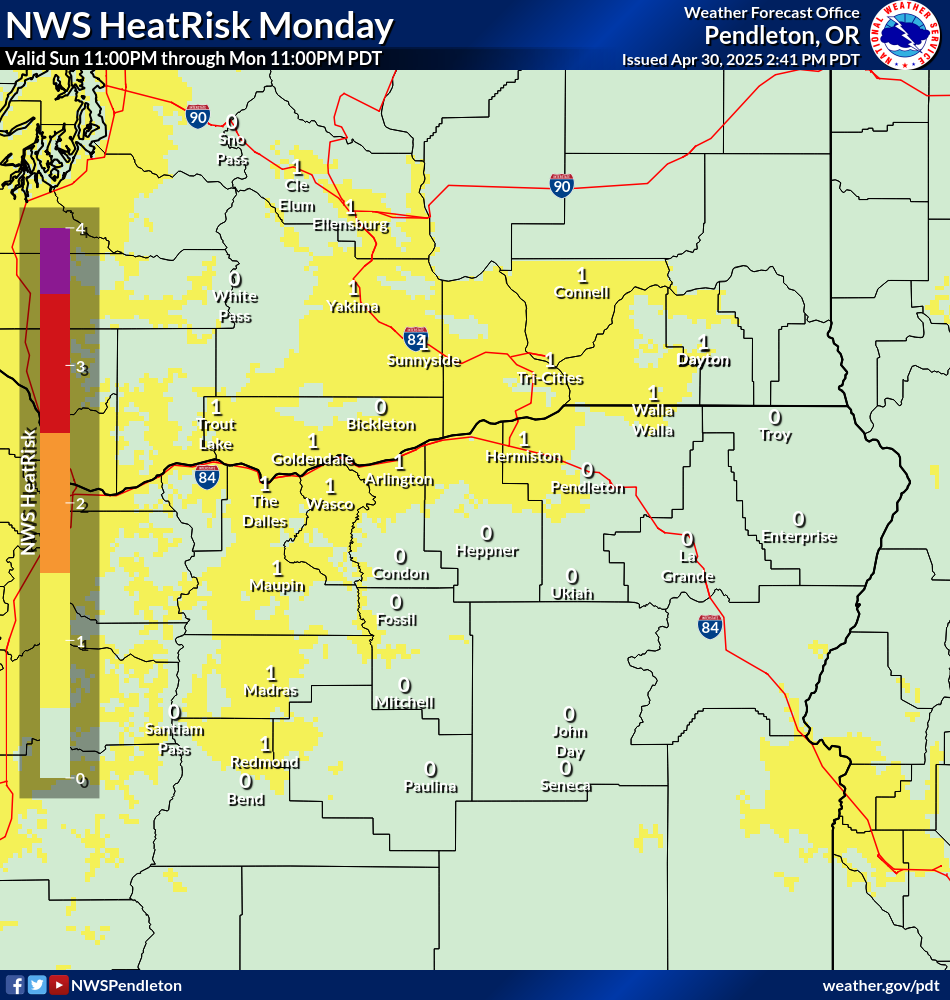
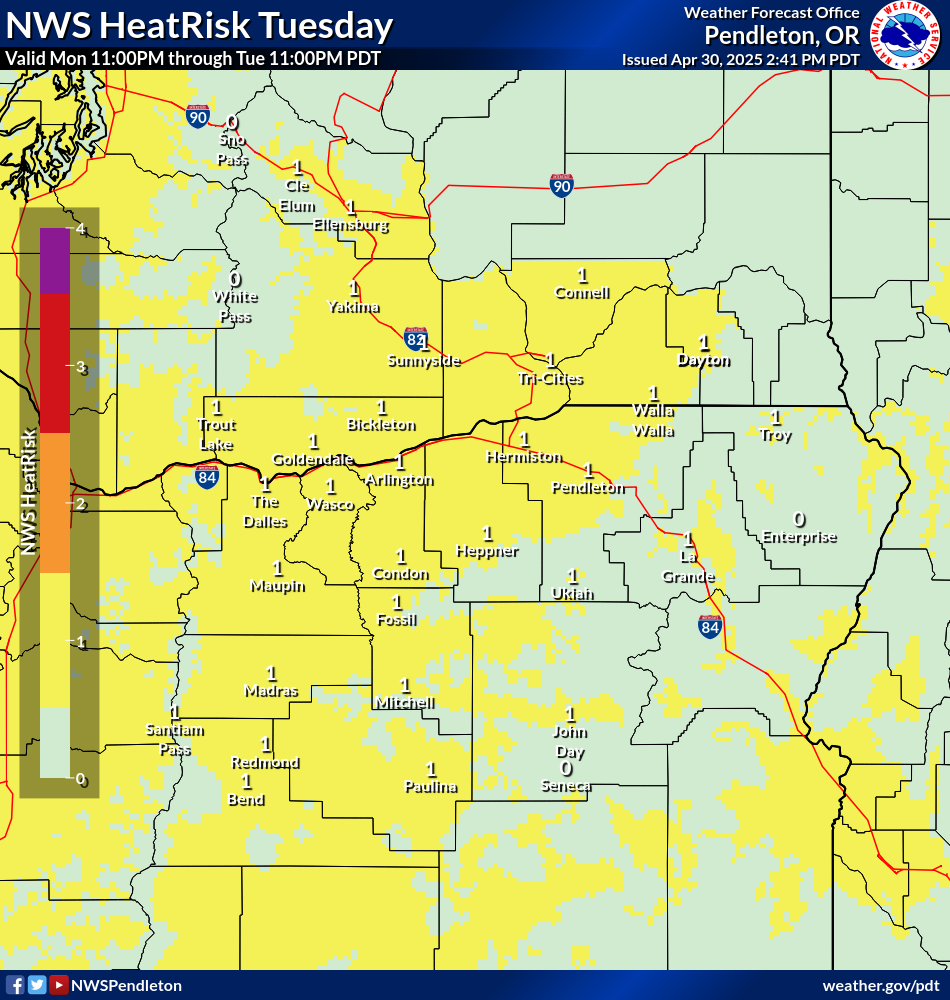
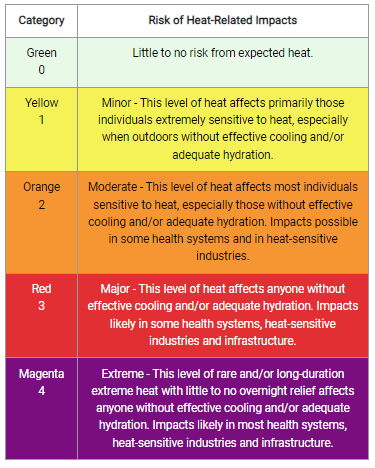
Understanding NWS HeatRisk
NWS HeatRisk Prototype Main Page
| Day 1 NWS HeatRisk | Day 2 NWS HeatRisk | Day 3 NWS HeatRisk |
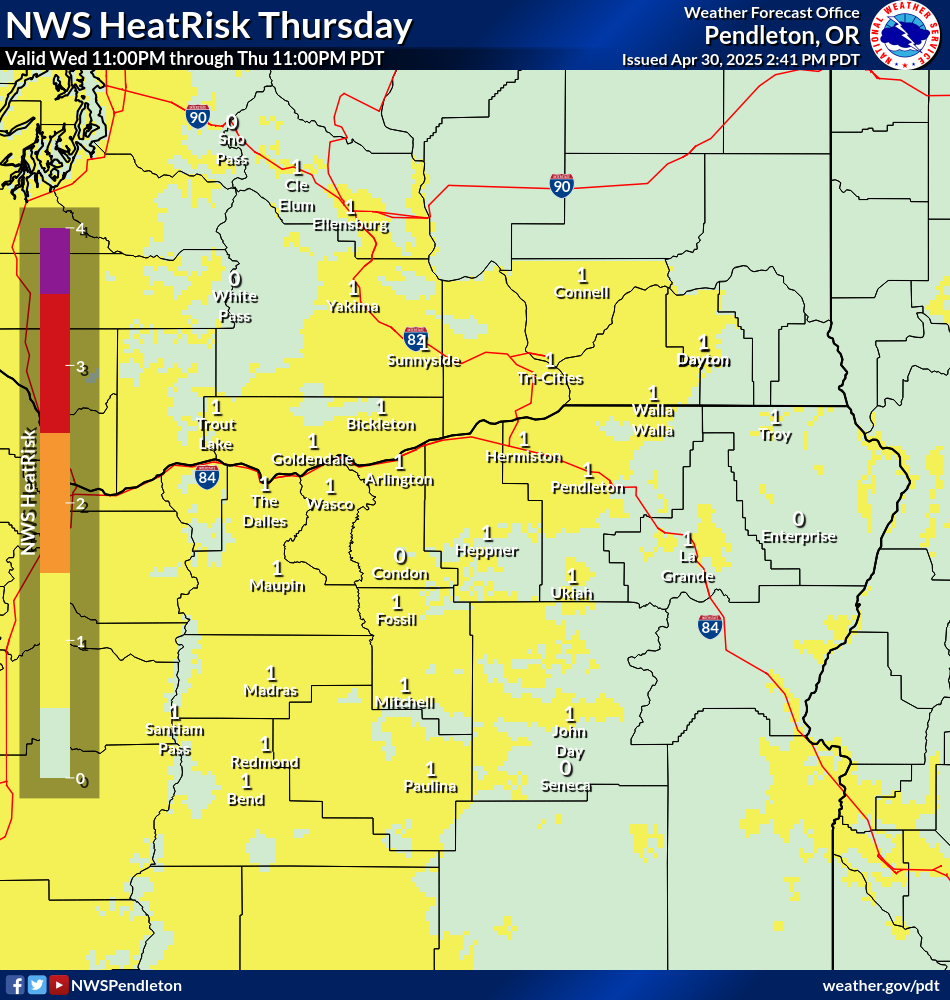
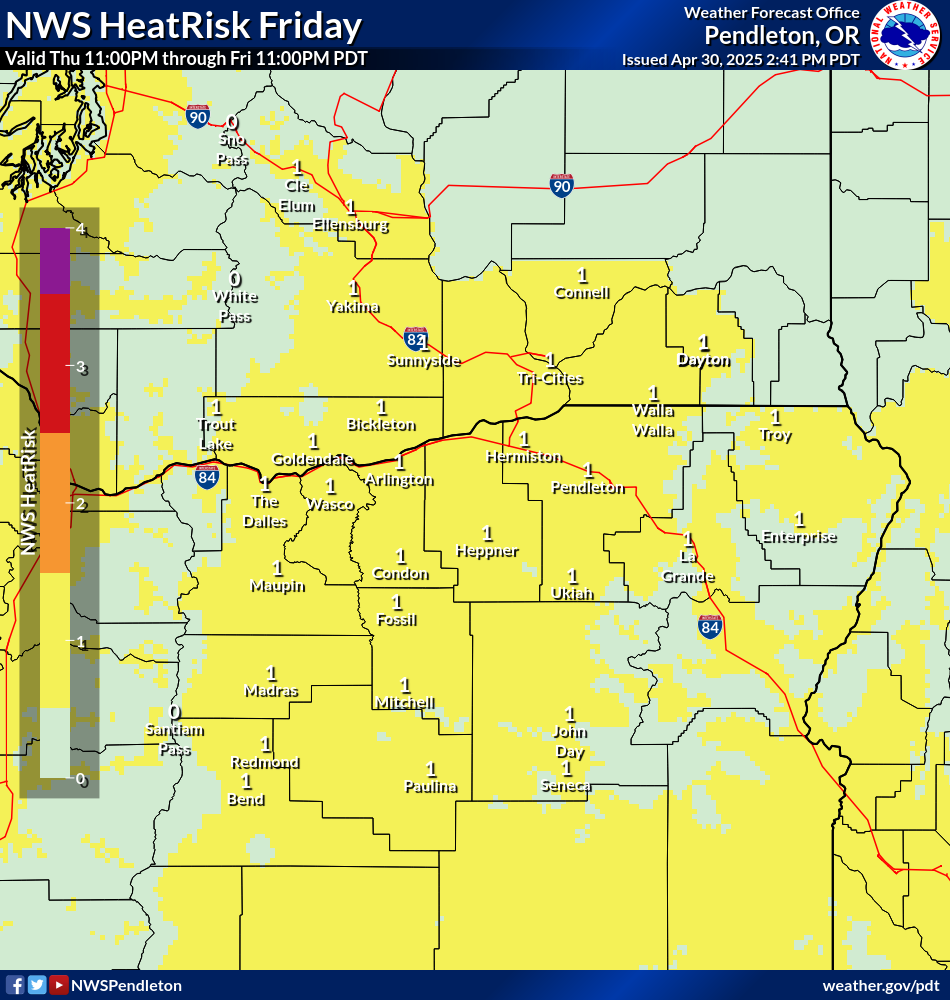
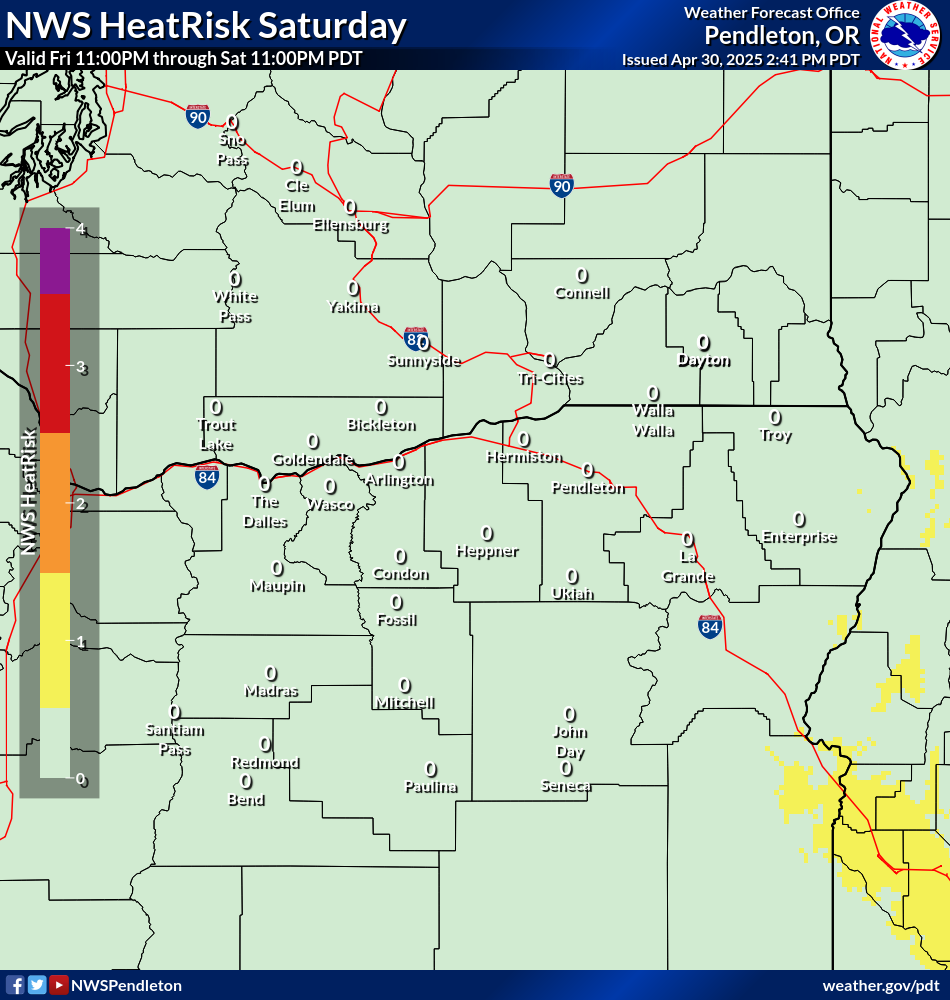
| Day 4 NWS HeatRisk | Day 5 NWS HeatRisk | Day 6 NWS HeatRisk |
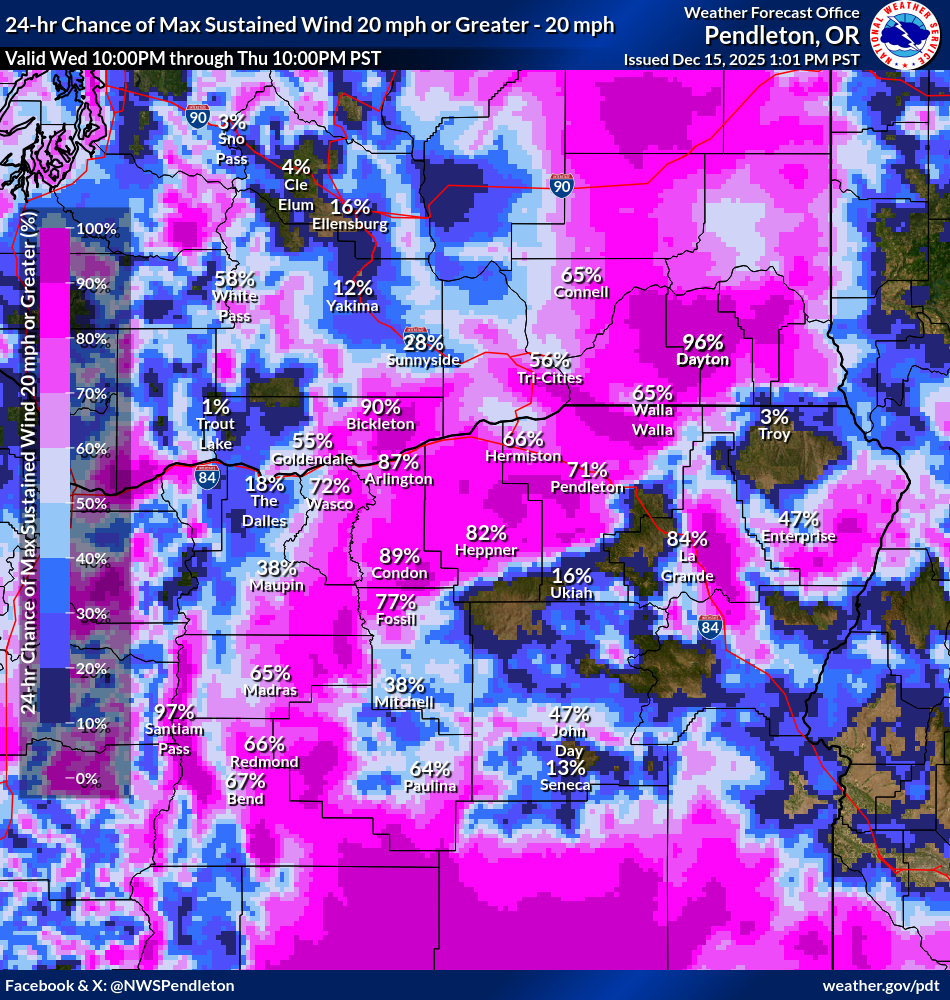
The guidance provided below is from the National Blend of Models (NBM). The NBM is a nationally consistent and skillful suite of calibrated forecast guidance based on a blend of both NWS and non-NWS numerical weather prediction model data and post-processed model guidance. These guidance are provided as is, are experimental, and may not be current. Please see the official NWS forecast and watches, warnings, and advisories when making decisions impacted by weather. Additional guidance is available from https://blend.mdl.nws.noaa.gov/.
Click on an image to expand.
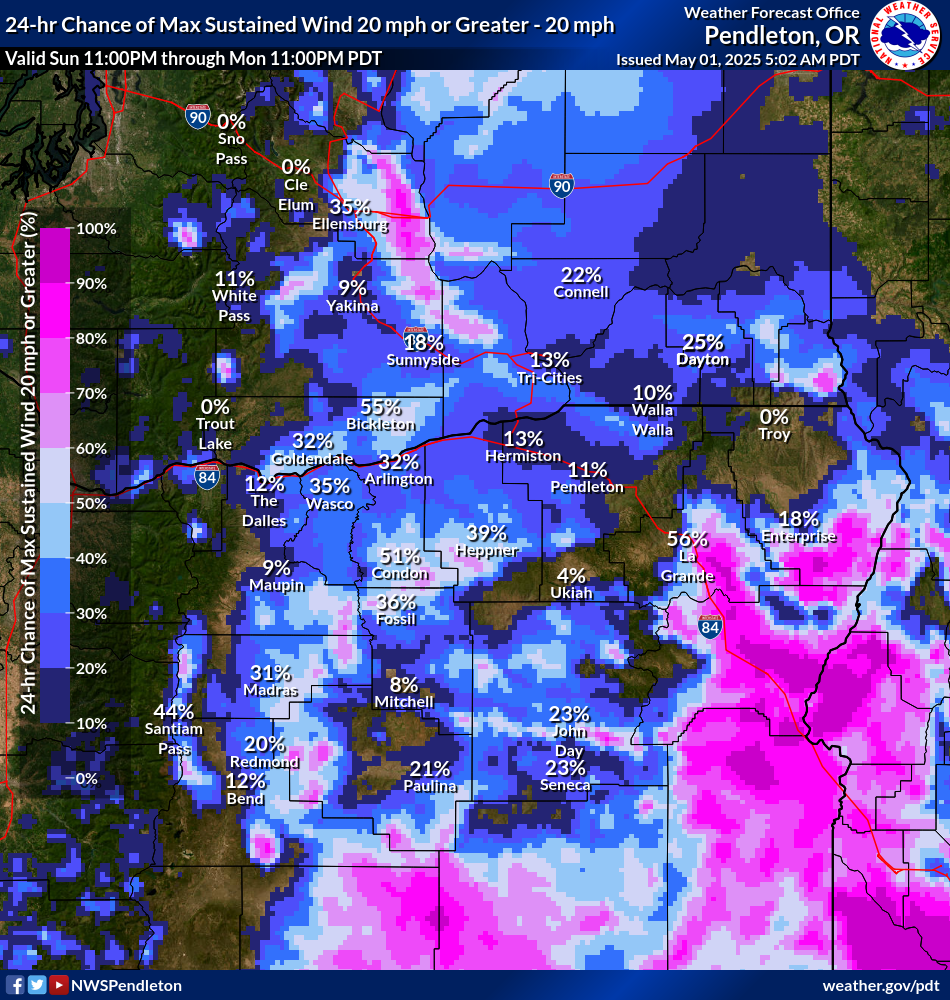
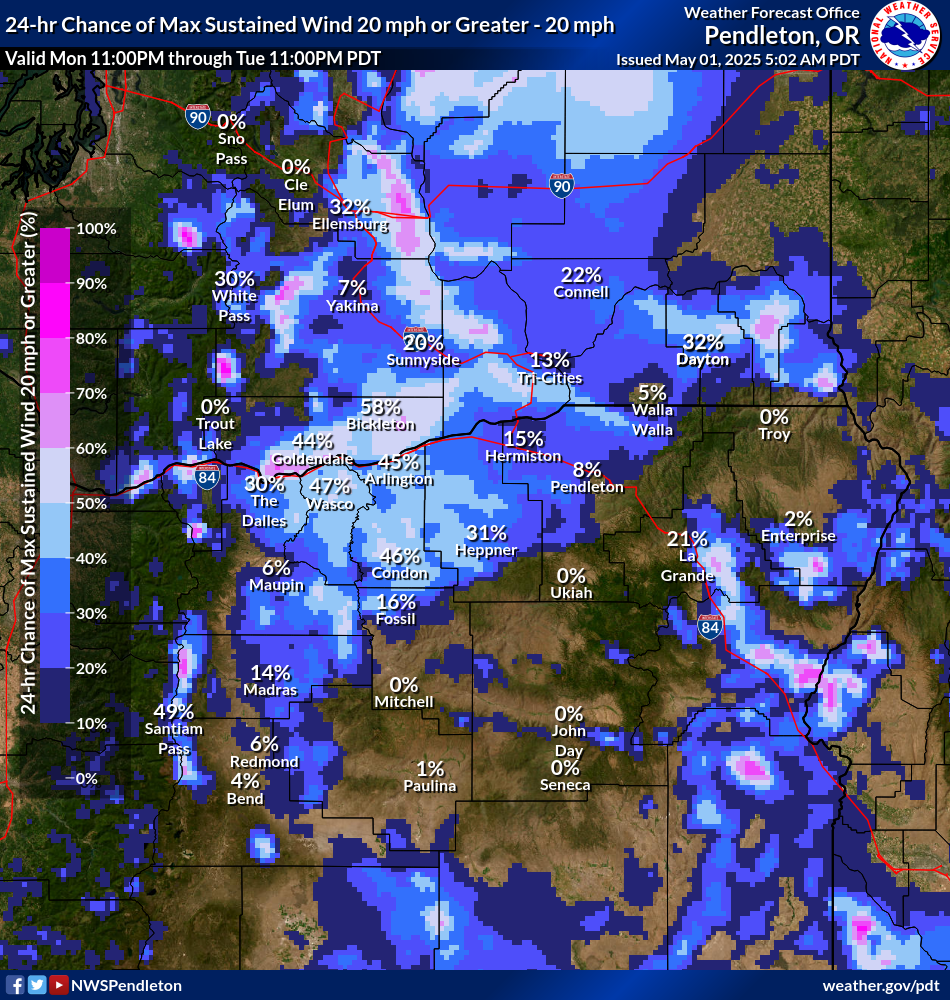
Probability of max wind speed exceeding 20 mph in 24-hour period
| Day 1 - 20 mph Threshold | Day 2 - 20 mph Threshold | Day 3 - 20 mph Threshold |
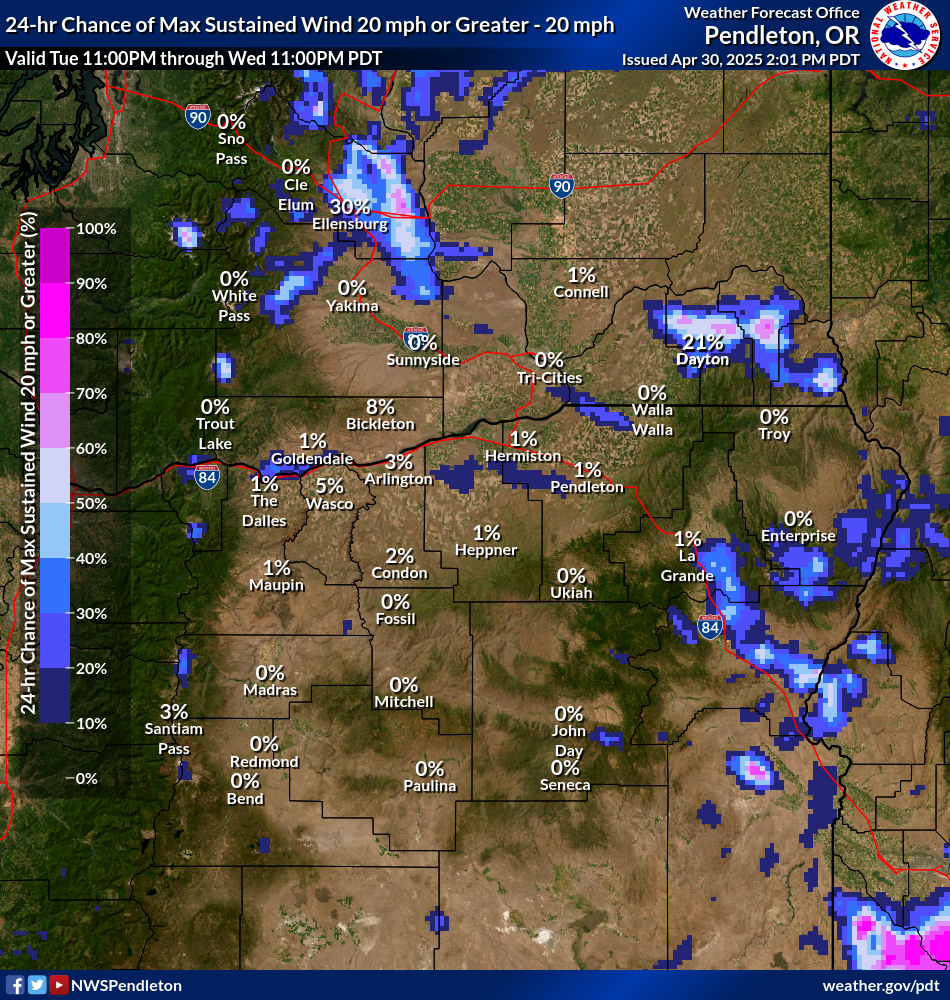
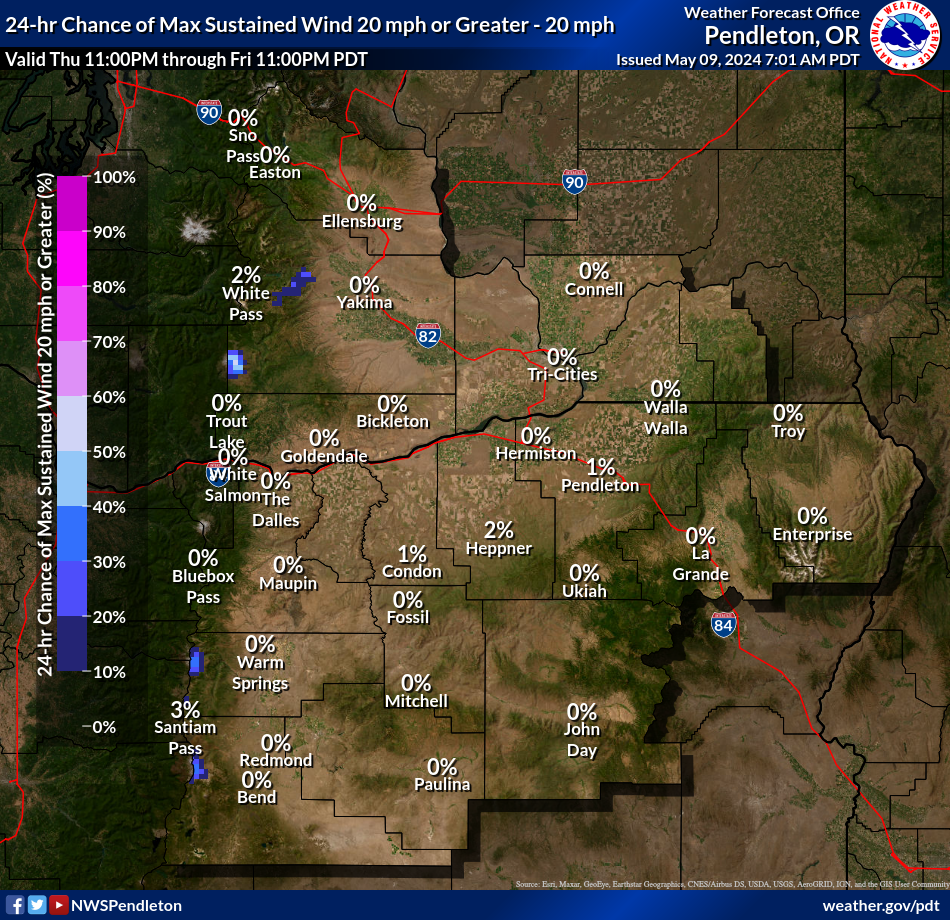
| Day 4 - 20 mph Threshold | Day 5 - 20 mph Threshold | Day 6 - 20 mph Threshold |
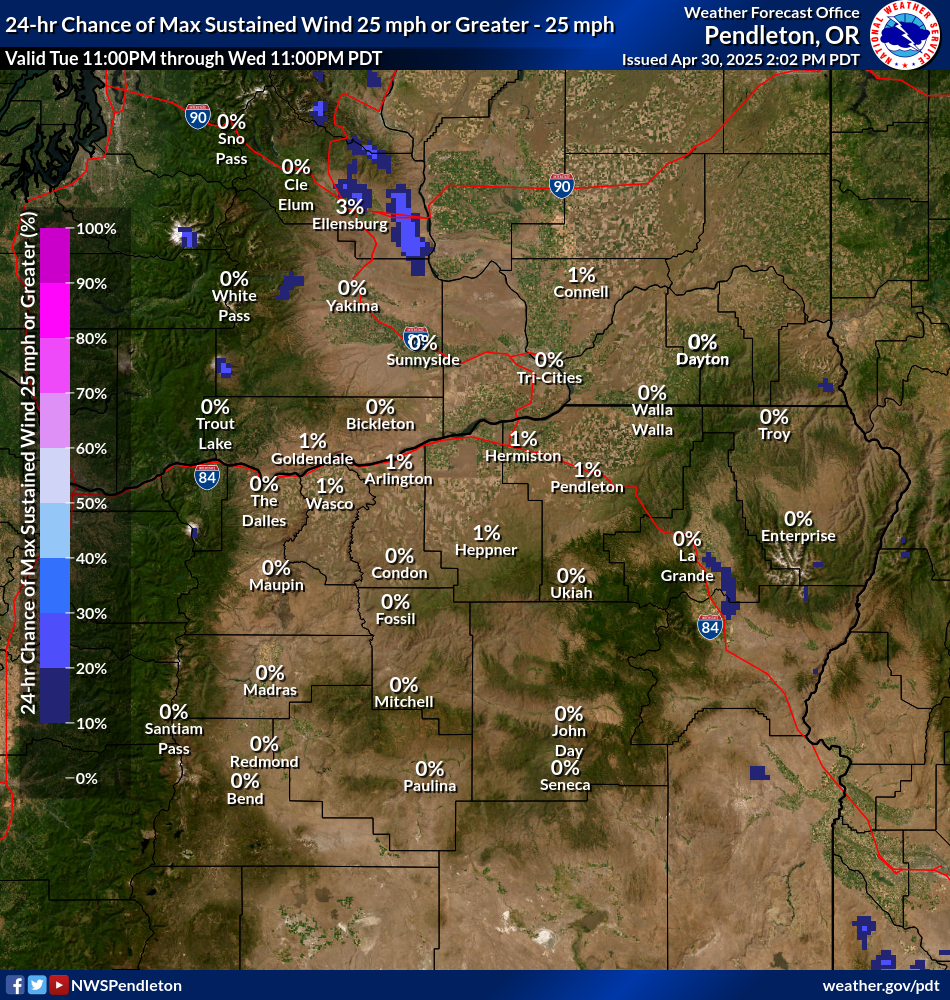
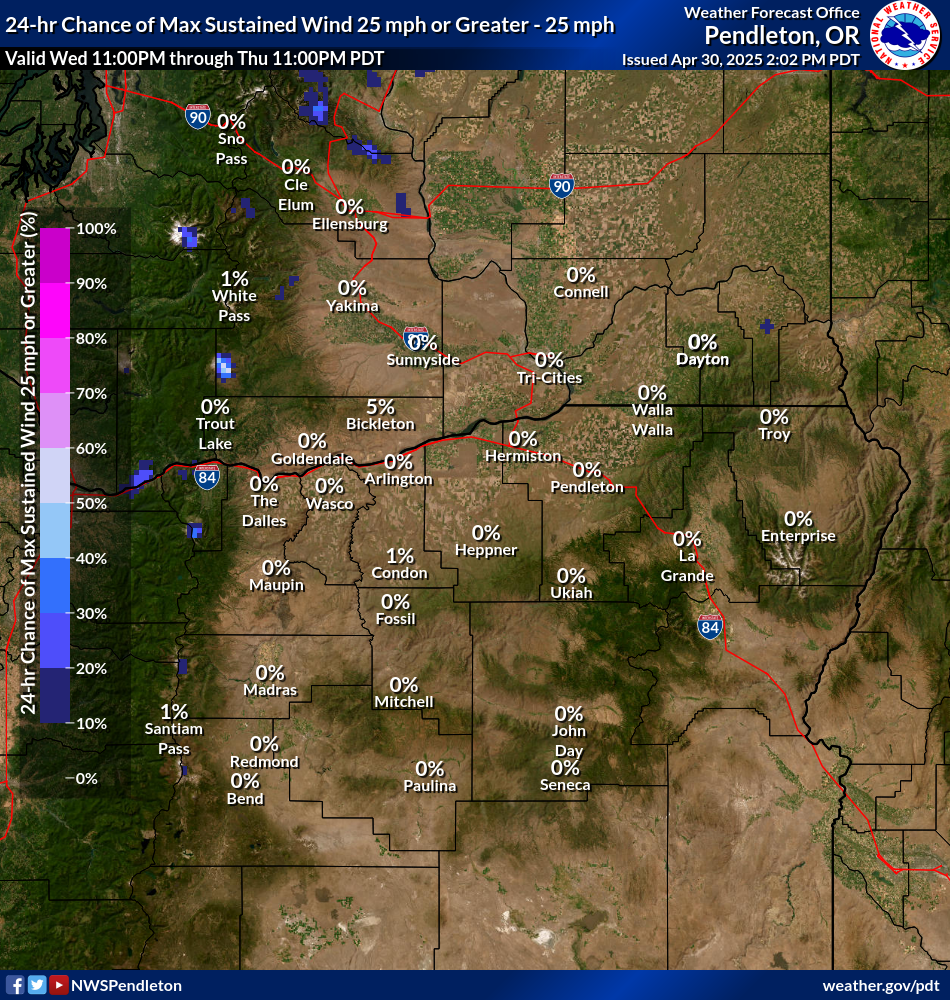
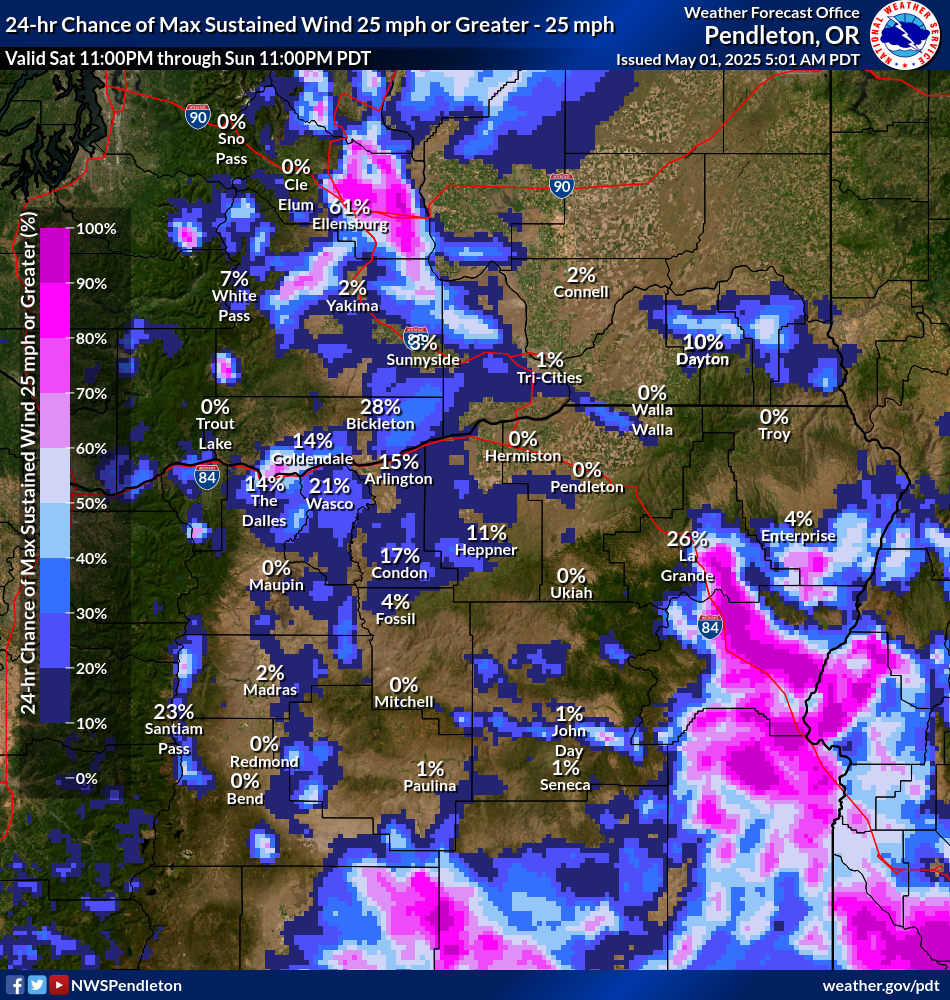
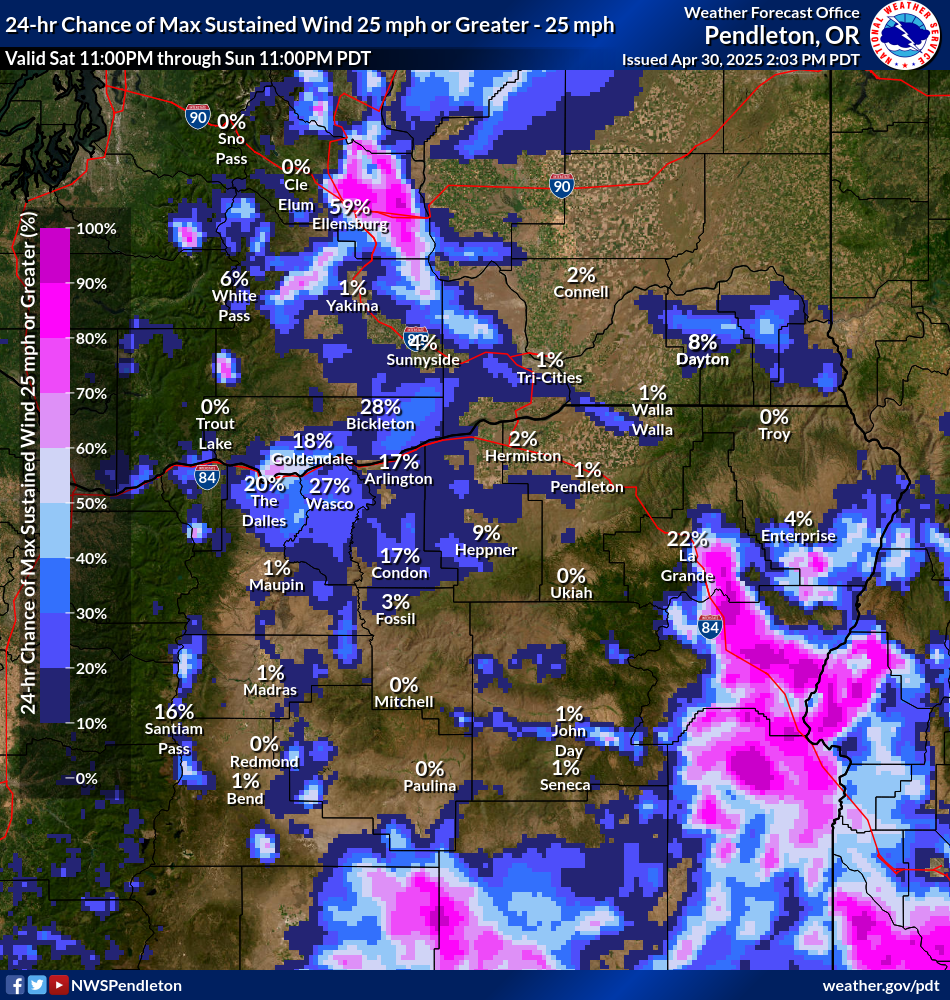
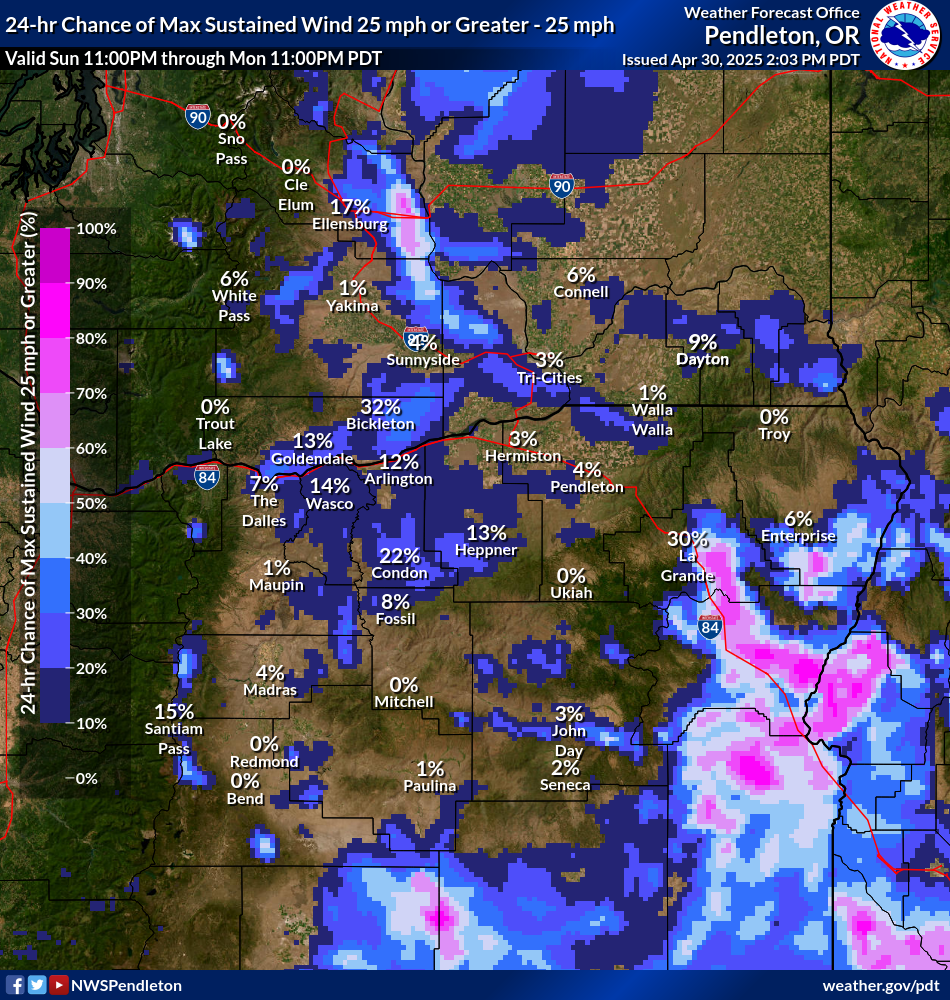
Probability of max wind speed exceeding 25 mph in 24-hour period
| Day 1 - 25 mph Threshold | Day 2 - 25 mph Threshold | Day 3 - 25 mph Threshold |
| Day 4 - 25 mph Threshold | Day 5 - 25 mph Threshold | Day 6 - 25 mph Threshold |
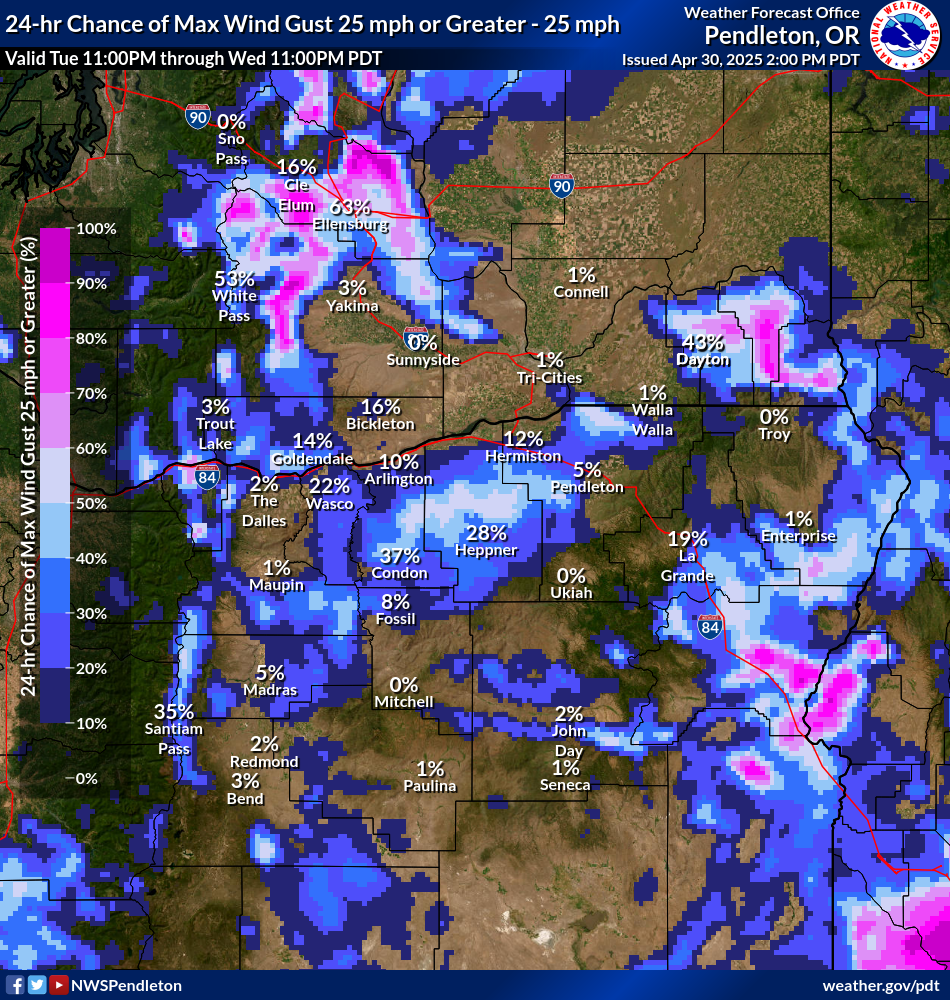
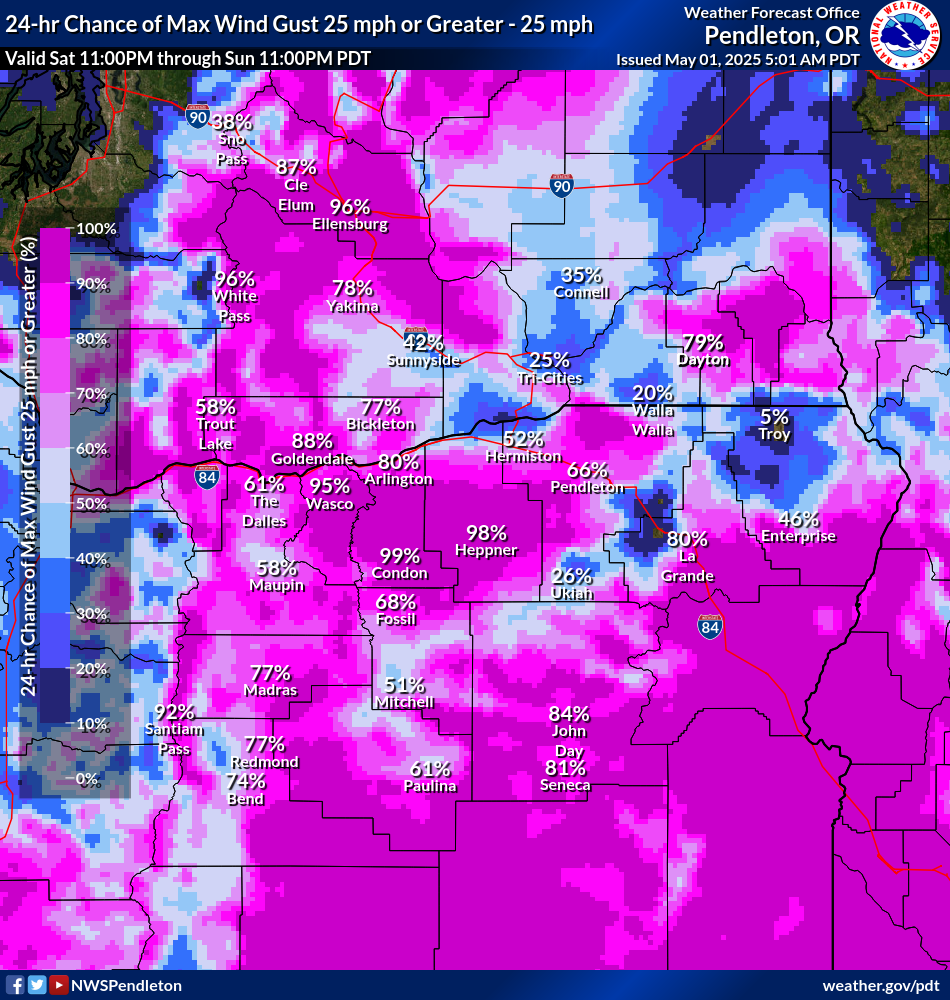
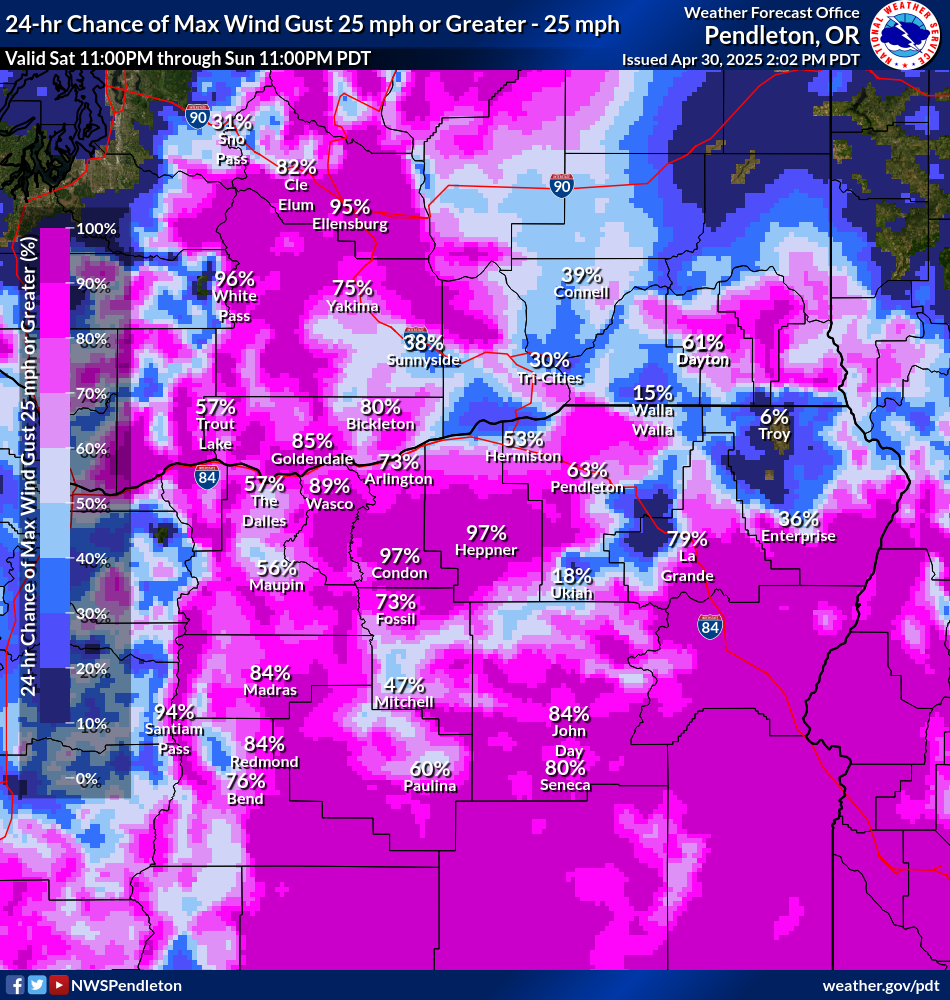
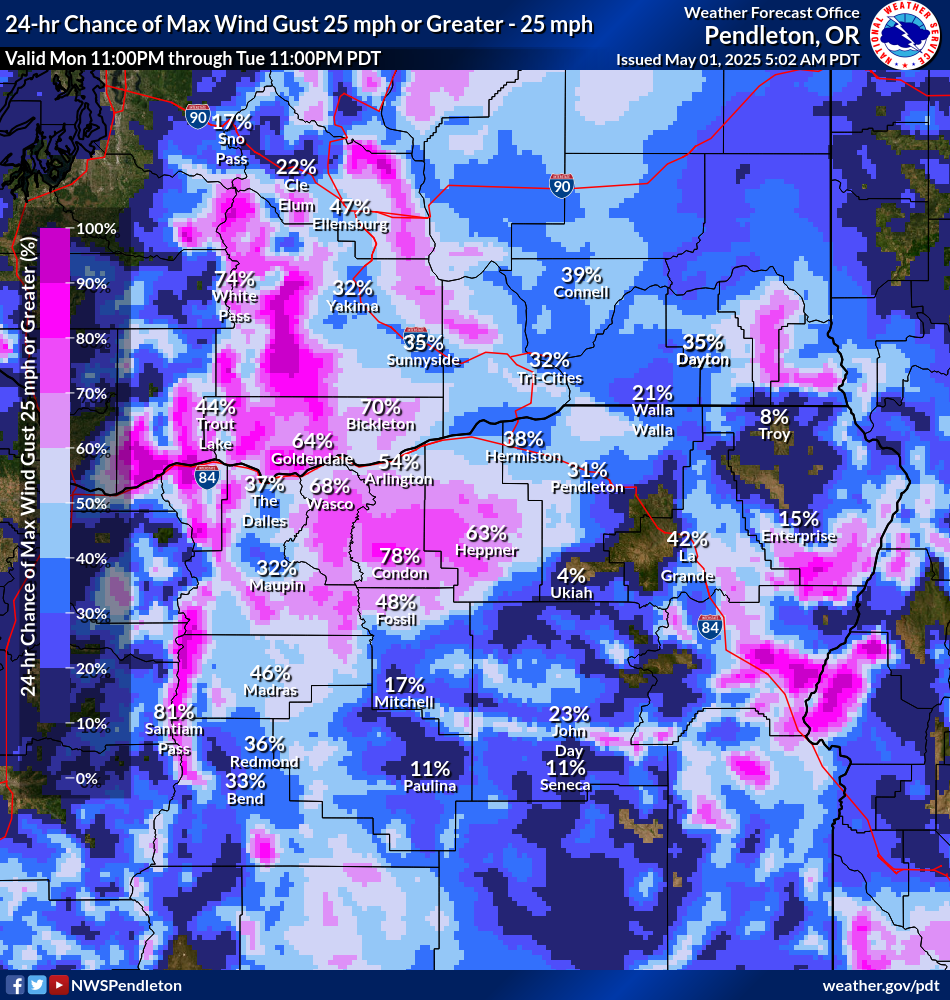
Probability of max wind gust exceeding 25 mph in 24-hour period
| Day 1 - 25 mph Threshold | Day 2 - 25 mph Threshold | Day 3 - 25 mph Threshold |
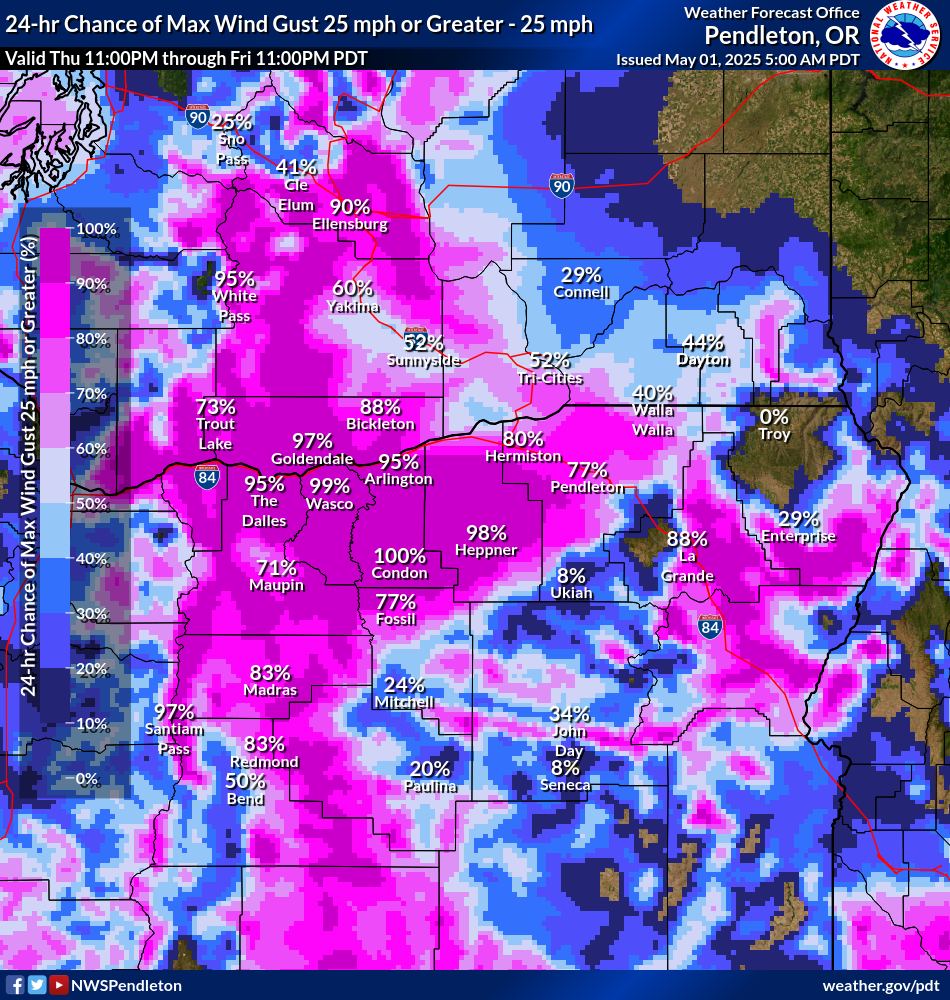
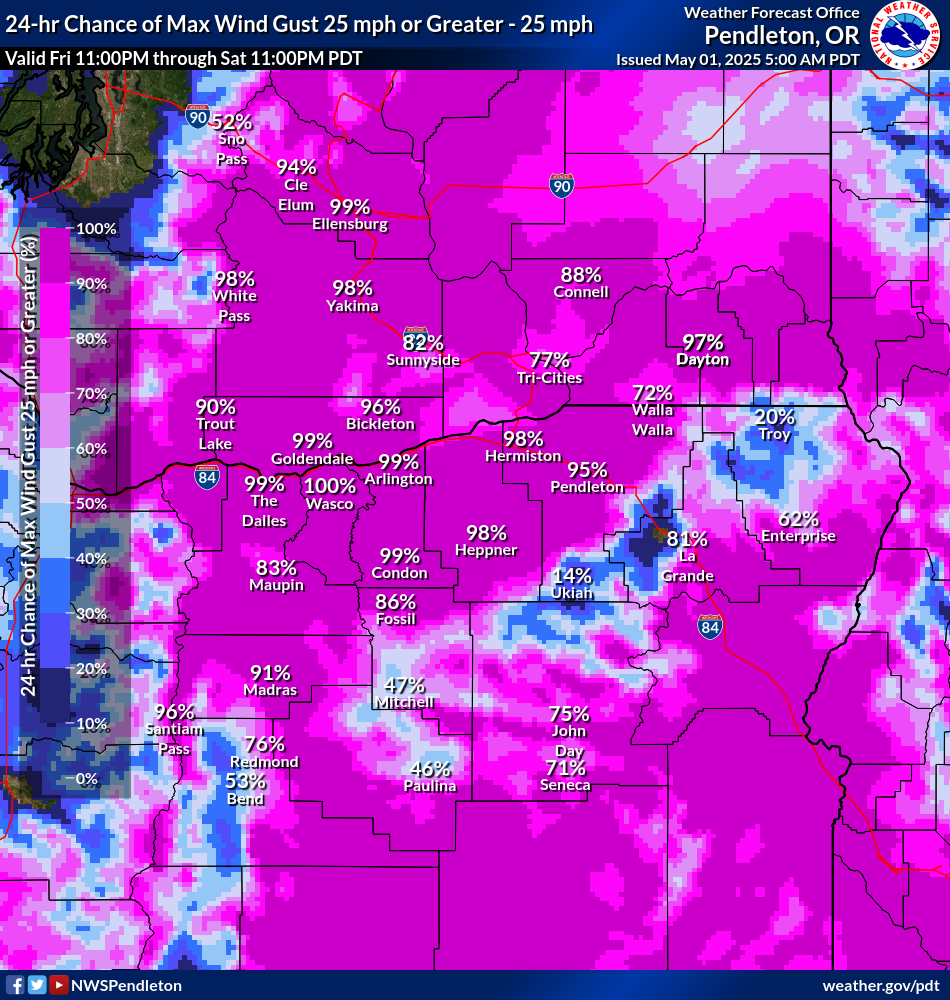
| Day 4 - 25 mph Threshold | Day 5 - 25 mph Threshold | Day 6 - 25 mph Threshold |
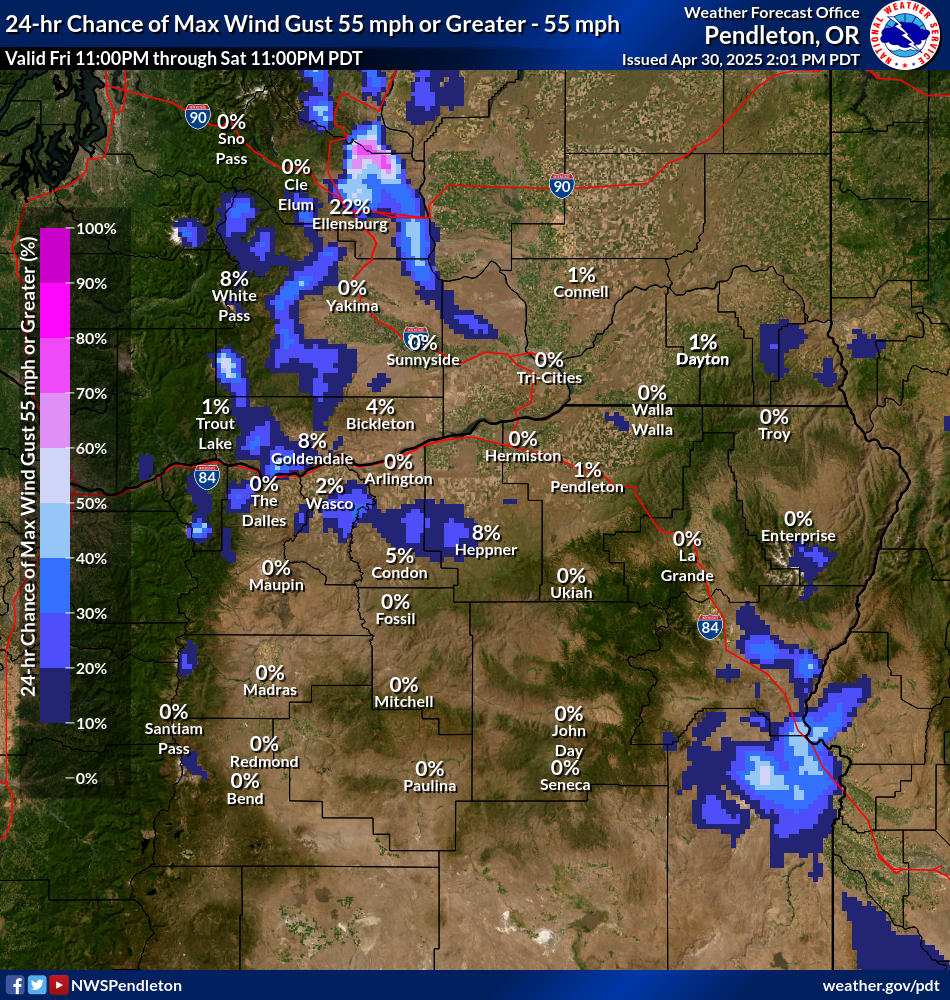
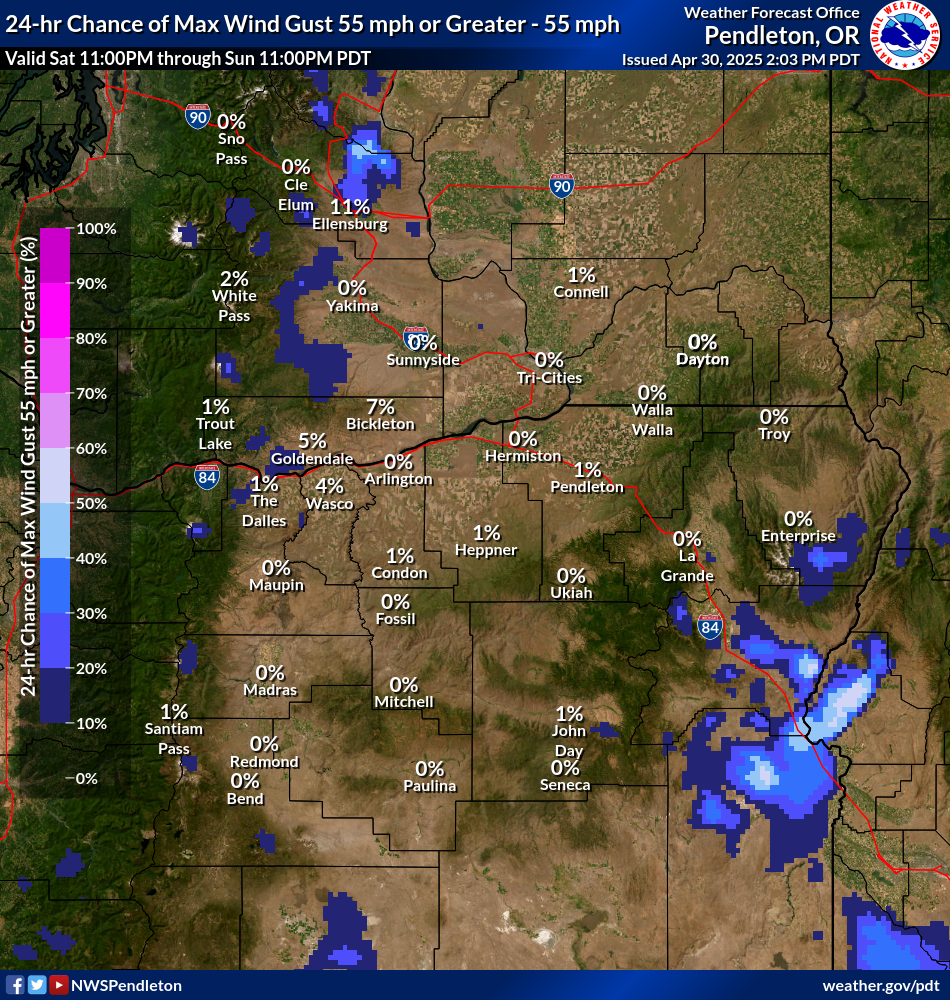
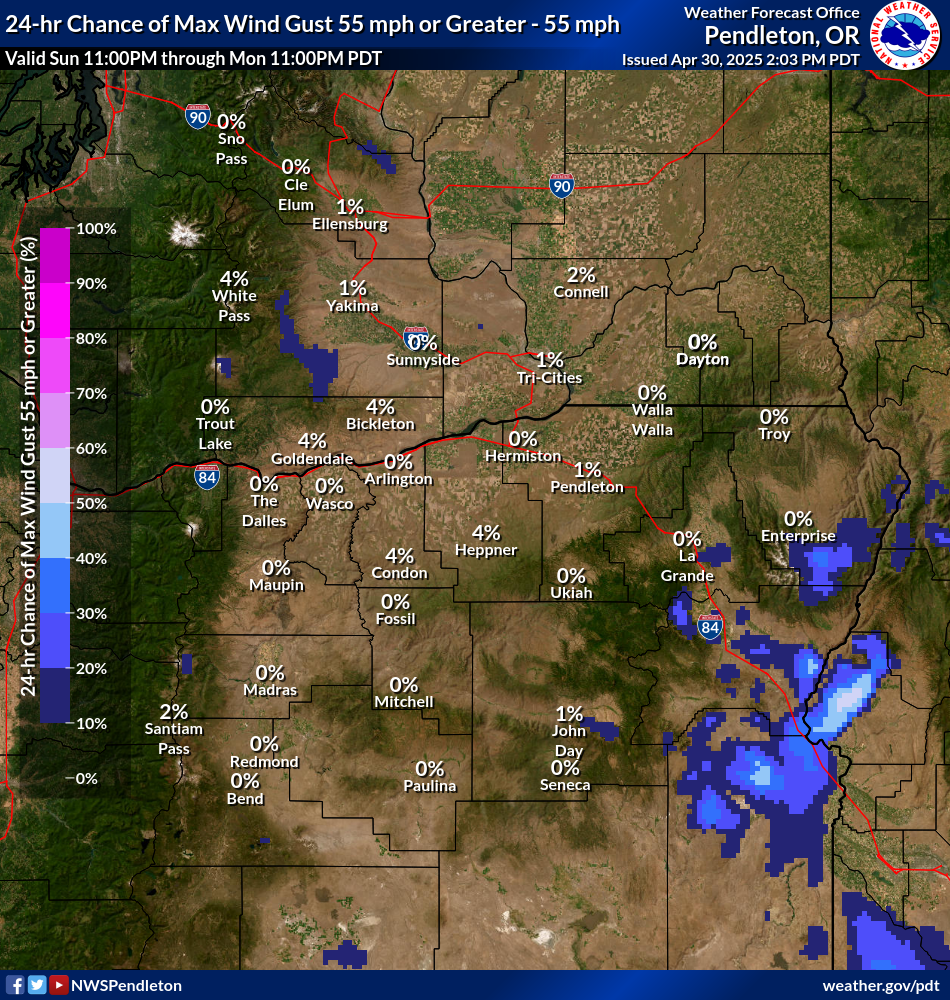
Probability of max wind gust exceeding 55 mph in 24-hour period
| Day 1 - 55 mph Threshold | Day 2 - 55 mph Threshold | Day 3 - 55 mph Threshold |

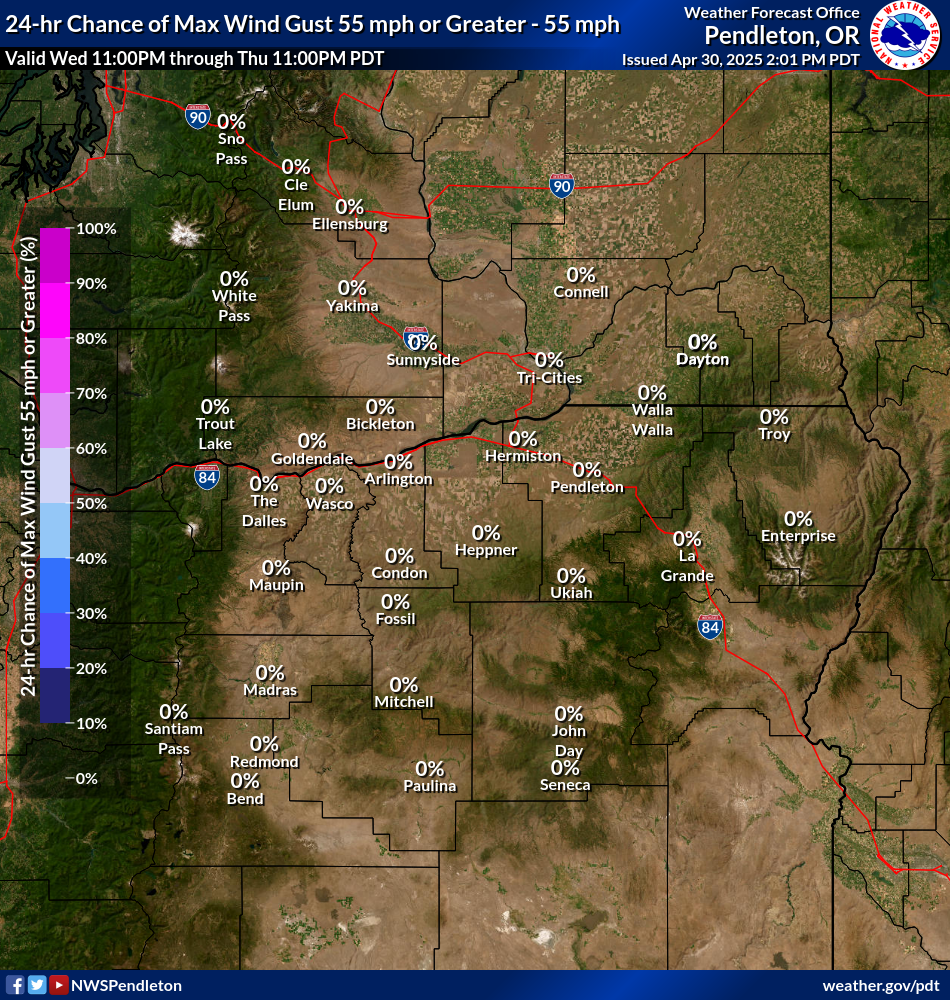

| Day 4 - 55 mph Threshold | Day 5 - 55 mph Threshold | Day 6 - 55 mph Threshold |


