Review of the 2022 Monsoon
Across the Southwest U.S.
Compiled by NOAA/NWS Phoenix, AZ. Published Ju1. 11, 2023
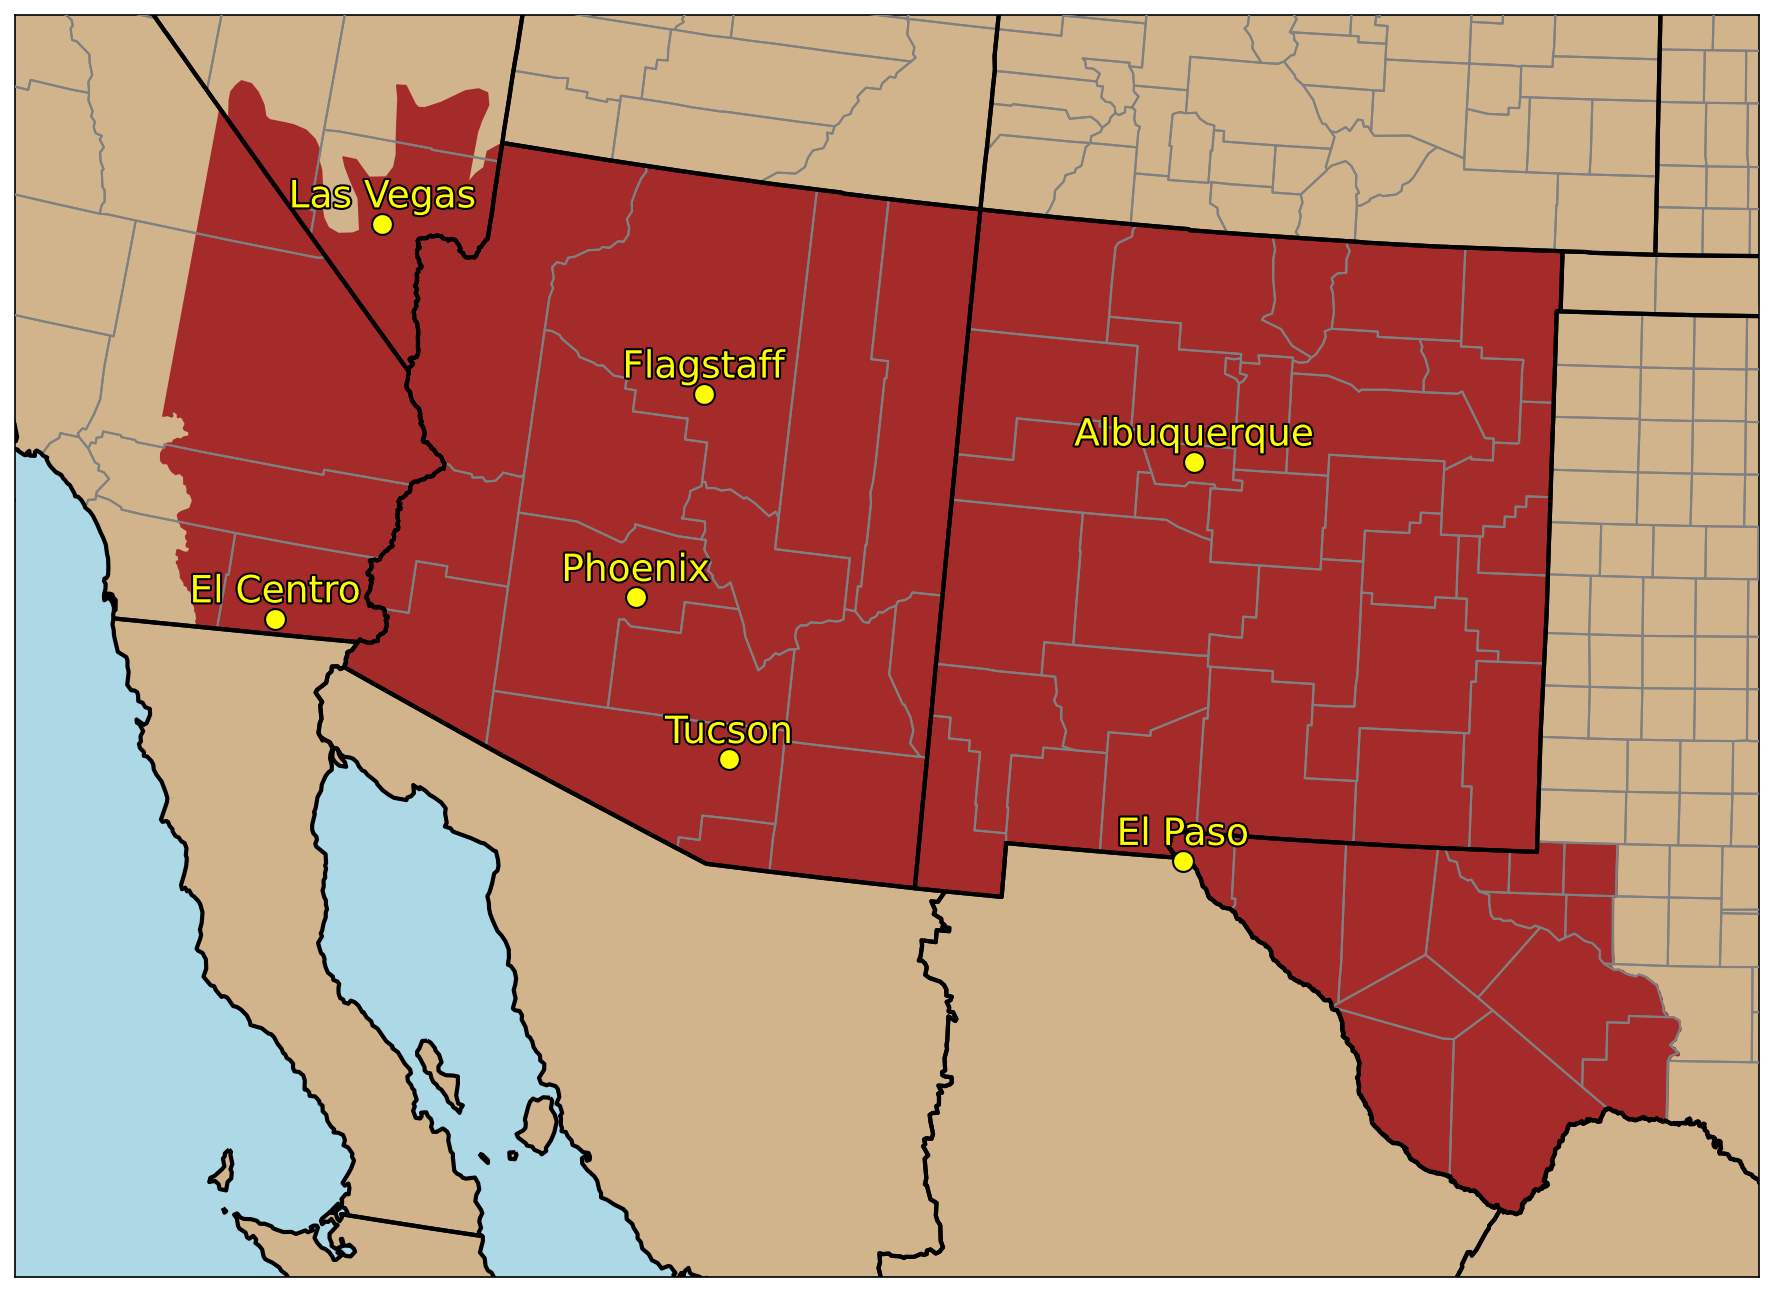
Fig 1. Areal extent (maroon) of the “Southwest” commonly referenced in this analysis.
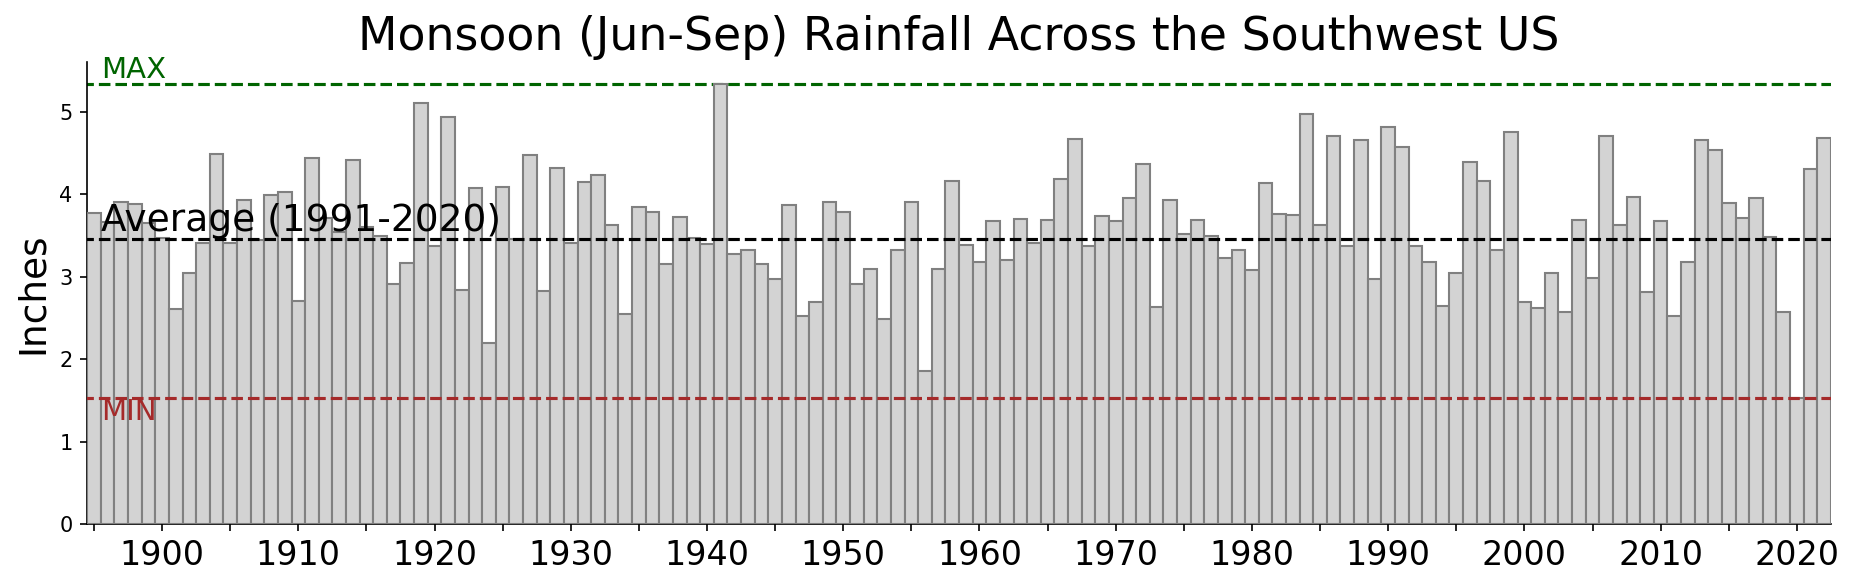
Following the 22nd wettest (since 1895) monsoon across the Southwest (here defined as far southern Nevada, southeast California, Arizona, New Mexico, and far west Texas; Figure 1) in 2021, the 2022 monsoon was even more active and ranked 9th wettest on record. This was the wettest monsoon since 2006. Average rainfall during the core monsoon months of Jun-Sep across the region was 4.68", compared to the 1991-2020 average of 3.69” (Figure 2).
Fig 2. Average rainfall across the Southwest each monsoon (1895-2022).
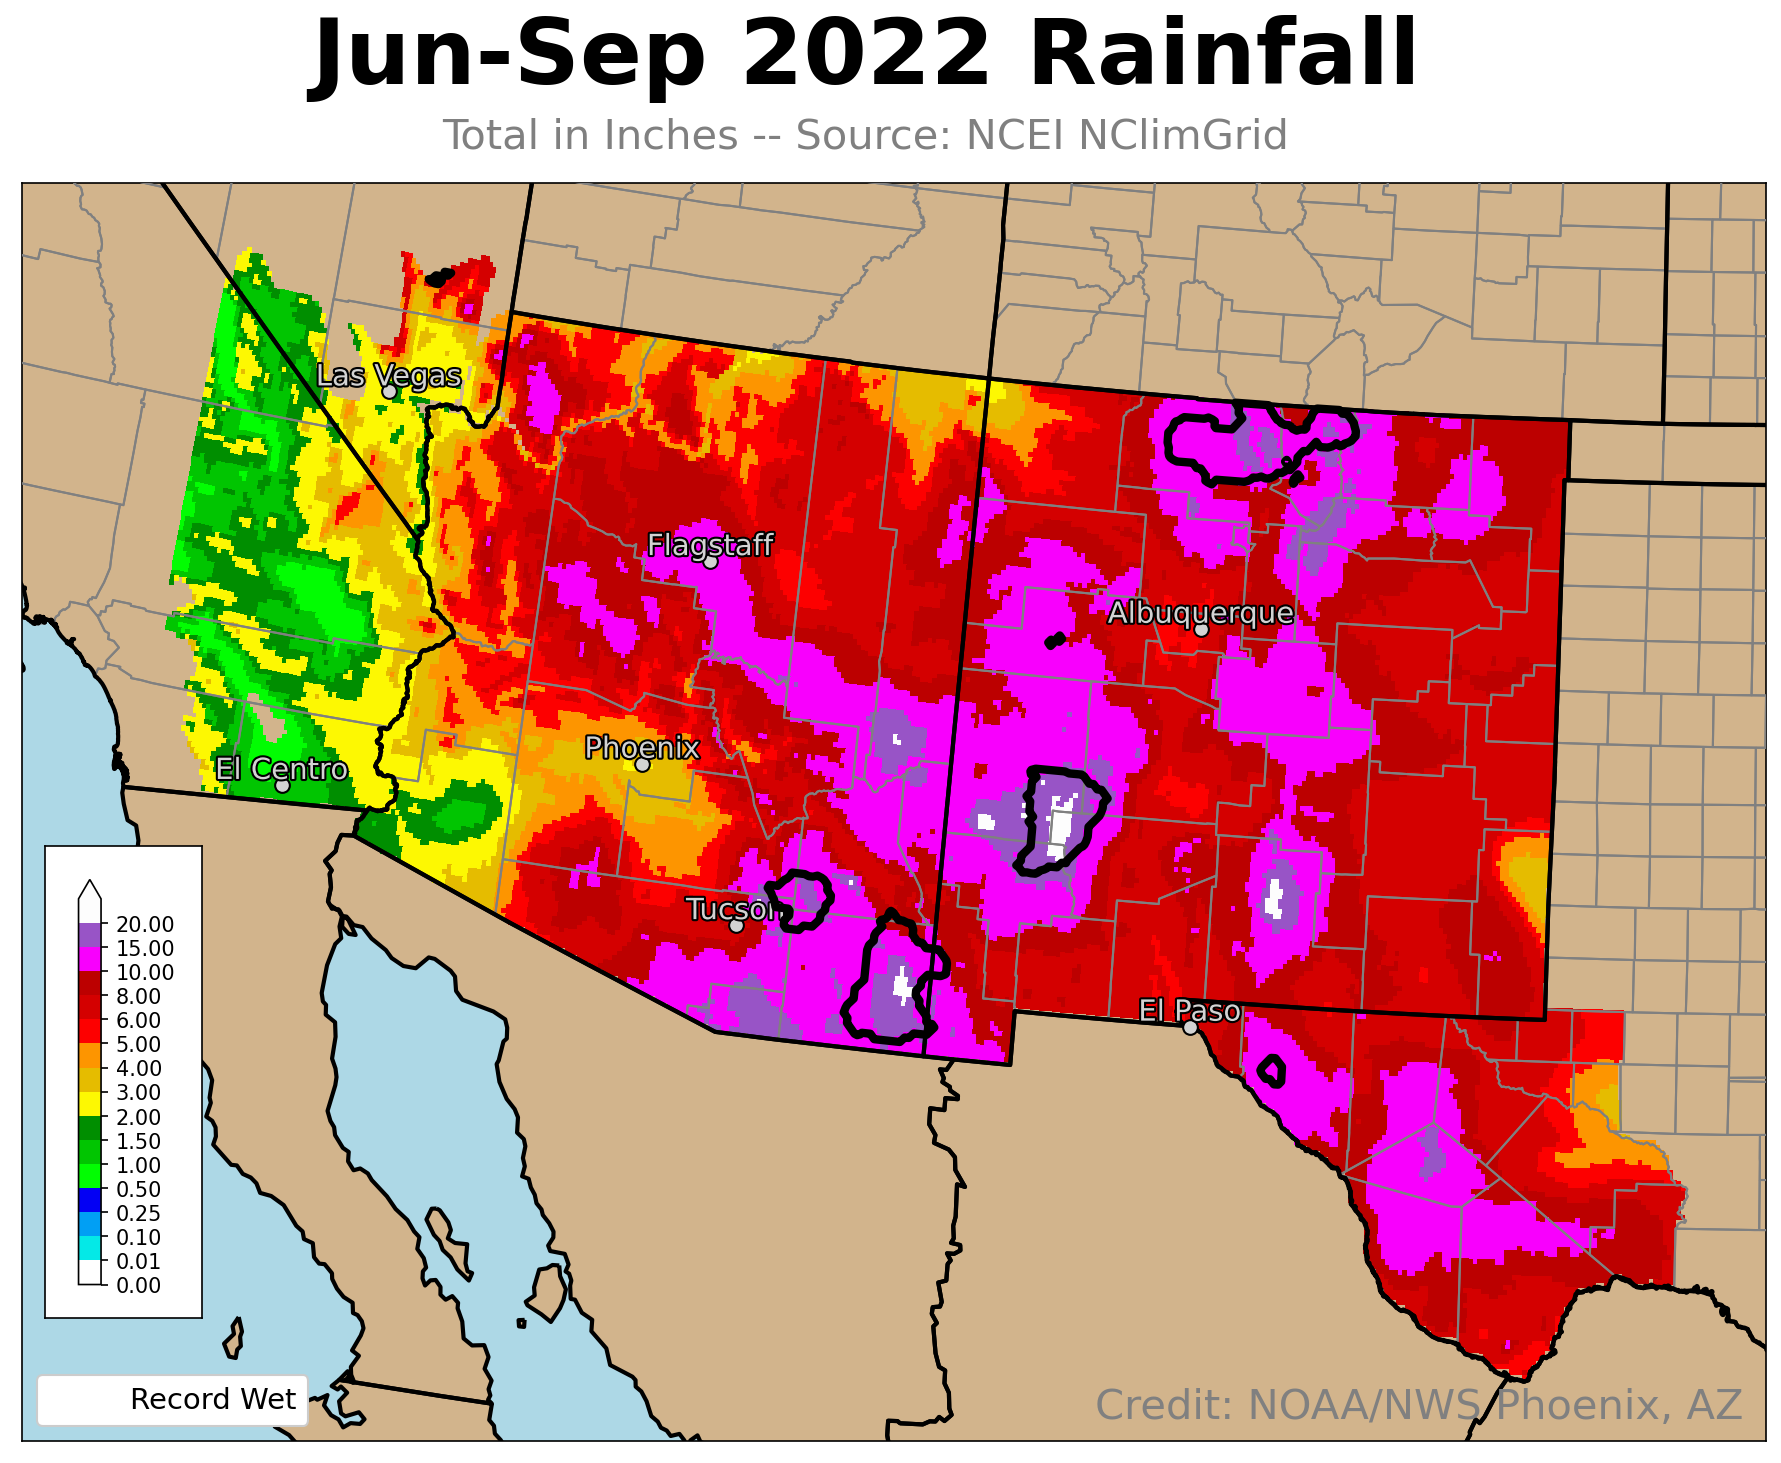
Fig 3. Total precipitation across the Southwest during the 2022 monsoon.
reas outlined in black indicate where record precipitation fell.
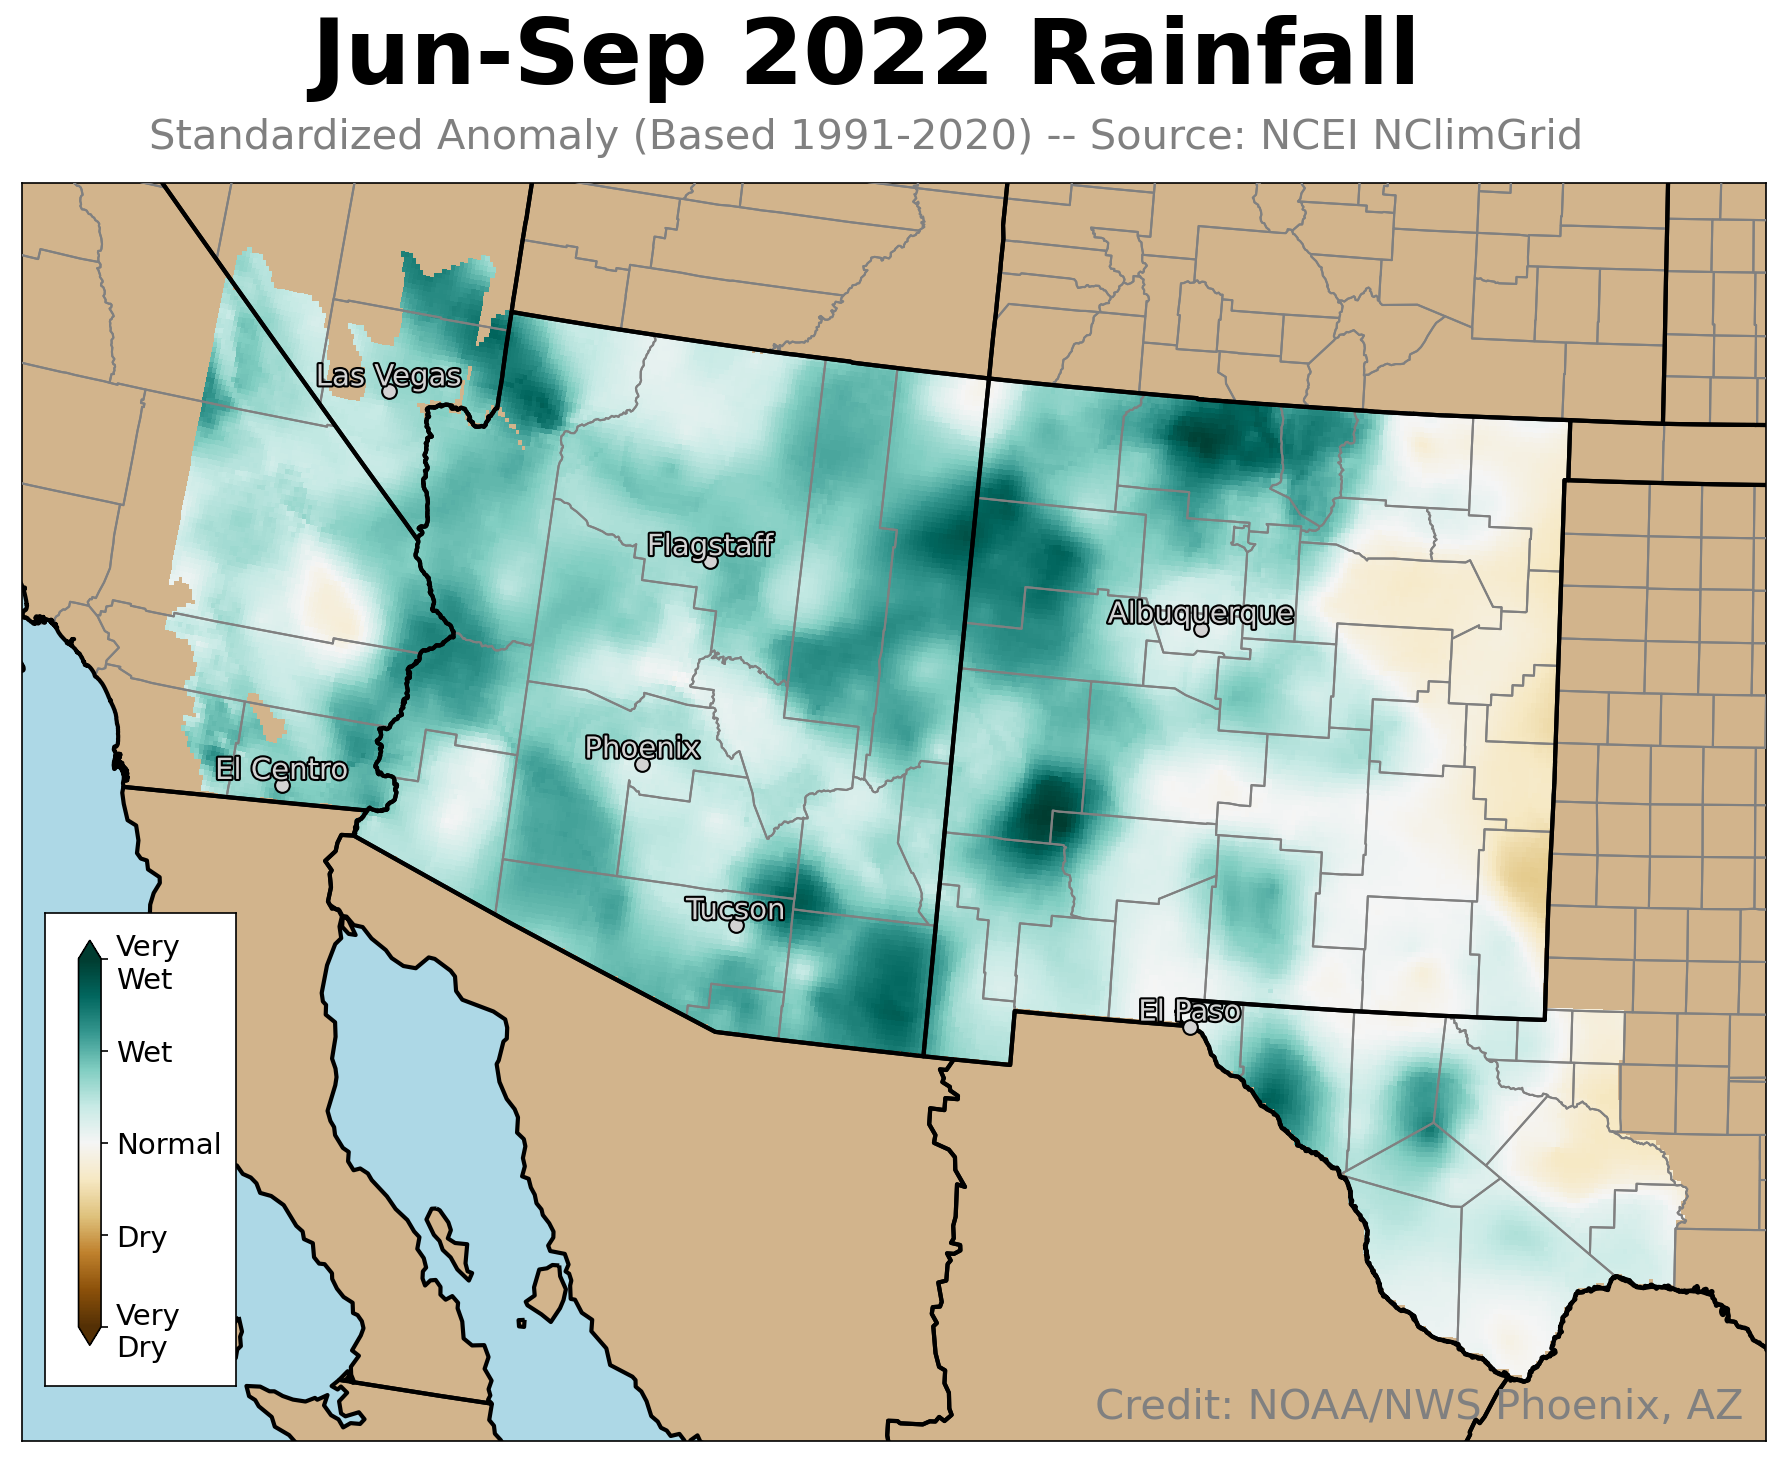
Fig 4. Normalized precipitation across the Southwest during the 2022 monsoon.
Widespread heavy rain was observed across the mountains of Arizona and New Mexico, with some areas receiving over 20 inches (Figure 3). Several pockets of record-setting precipitation were noted, primarily over the mountains of southeast Arizona, the eastern areas of the Gila National Forecast, and the mountainous areas of far north-central New Mexico. Over 77% of the Southwest received at least 5" of rain. When normalizing the rainfall amounts, much of the region was wet or very wet (Figure 4).
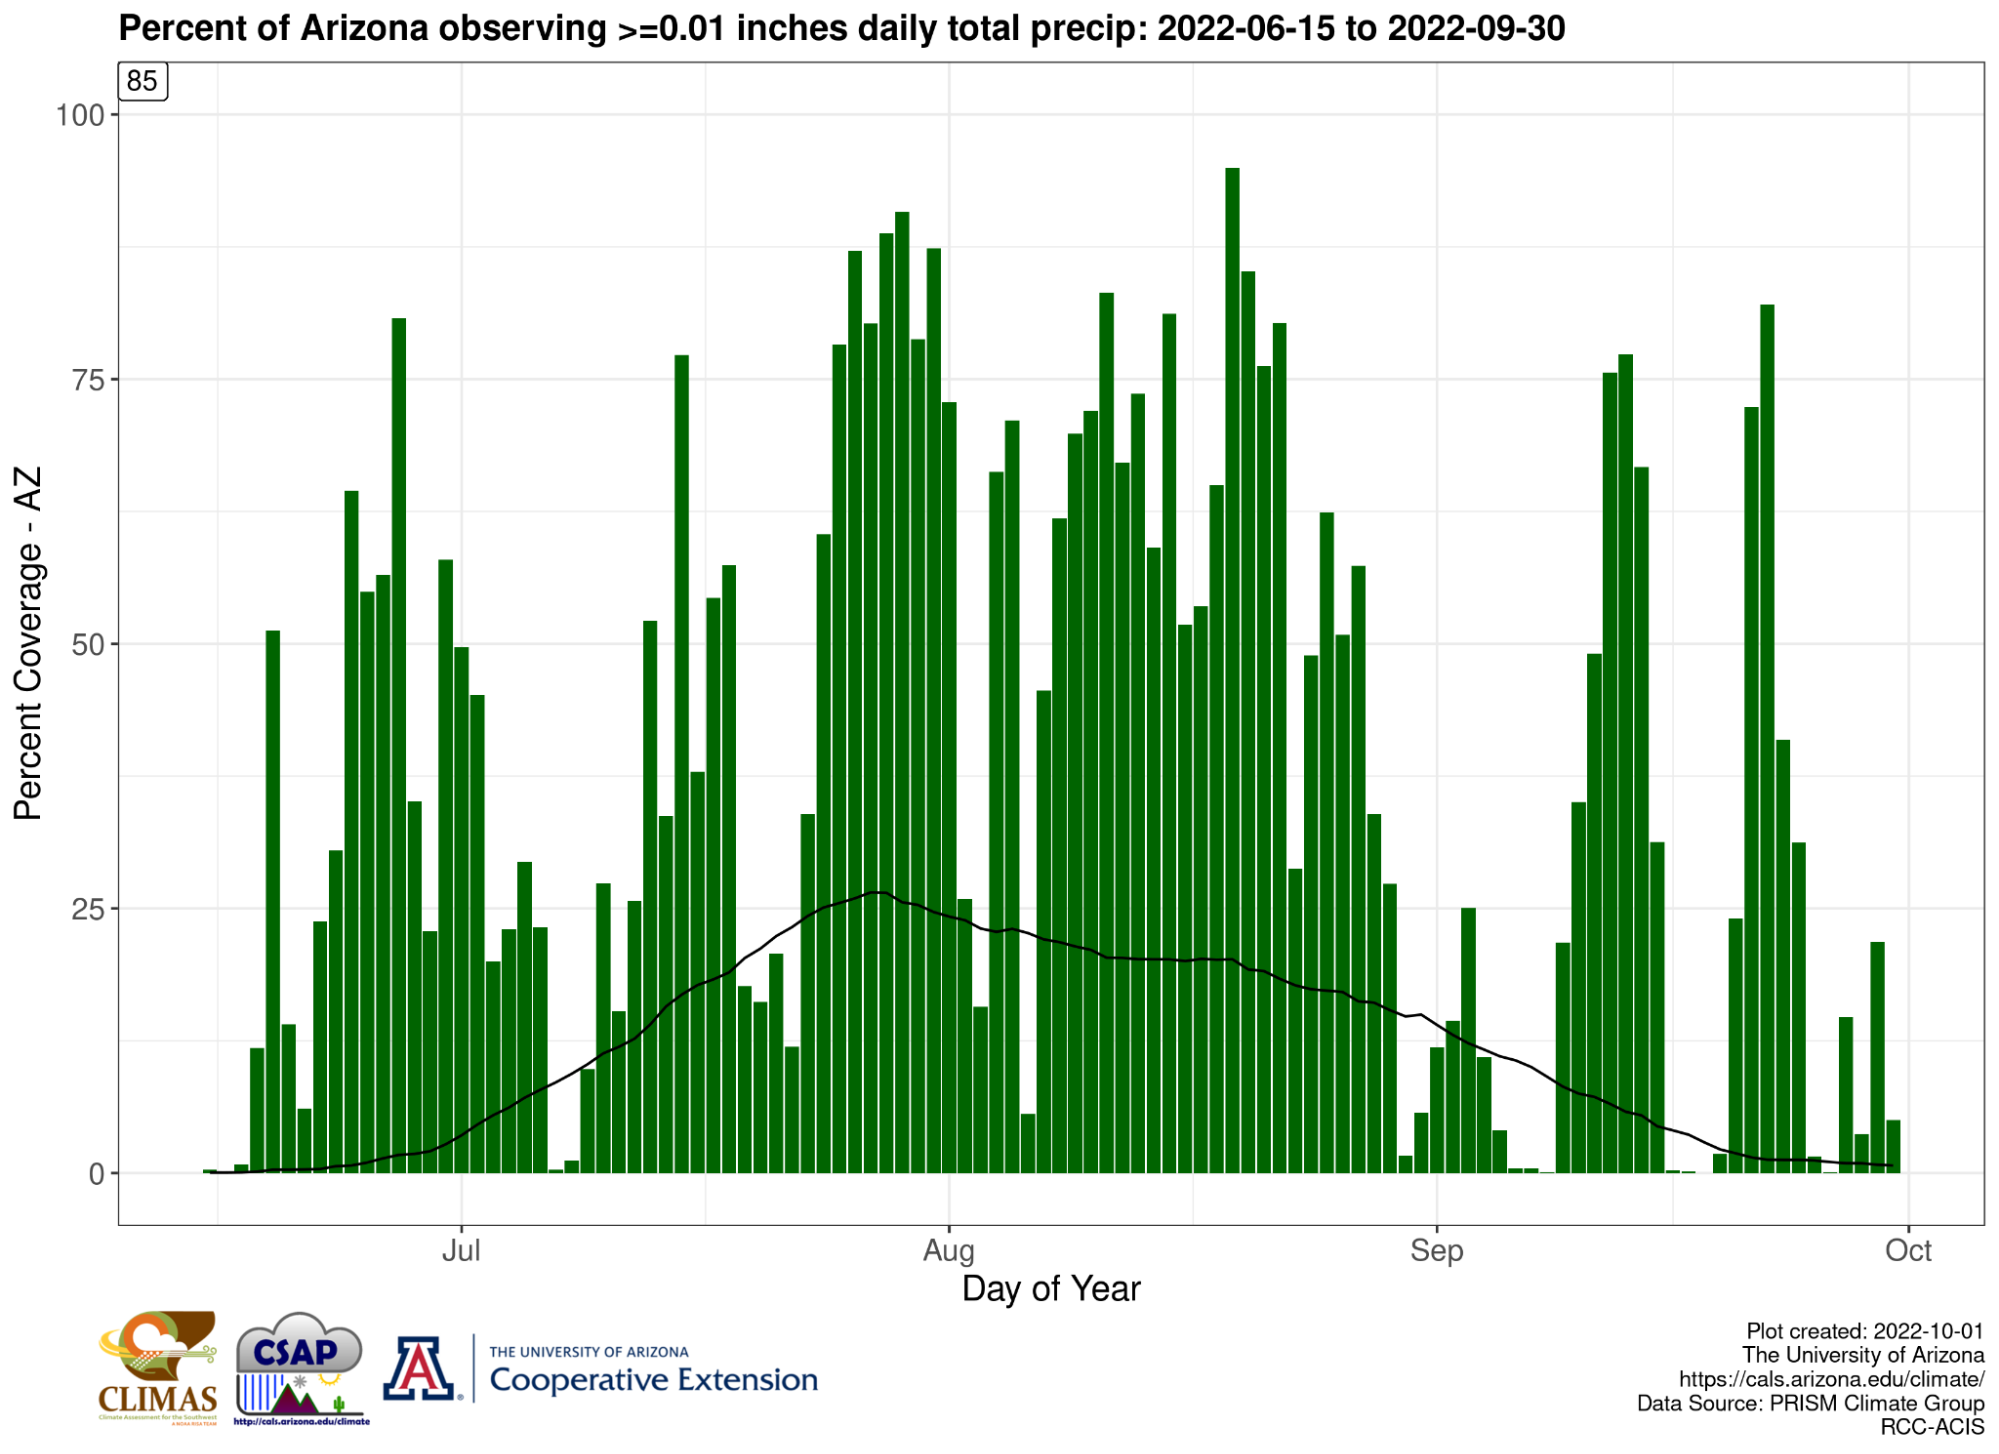
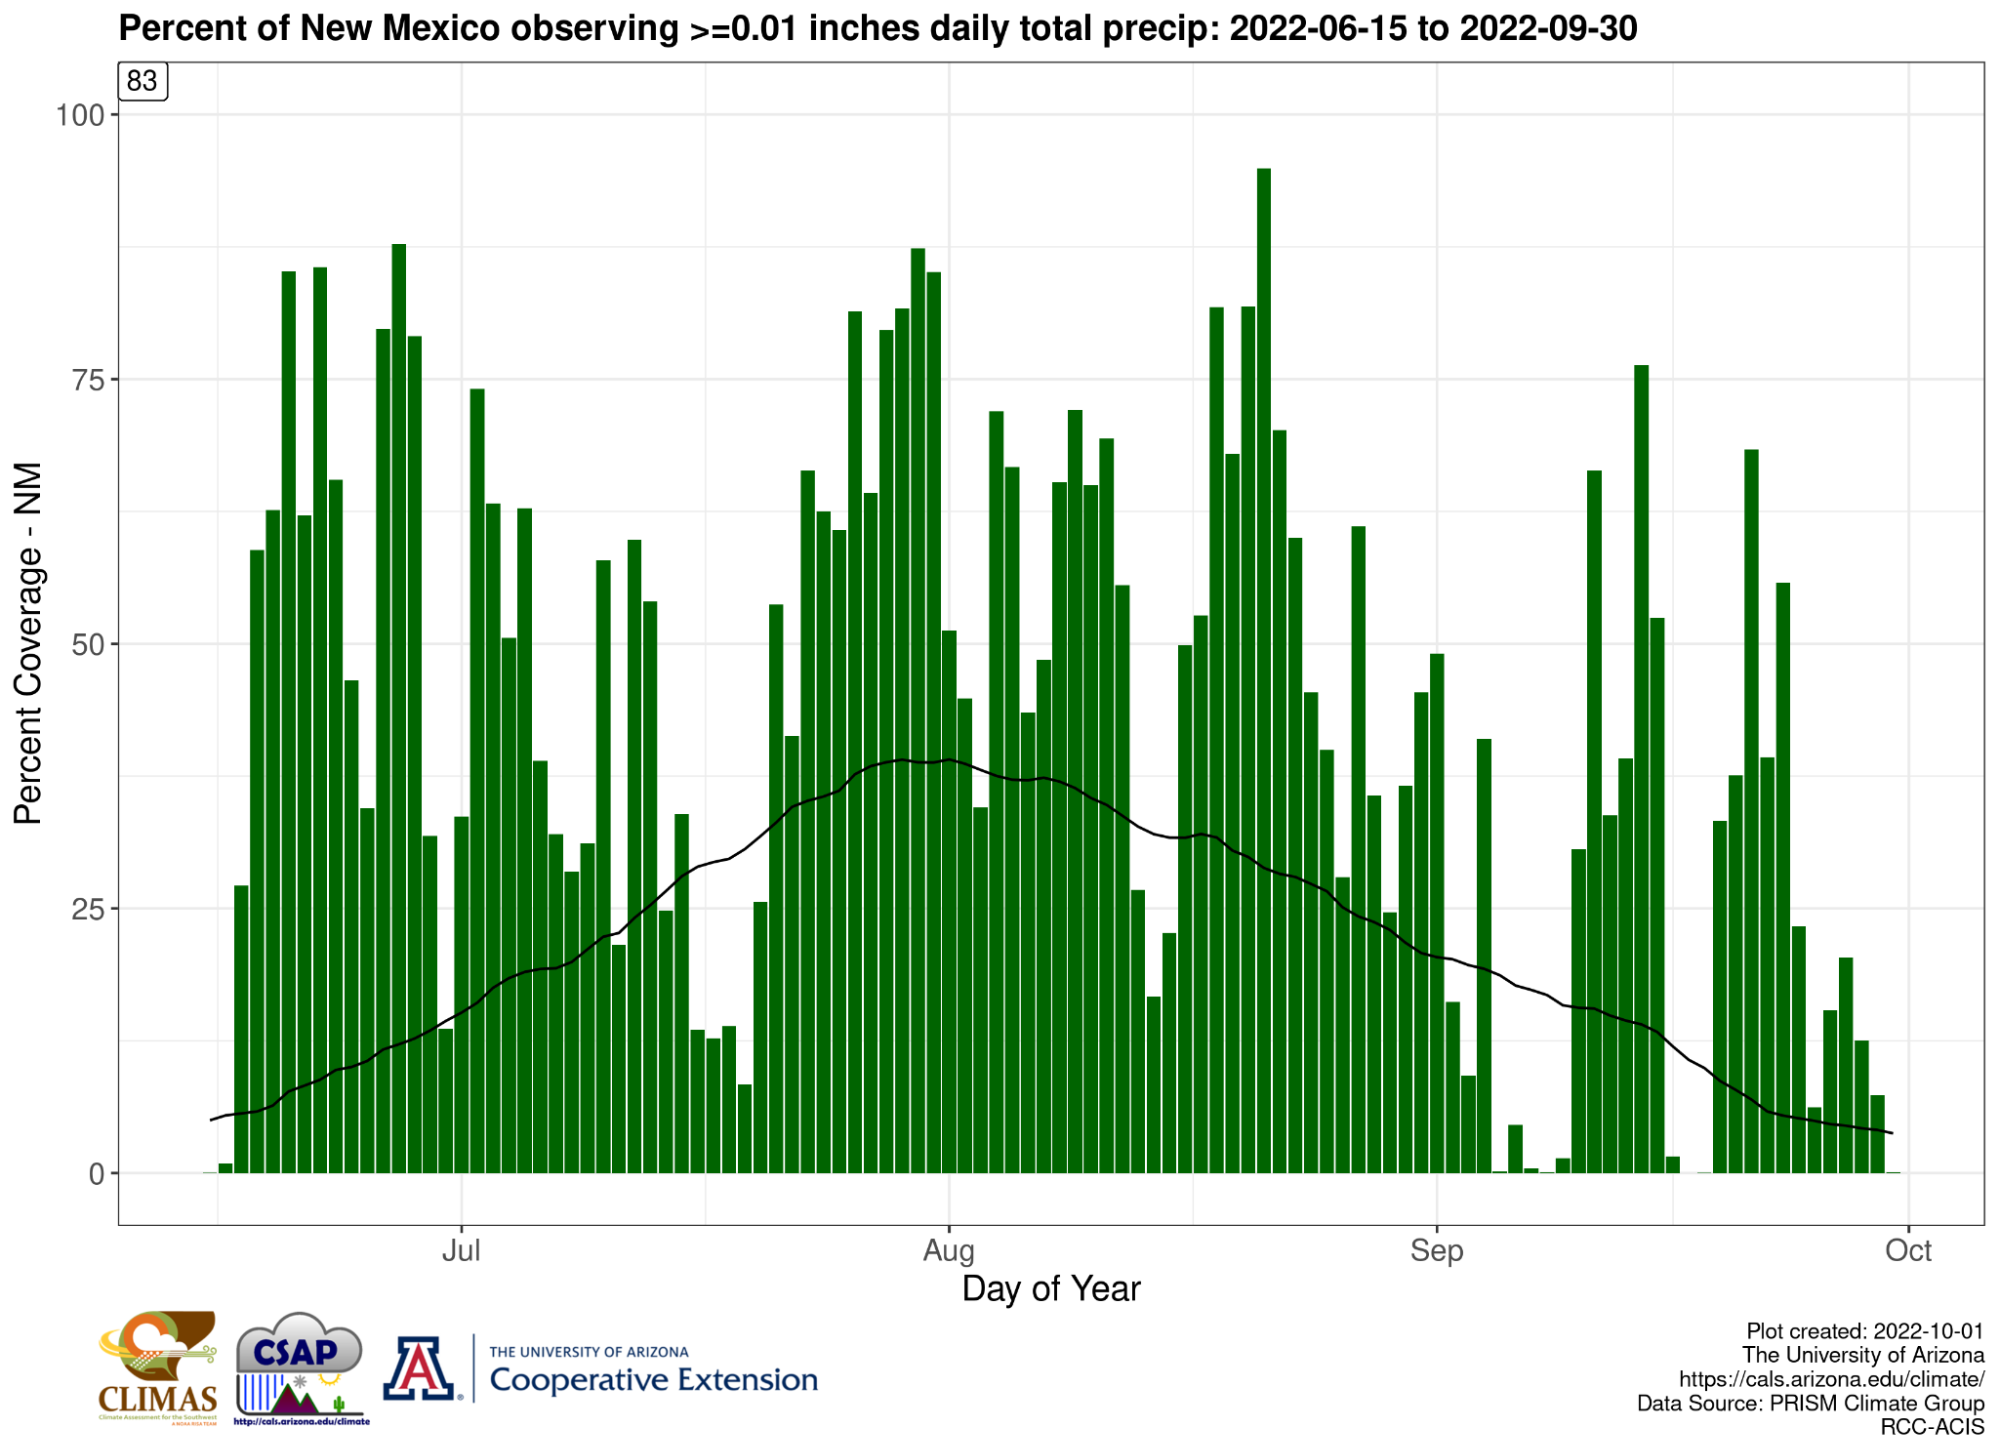
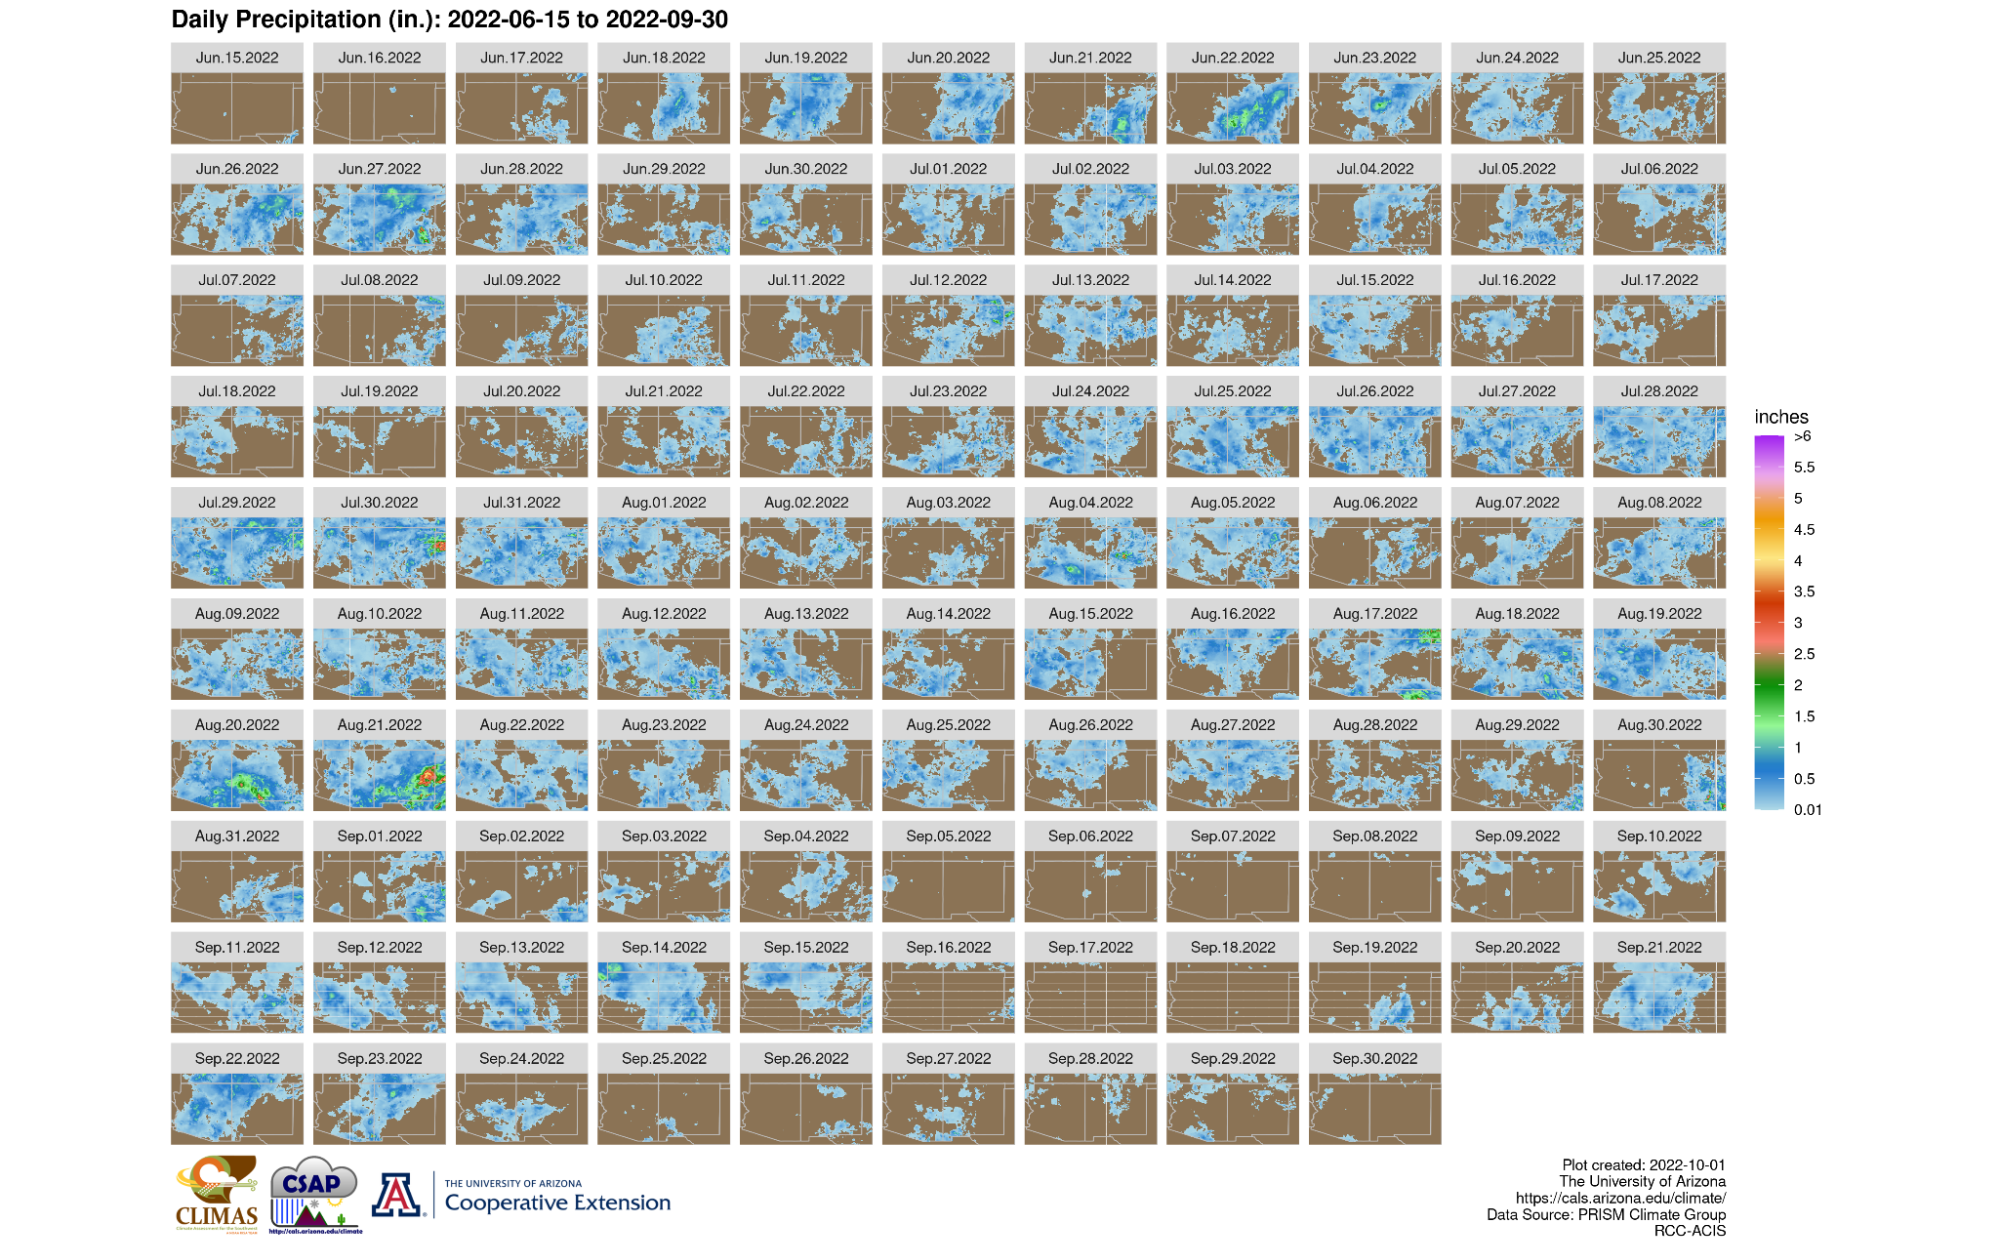
Data from the Climate Assessment for the Southwest (CLIMAS)also indicate a very wet monsoon. On 44 (47) days, over half of Arizona (New Mexico) observed measurable rainfall (Figure 5). From mid June until early September, precipitation was a daily occurrence across the region, with a notable break not occurring until the first week of September (Figure 6).
|
|
|
|
Fig. 5. Daily percent coverage of Arizona (left) and New Mexico (right) observing 0.01”+ of precipitation (Jun 15 - Sep 30, 2020). Source: CLIMAS/OSU PRISM. |
|
Fig. 6. Daily rainfall data across the region. Source: CLIMAS/OSU PRISM.
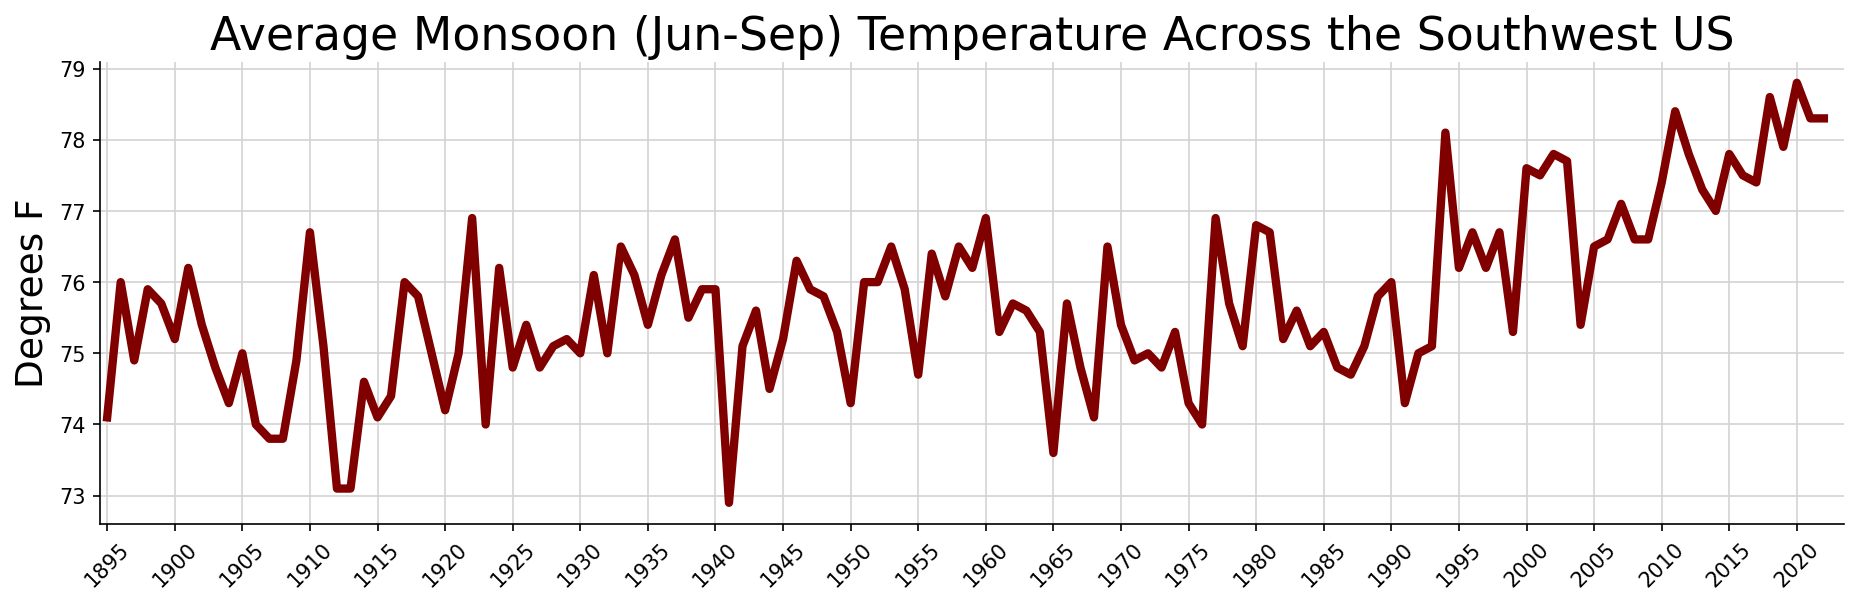
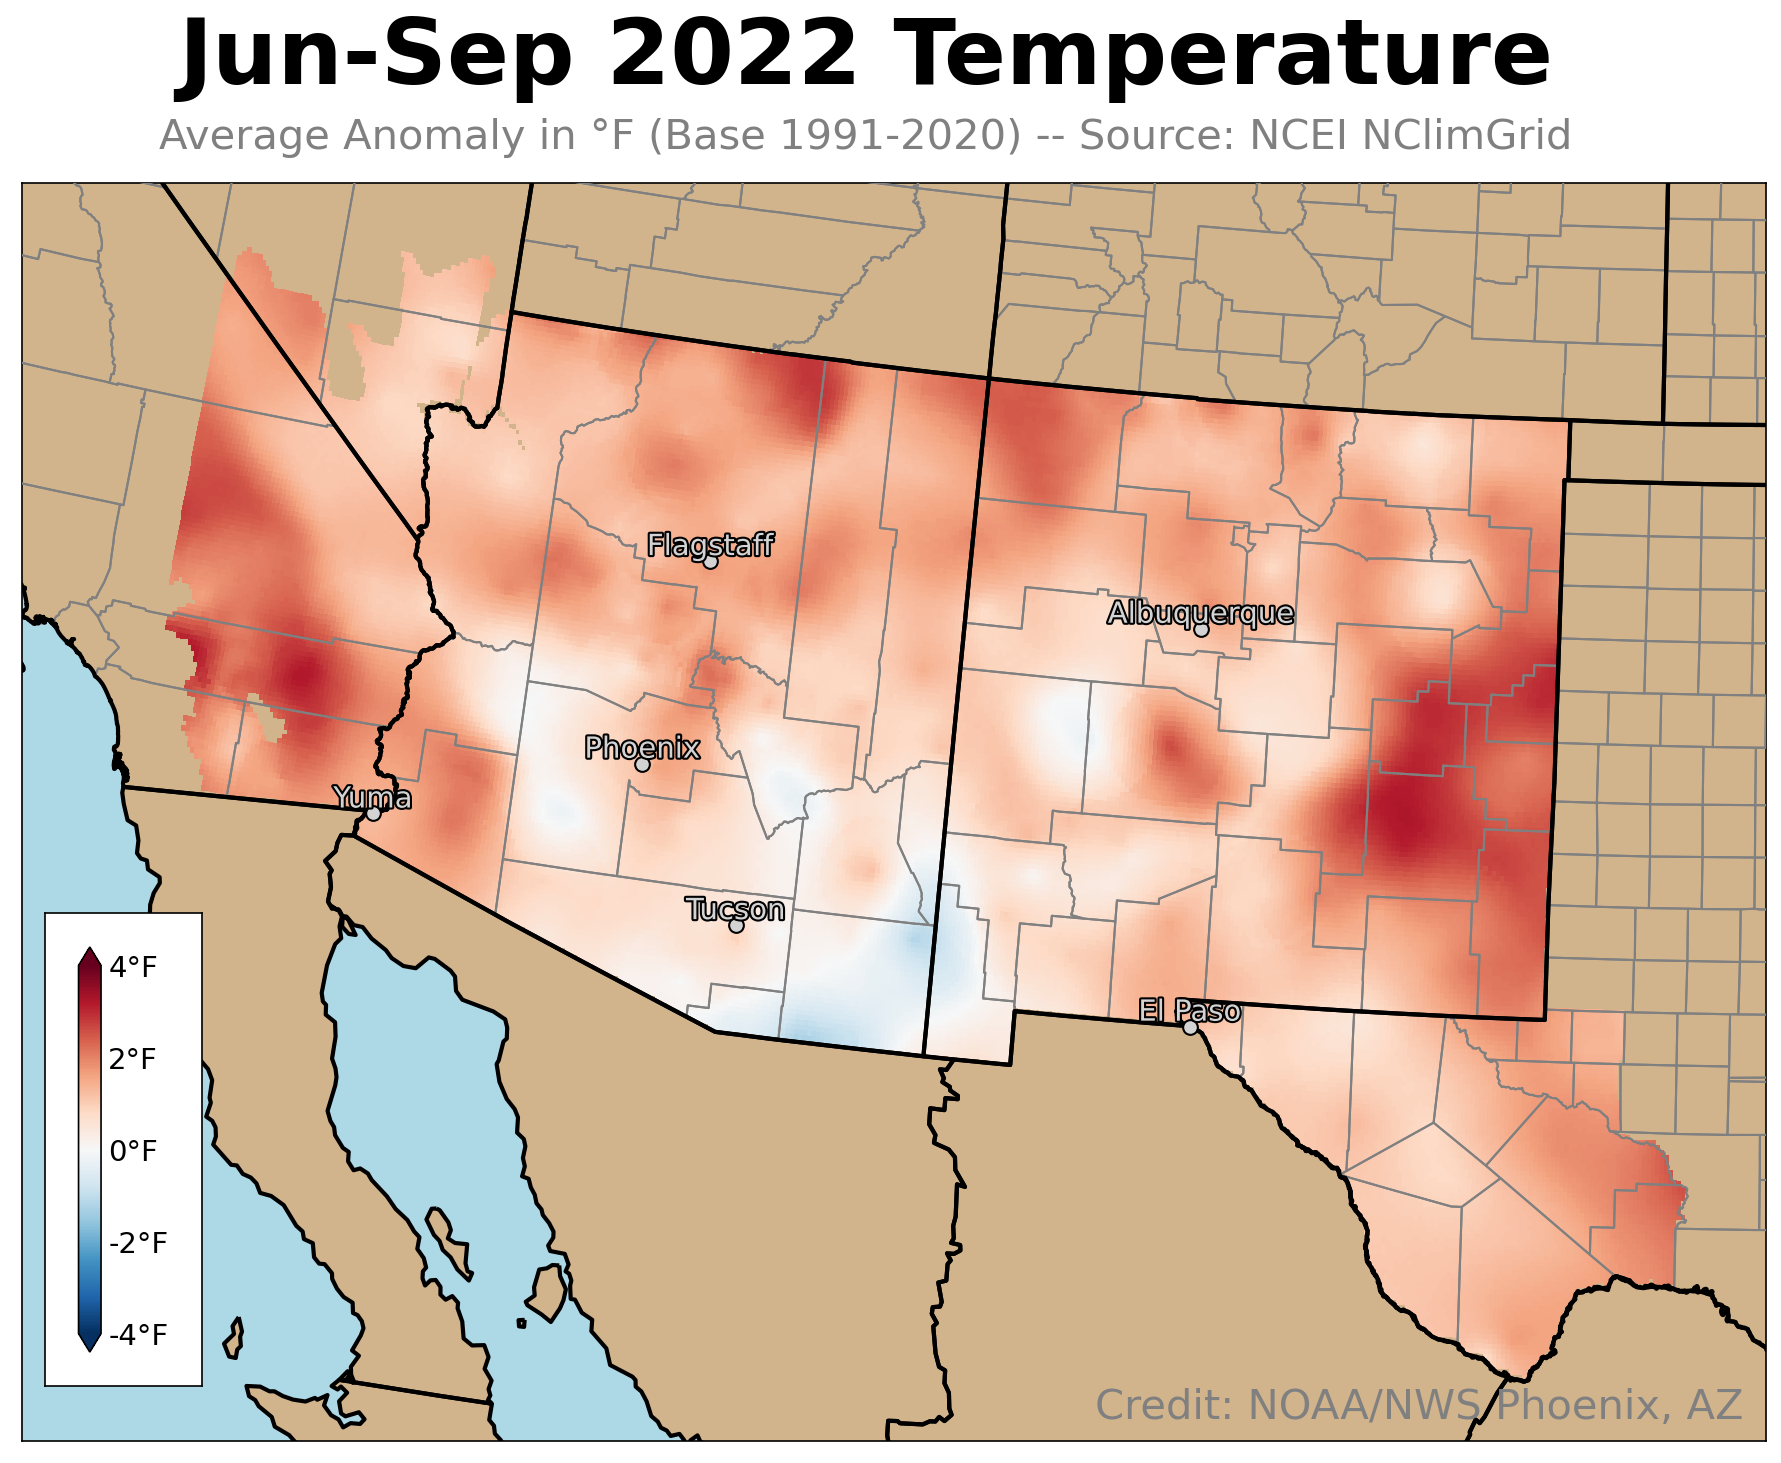
Despite the active season, it was still a hot monsoon in 2022. The average temperature for the four month period across the Southwest was 78.3 °F, which tied with 2021 for the 4th warmest on record. This is a continuation of long-term warming across the region (Figure 7). Only in areas of the most persistent rain were below normal temperatures observed (Figure 8).
Fig 7. Average temperature across the Southwest each monsoon (1895-2022).
Fig 8. Normalized average temperature across the Southwest during the 2022 monsoon.
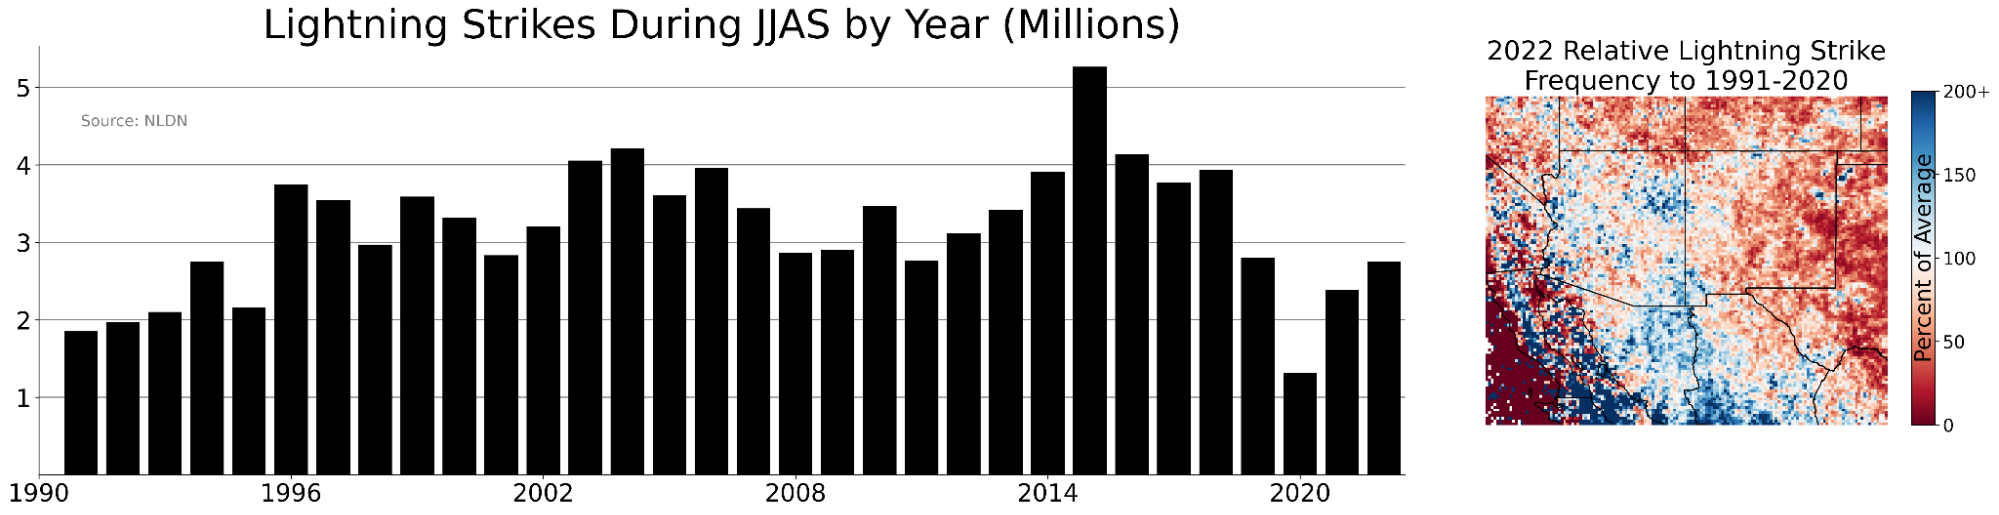
Over 2.7M cloud-to-ground lightning strikes were measured broadly across the Southwest during Jun-Sep 2022 (Figure 9). This was a bit below the long-term average of 3.2M strikes but within a typical range. Spatially, above average activity was noted across Sonora (Mex), areas near the northern Gulf of California, and portions of Arizona, with below average activity in much of New Mexico into west Texas.
Fig. 9. (Left) Total cloud-to-ground (CG) lightning strikes across the broader region during Jun-Sep by year.
(Right) Regional map of the relative CG frequency for June 2022 through September 2022,
with red (blue) areas observing less (more) lightning activity than usual. Data source: NLDN.
|
Focus: The North American Monsoon
During the summer months, high pressure in the mid-levels of the atmosphere over northern Mexico (often referred to as the “monsoon high”) strengthens, expands, and drifts northward. This causes a reversal in the weather pattern across the region, with storms moving from generally the west-to-east in the spring months to east-to-west in the summer. This monsoonal flow in turn causes a significant increase in atmospheric moisture levels across the typically parched desert region as tropical air moves northward. Combined with the heat of the summer, conditions become favorable for intermittent periods of showers and thunderstorms.
Fig. A1. Animation showing the typical gradual development, northward migration, and ultimate demise of the “monsoon high” through the summer. The black contours and red/blue colorfill represent the height (in meters) of the 500 mb pressure level, representing the vertical middle of the atmosphere. The cool/blue (warm/red) colors in the north (south) represent lower (higher) density air; temperature is directly proportional to pressure, thus blue (red) colors are associated with cool (warm) air. The blue/magenta/cyan lines represent precipitable water values (PWAT, the amount of water vapor in the atmosphere if condensed into liquid) of 1.0/1.5/2.0”. As the monsoon high builds, greater PWAT values move north. The inset trace is for Phoenix, AZ, showing the seasonal moisture trend. Data source: NCEP NARR.
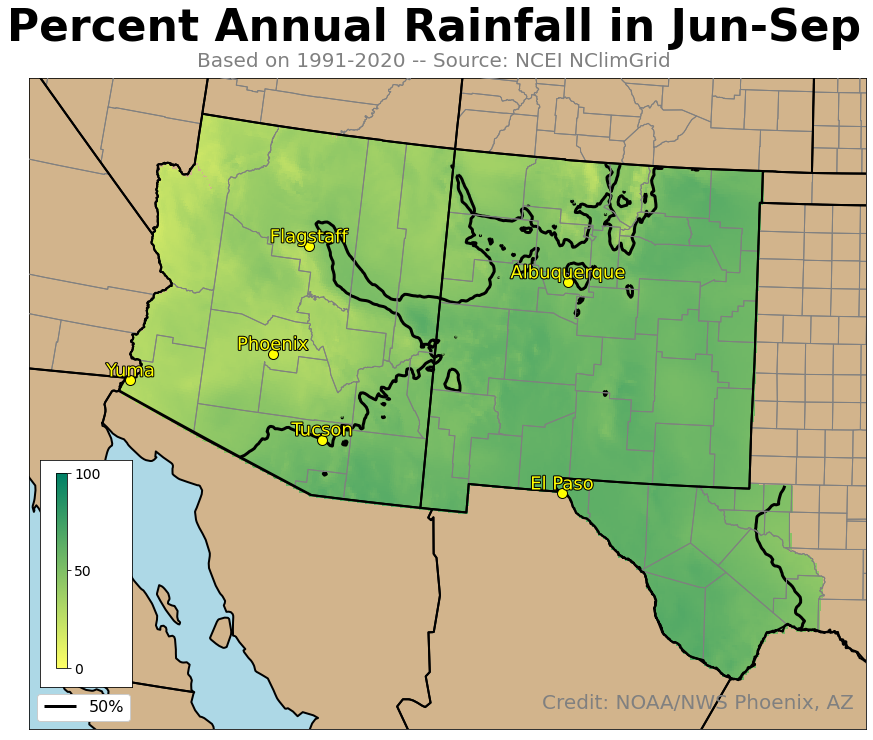
For the region as a whole, roughly 50% of annual precipitation falls during the June through September period (Figure A2). That amount varies significantly though, from less than 20% along the western Arizona border to almost 70% in the mountains of southern New Mexico and far west Texas. The increase in clouds, showers, and thunderstorms provide relief from the region’s relentless heat by blocking out sunshine and spreading rain-cooled air across the surface.
Fig. A2. The percent of annual rainfall which arrives during the core monsoon months of June through September. Typically the season’s rains are more notable across New Mexico and far southeast Arizona. Data source: NCEI NClimGrid. |
Factors Influencing the 2022 Monsoon
Monsoon Pattern
Showers and thunderstorms developed earlier than usual in the 2022 monsoon. By June 18, widespread precipitation became established and continued for much of the remainder of the season. The overall pattern featured substantial levels of moisture that arrived early and remained for much of the season along with a favorable position of the monsoon high typically centered further north (Figure 10).
Fig. 10. Animation showing the weather pattern during the 2022 monsoon. The black
contours and red/blue colorfill represent the height (in meters) of the 500 mb pressure
level, representing the middle (vertically) of the atmosphere. The blue/magenta/cyan
lines represent precipitable water values (PWAT, the amount of water vapor in the
atmosphere if condensed into liquid) of 1.0/1.5/2.0”. The inset PWAT trace is for
Phoenix, AZ. Data source: NCEP NARR.
Weak Steering Flow
A signature of the typical monsoon circulation is the overall weak winds in the middle and upper parts of the atmosphere due to the presence of and proximity of the center of the monsoon high. (See Focus: The North American Monsoon.)
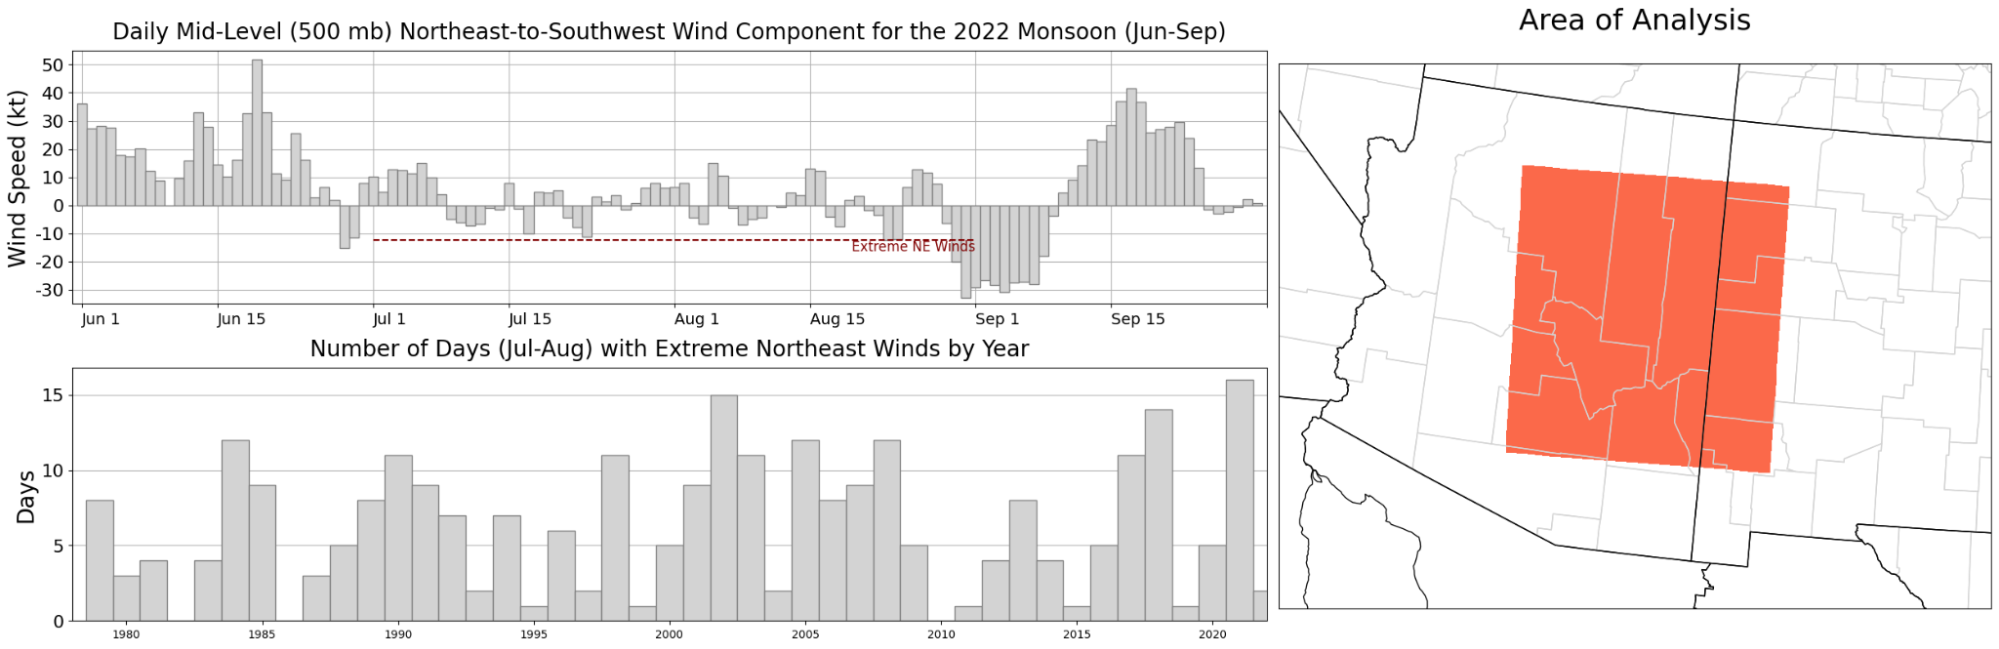
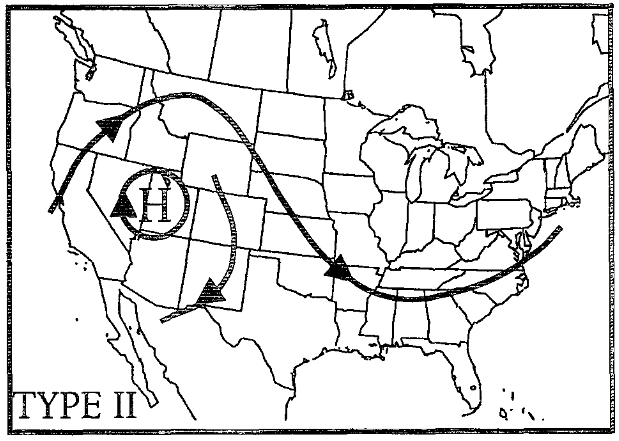
In 2022, winds in eastern Arizona/far western New Mexico were consistently weak during July and August (Figure 11). With little wind flow, thunderstorms are left to meander under their own influences thus, all things being equal, resulting in an increased frequency of localized heavy rainfall. Only in early September did strong northeast flow appear, which is one of the well known severe weather patterns Maddox Type II (Figure 12; Maddox et al. 1995, Mazon et al. 2016).
Fig. 11. (Top-left) Subregional daily average of northeast-to-southwest 500 mb
wind component (kt) for the 2022 monsoon (Jun-Sep). (Bottom-left) Number
of days, by year, that fell in the 10th percentile during the core monsoon
months of July-August. (Right) Sub-region used for midlevel flow analysis.
Data source: NCEP NARR.
Fig. 12. Streamline map (500 mb) for the Type II severe weather pattern across
central/southern Arizona (from Maddox et al. 1995).
Record Moisture Levels
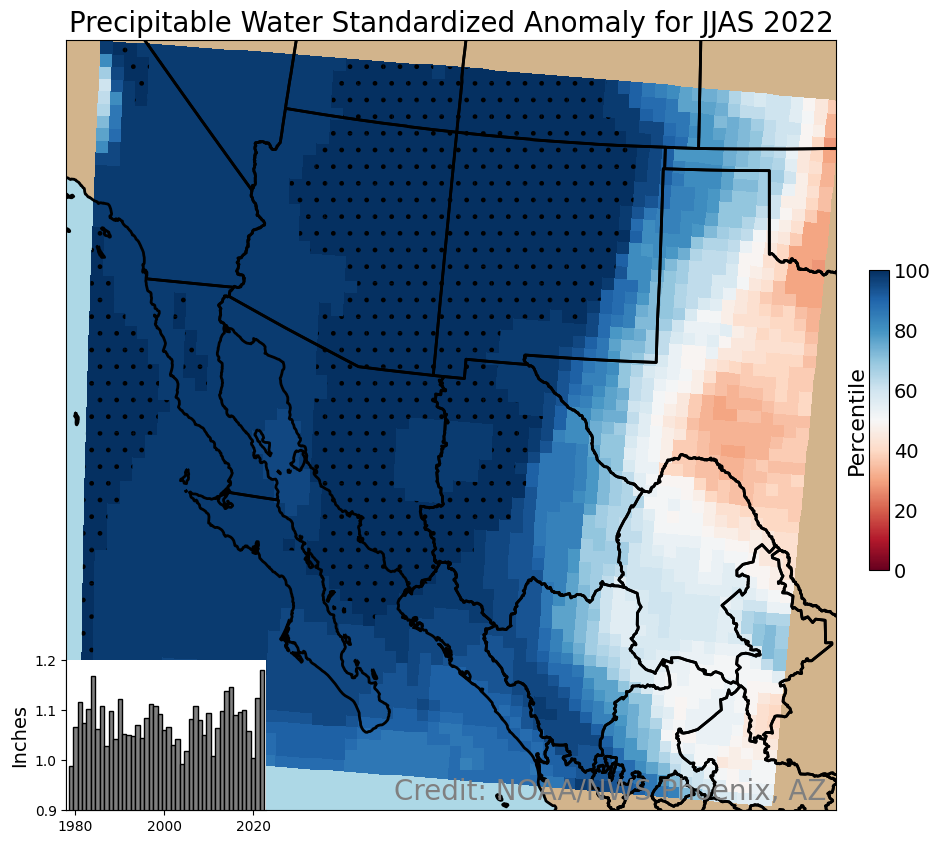
Atmospheric moisture levels, averaged June through September, were at record high levels for much of the region during the 2022 monsoon. Utilizing precipitable water, representing the depth of liquid water that would be obtained directly above a location if all the water vapor was condensed, nearly all of Arizona and New Mexico observed the highest values on record (since 1979; Figure 13). The entire region observed exceptionally high values.
Fig. 13. Seasonal (Jun-Sep average) precipitable water percentiles for the Southwest
in 2022. Dotted areas indicate record values (i.e. 100th percentile). Inset plot: average
precipitable water values across the domain by year. Data source: NARR.
Tropical Cyclone Activity
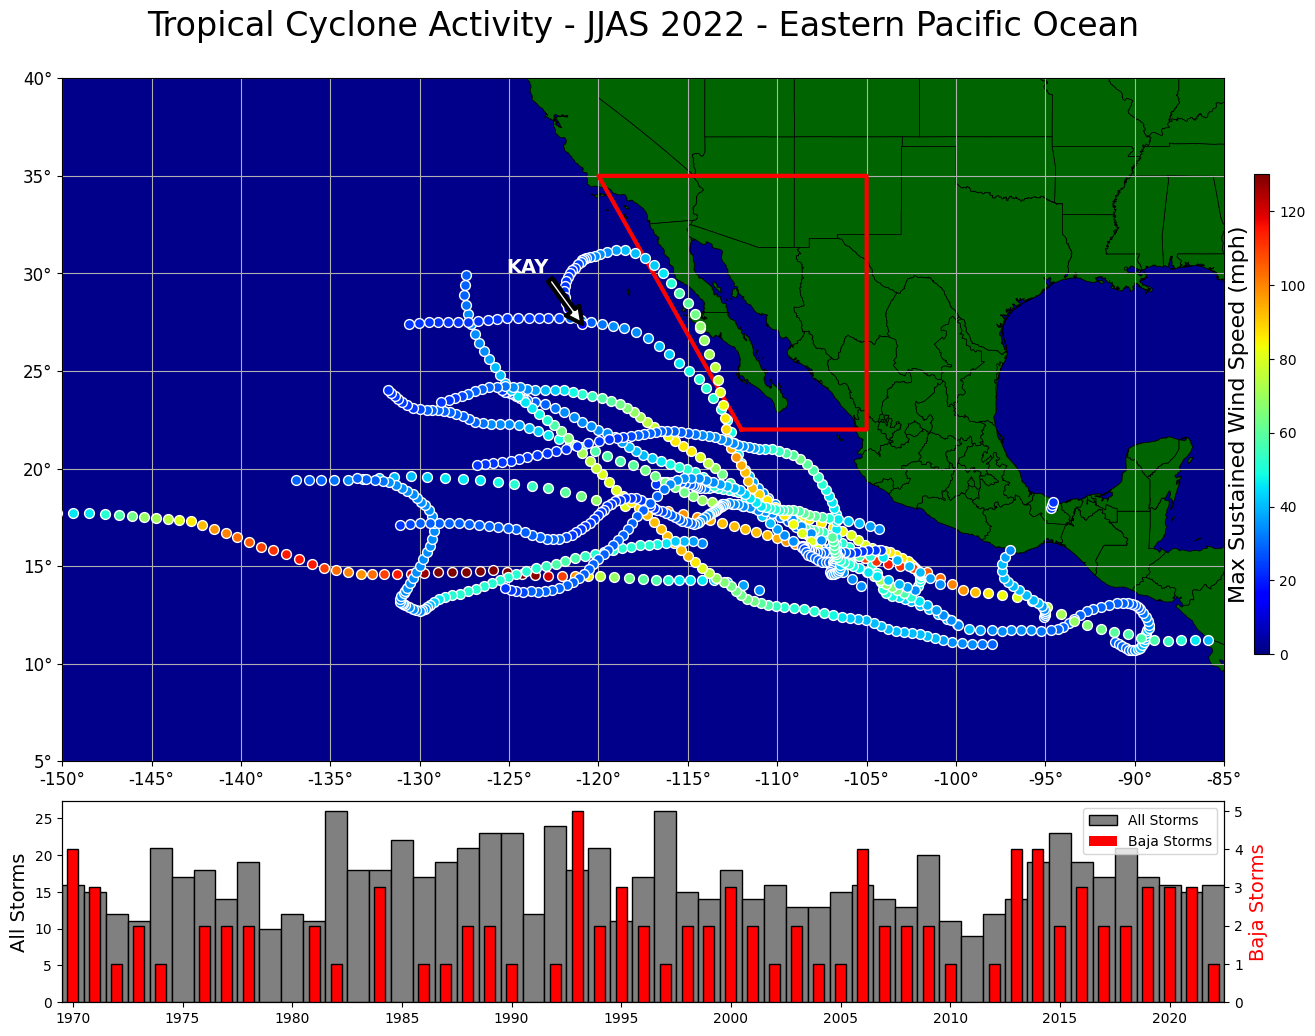
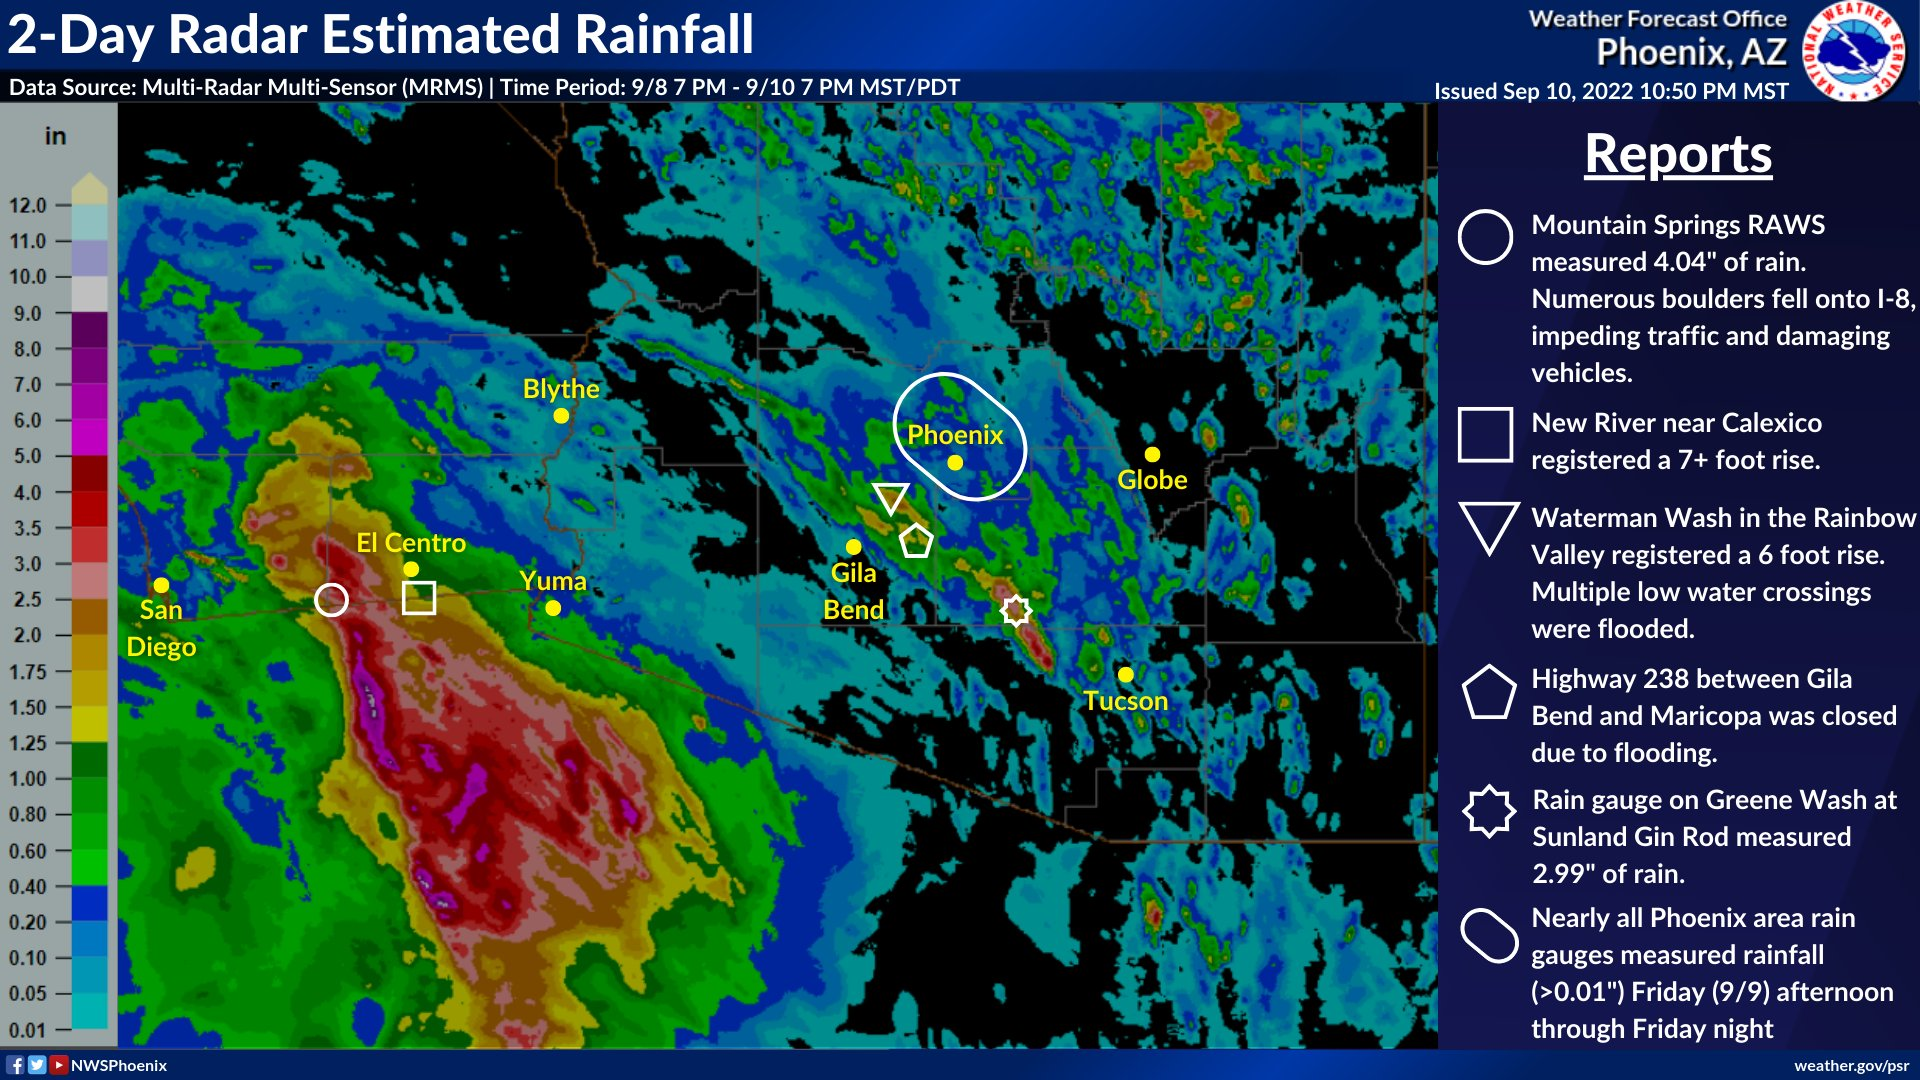
There were 16 tropical cyclones in the Eastern Pacific Ocean from June 2022 through September in 2022, which was comparable to the past ten years (Figure 14). However, only one storm tracked into the Baja California area, which has shown to increase precipitation across the region. Hurricane Kay brought heavy rains and strong winds to portions of southern California. Impacts included flooded roads and rock slides in Interstate 8 (Figure 15). Overall, tropical cyclone activity did not play a significant role in the very wet season.
Fig 14. (Top) Tropical cyclone track and intensity for the 2022 monsoon across the
East Pacific Ocean. Cyclones that enter the Baja California area (red box) have
potential to influence precipitation across the Southwest due to moisture influxes
and/or direct cyclonic activity. (Bottom) Historical plot of East Pacific Ocean
tropical cyclones (gray bars) and cyclones within the Baja California
area (red bars). Data source: HURDAT2.
Fig. 15. Estimated rainfall associated with Kay and notable observations and impacts. (Source)
NWS Services During the 2022 Monsoon
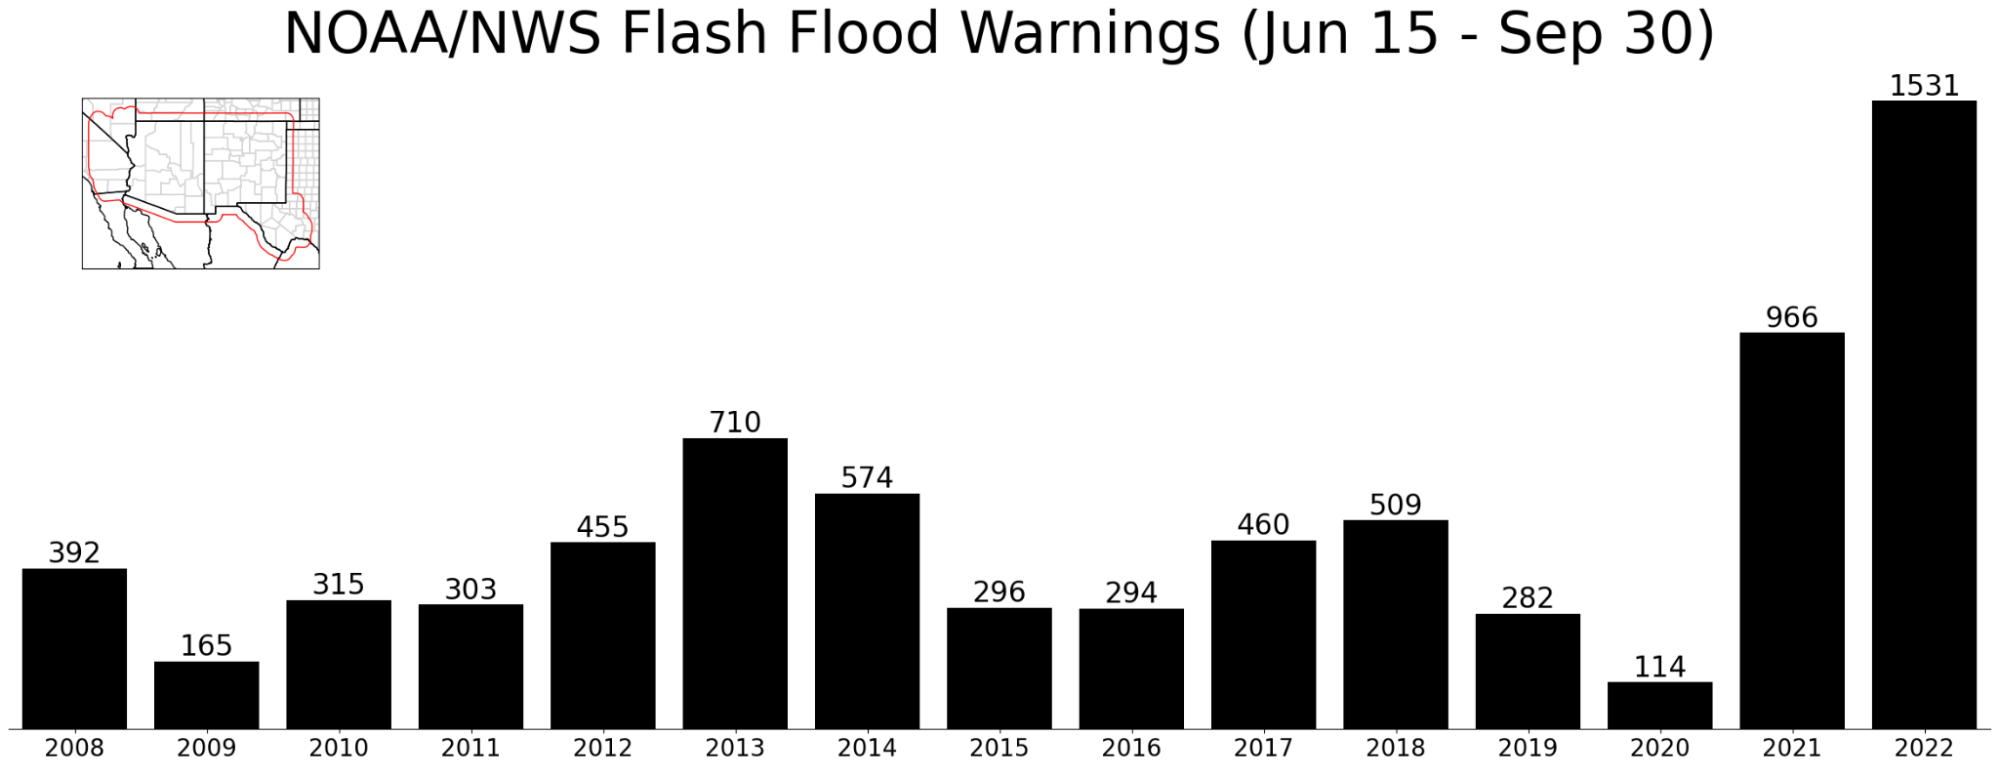
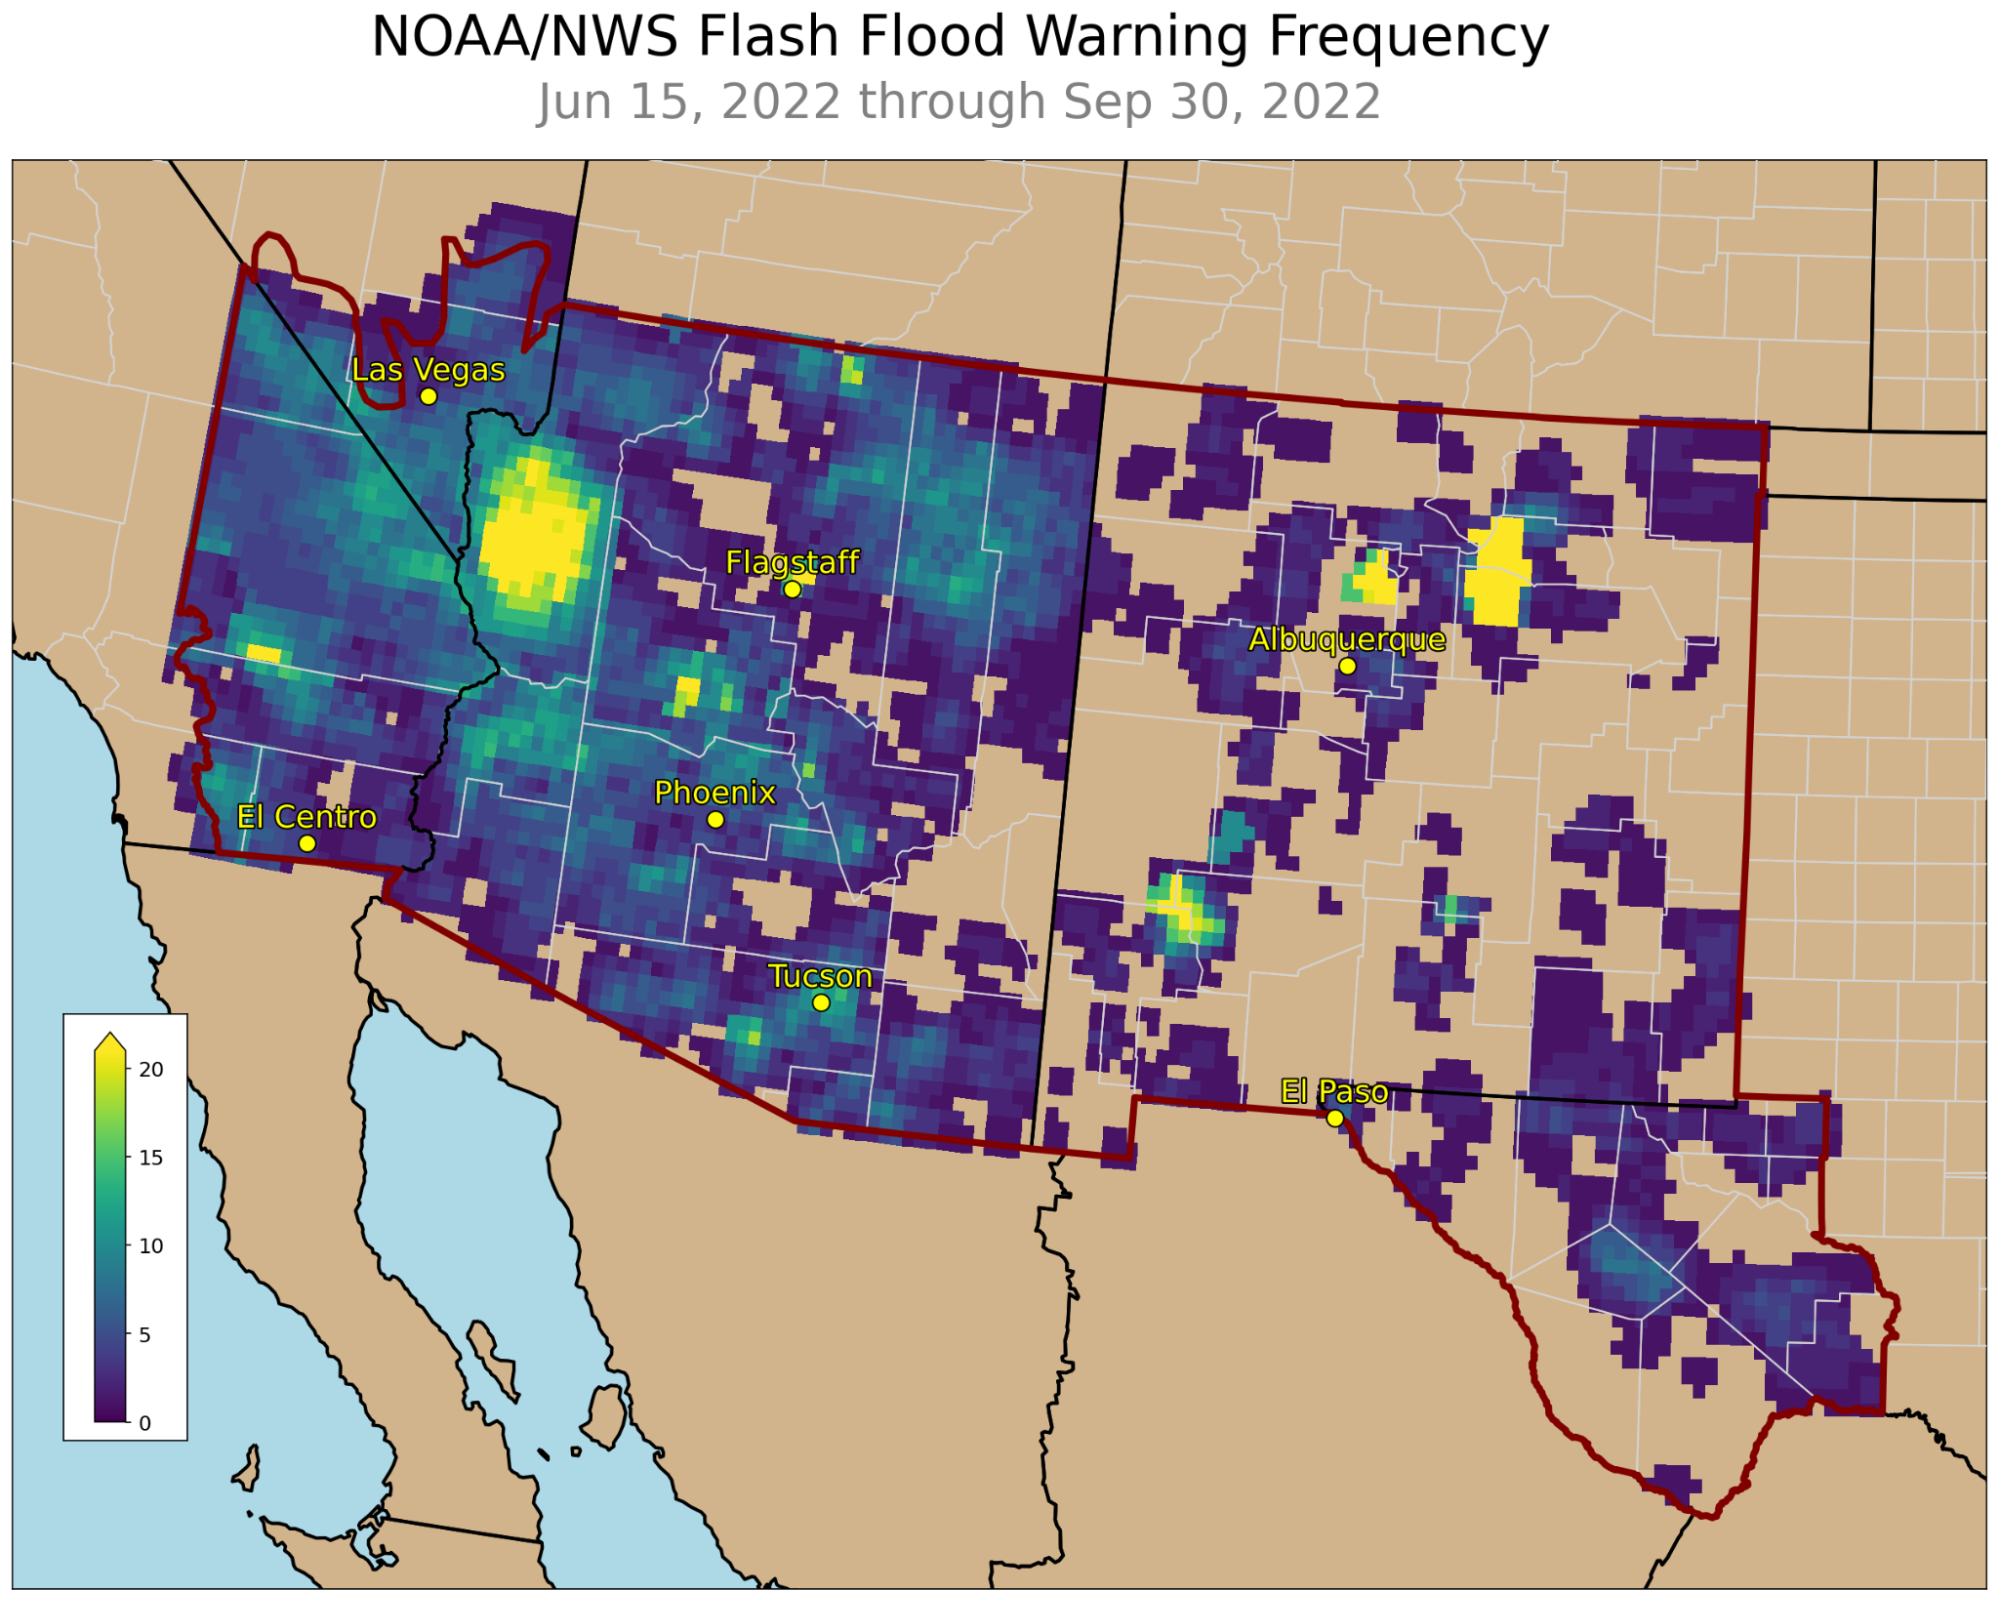
During the 2022 monsoon, local NWS offices issued over 1,500 Flash Flood Warnings across the Southwest, which was far and away the most during a single monsoon in recent records (Figure 16). A few notable hot spots for flooding in 2022 included burn scars in New Mexico and areas of Mohave County, AZ (Figure 17).
Fig. 16. Number of Flash Flood Warnings issued across the Southwest US by
local NWS offices during the monsoon, annually since 2008. (Since 2008, the NWS
has issued location specific “polygon-based” warnings.)
Fig. 17. Areal frequency of Flash Flood Warnings across the Southwest during the 2022 monsoon.
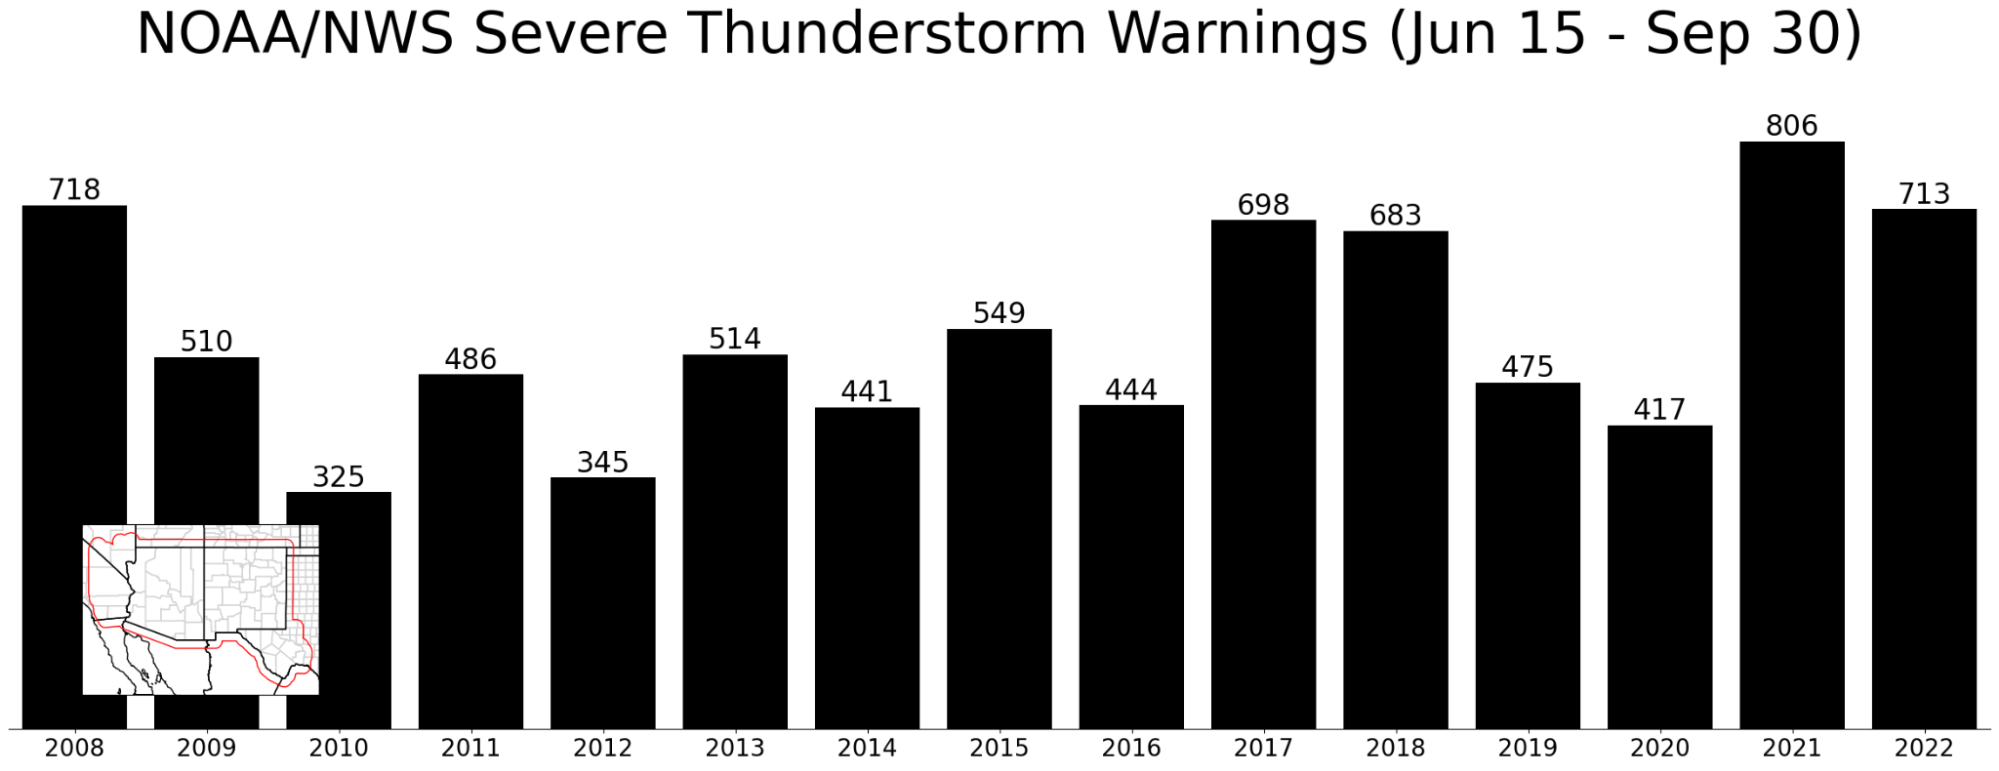
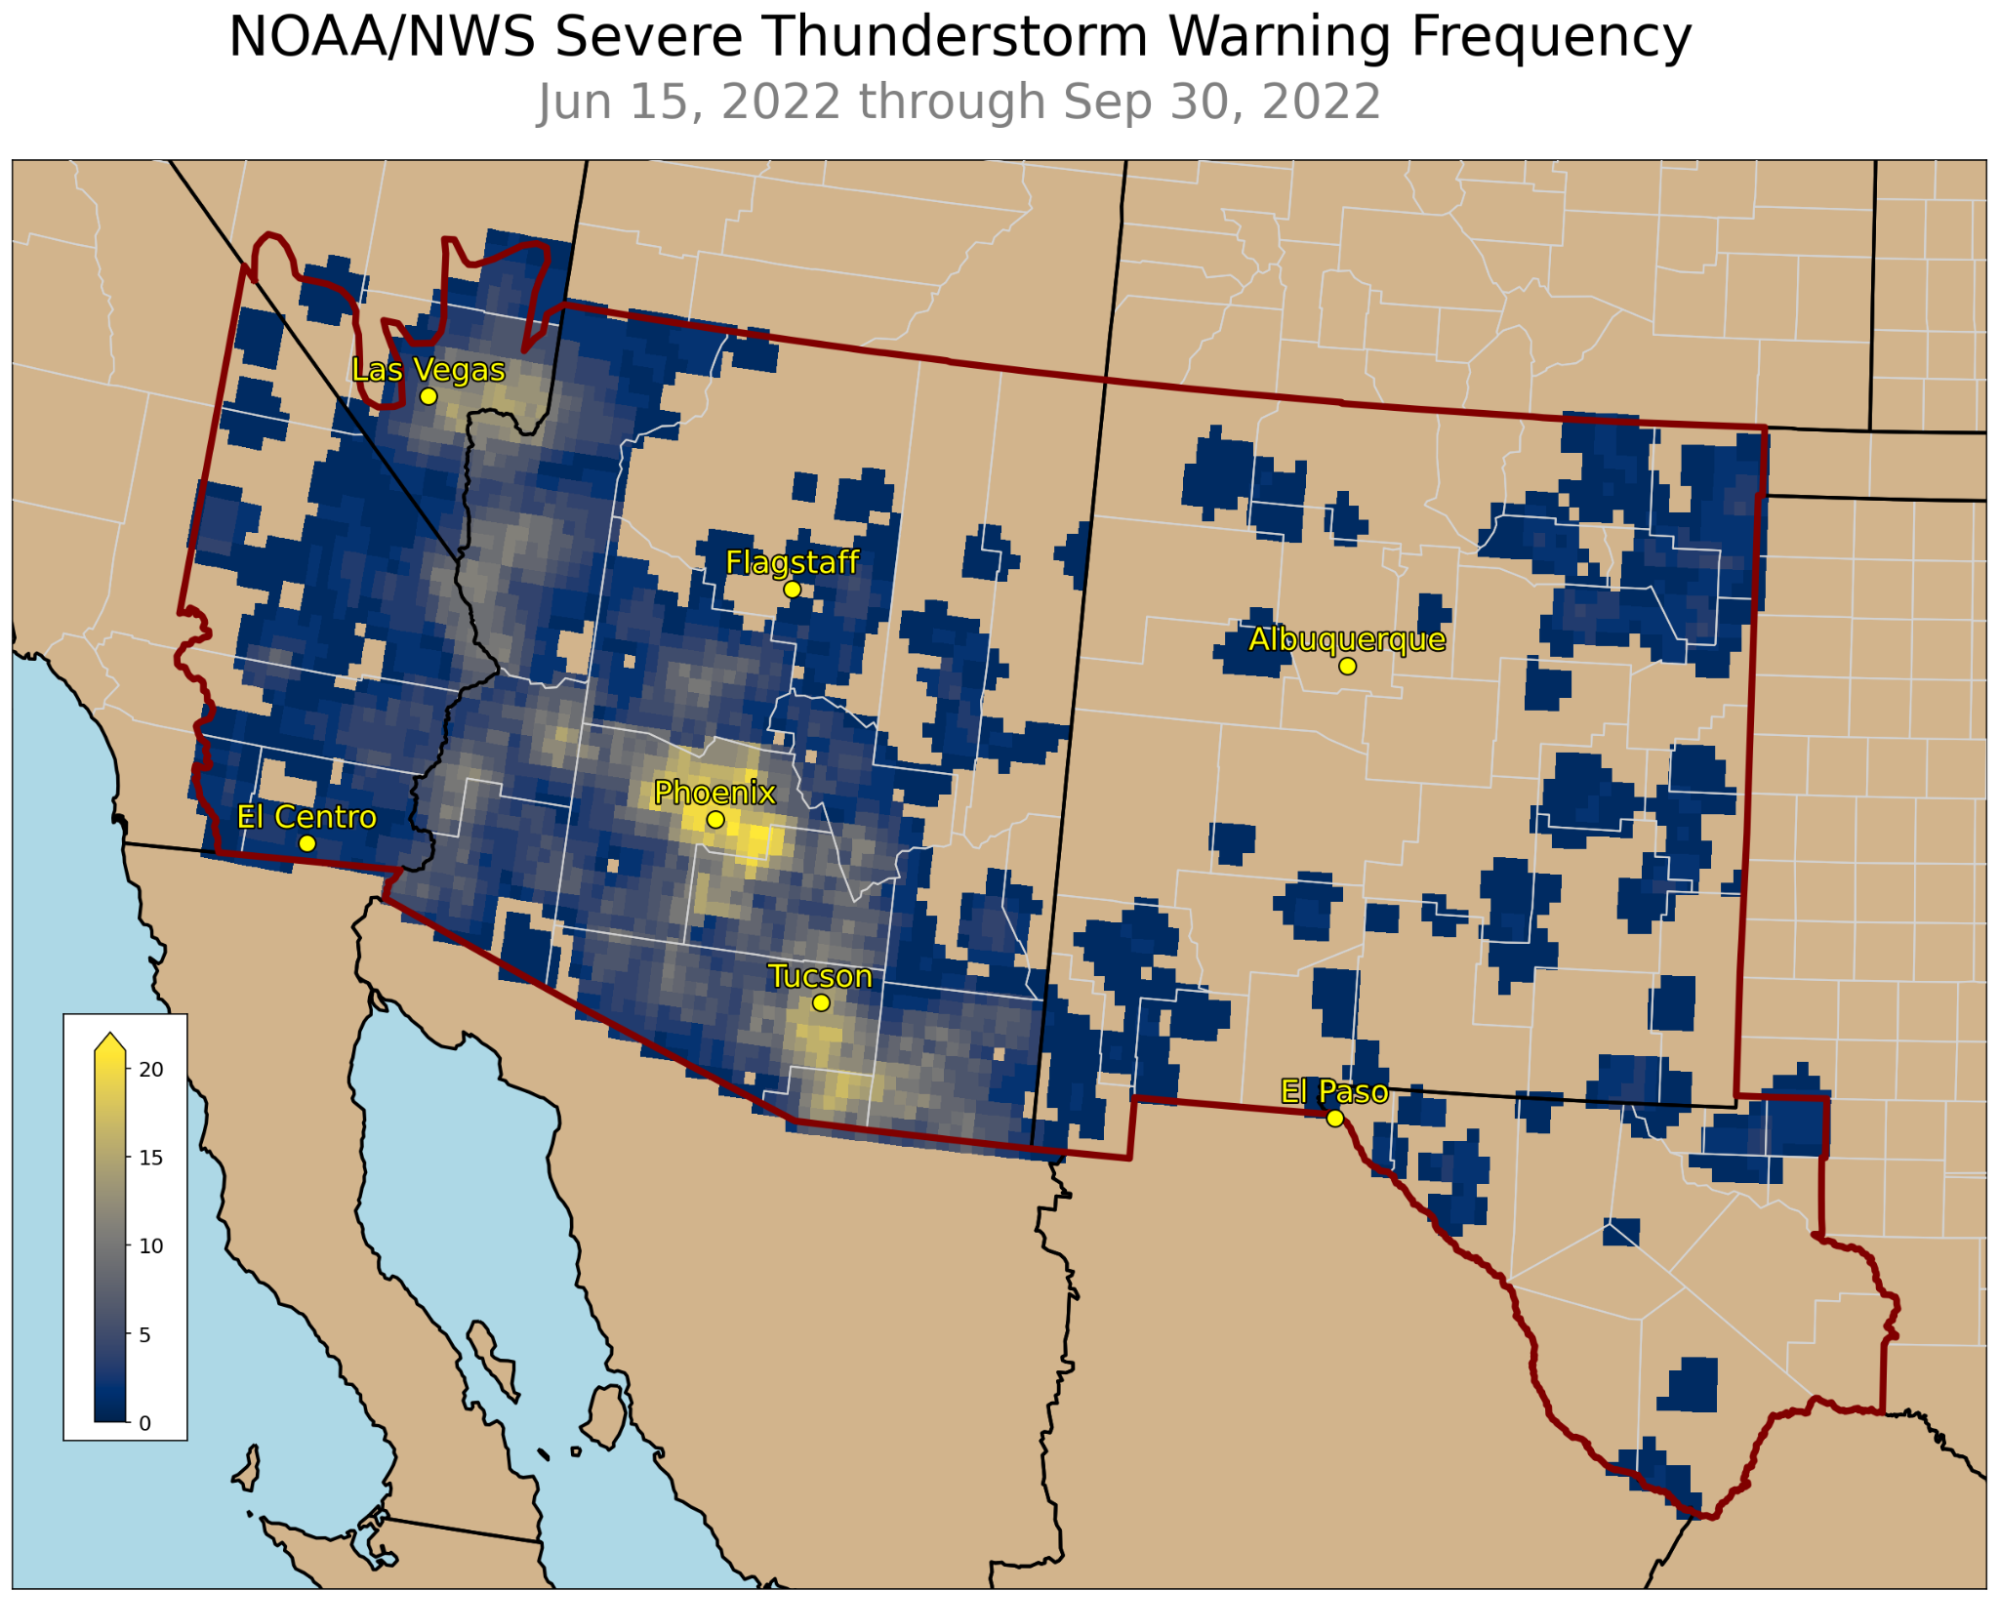
Over 700 Severe Thunderstorm Warnings were issued by local NWS offices during the 2022 monsoon, which was the third greatest in recent records (Figure 18). Areas with higher levels of warning activity included locations east/south of major elevation changes, which generally coincide with the major metropolitan areas of Las Vegas, Phoenix, and Tucson (Figure 19). These locations are favored as storms form over the mountains then drift with the typical northeast-to-southwest wind into lower elevations.
Fig. 18. Number of Severe Thunderstorm Warnings issued across the Southwest US
by local NWS offices during the monsoon, annually since 2008. (Since 2008, the NWS
has issued location specific “polygon-based” warnings.)
Fig. 19. Areal frequency of Severe Thunderstorm Warnings across the Southwest during the 2022 monsoon.