A strong low pressure system that originated south of Alaska slowly made its way southward and eventually into southeast California and Arizona during the day of Friday 15 May 2015. Showers made their way into southeast California around daybreak on Friday and eventually spread into Yuma and Phoenix during the late morning/early afternoon hours. Several "waves" of rainfall accompanied this storm, with the final wave tipping the scales and pushing Yuma and Phoenix into record territory.
 |
 |
|
Infrared Satellite imagery from approx 11am 15 May - 7am 16 May, showing the evolution of the storm as it moved through southeast California and into Arizona. Note the final "wave" that strengthened as it moved into central Arizona around 03Z (8pm). *Note: Loop approx 22mb |
Regional radar imagery from approx 11am 15 May - 7am 16 May. The first round of precipitation moved through the Phoenix area around 11am, followed by another round around 230pm, and the final round in the evening around 9pm. Yuma also saw several periods of rainfall during the late morning/afternoon hours. *Note: Loop approx 25mb |
 |
 |
|
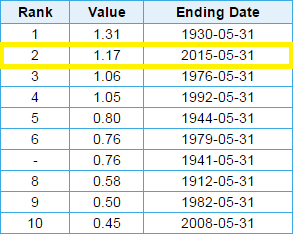
Phoenix monthly precip total (1.17") ranks #2 through 15 May 2015 |
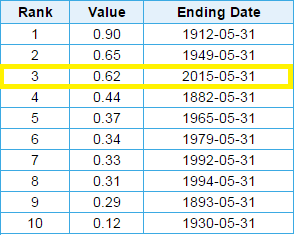
Yuma monthly precip total (0.62") ranks #3 through 15 May 2015 |
While it's not uncommon for strong storm systems to affect the southwestern United States during the month of May, the amount of moisture that accompanied this storm was unusually high. Each day, weather balloons are launched to ascertain the state of the atmosphere, which also includes measurements of how much moisture is in place at a given location. This measurement of the total atmospheric water vapor contained from the surface to the top of the troposphere is referred to as "precipitable water".
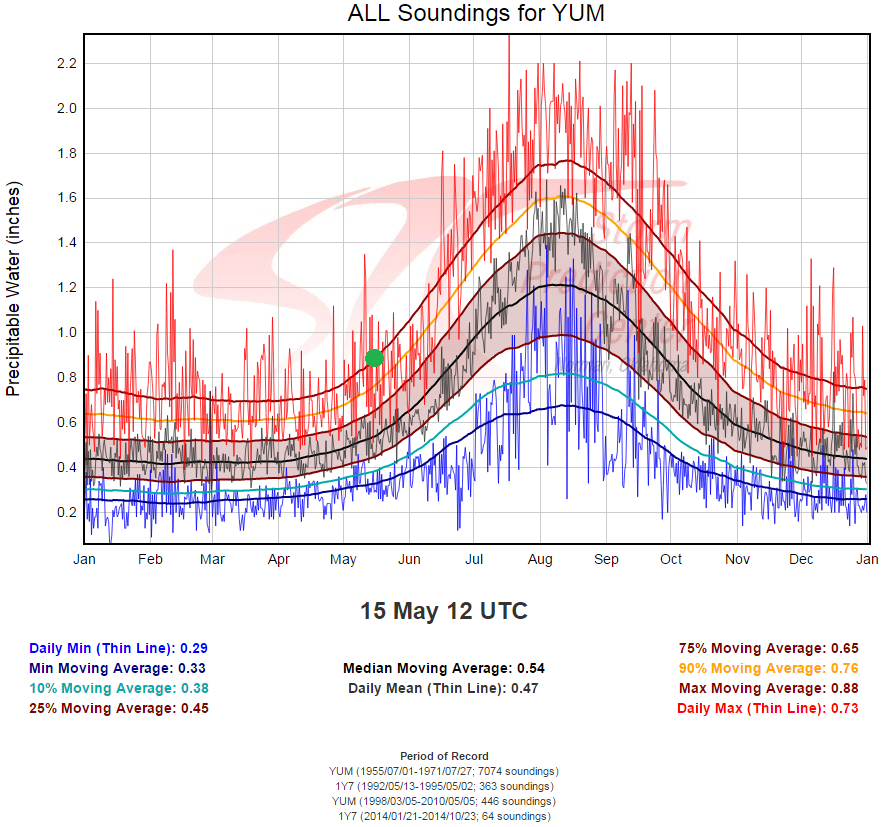
A weather balloon launched from Yuma late Friday morning (18Z) indicated nearly twice as much atmospheric moisture as one would typically expect for mid May. The precipitable water value of 0.89" (indicated in green on the chart) is well within the 99th percentile of all observed soundings at Yuma. For context, the amount of moisture in place across the area on Friday would be on par with a typical day in early July. While abundant moisture isn't the only factor necessary for rainfall, the elevated precipitable water values shown above certainly played a role.

