October 9-13, 2025: Flooding and Severe Storms from Remnants of Tropical Cyclones Priscilla and Raymond
Fig. 1: GOES-19 Water Vapor Satellite Imagery between 9 AM MST Oct 8th and 11 PM MST Oct 13th, 2025 showing the moisture remnants from Tropical Cyclones Priscilla and Raymond getting pulled northward into the Desert Southwest
Overview: From October 9-13, 2025, the Desert Southwest experienced multiple rounds of showers and thunderstorms. This was due to a nearly stationary large-scale low-pressure system off the west coast combining with moisture from the remnants of Tropical Cyclones Priscilla and Raymond, which originated off Mexico's southwest coast (Figure 1). Central and southern Arizona received the highest rainfall accumulations, leading to numerous flash flooding incidents. These included areas previously affected by catastrophic flooding in late September from a different storm system. On October 13, towards the end of this prolonged event, severe weather developed across parts of the Phoenix area, bringing damaging winds and large hail, and additional flash flooding in the higher terrain east of Phoenix.
Flash Flooding: Late on October 8 through all day on October 9, very anomalous moisture from Tropical Cyclone Priscilla rapidly surged northward. Precipitable Water (PWAT), a measure of the amount of atmospheric water vapor in a vertical column of air, rose to over 1.5”+, which is about 250-300% of normal and all-time record for the first week of October (Figure 2). These moisture values even during the middle of the Monsoon Season are above normal. As Priscilla's remnants tracked northward, light to moderate rainfall developed across the area. The most widespread activity occurred from the afternoon of October 10th into the early afternoon of October 11th (Figure 3). Since rain rates were generally below 0.5 inches per hour for most of this period, the flood risk was low. However, this extended rainfall saturated the soils, setting the stage for the heavy rain that followed hours later.
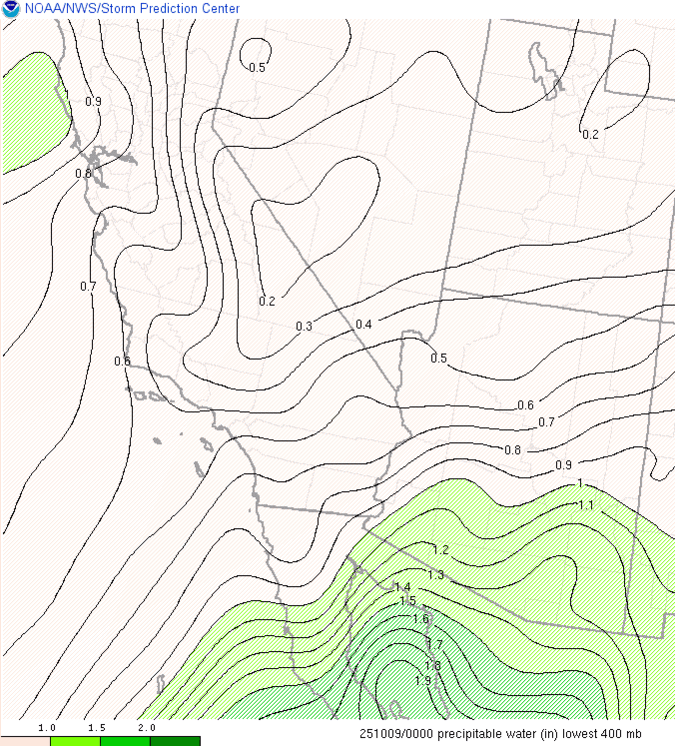
Fig. 2: Animation Loop of the Precipitable water values between 5 PM MST Oct 8th and 5 PM MST Oct 13th, 2025
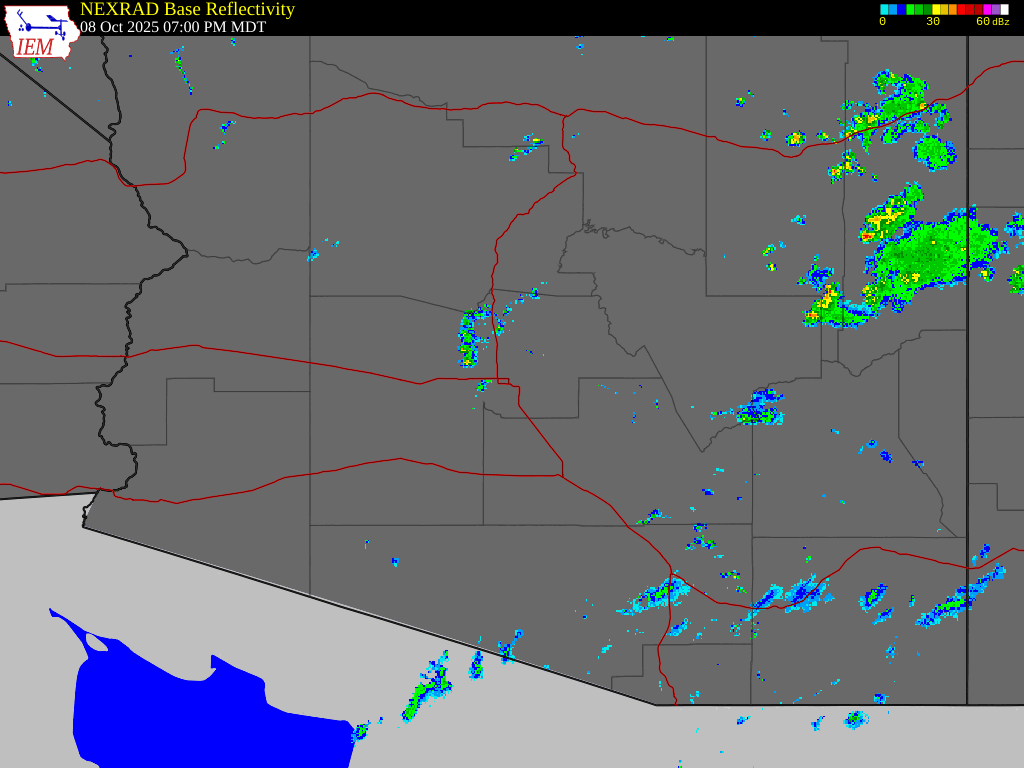
Fig. 3: Radar reflectivity loop between 7 PM MDT Oct 8th and 4 PM MDT Oct 11th, 2025
The moisture remnants from Tropical Cyclone Raymond combined with strong upper-level ascent from the low pressure system situated off the west coast triggered scattered thunderstorms across much of south-central AZ by the pre-dawn hours on October 12th. Activity initially developed over the Phoenix metro before gradually spreading south and east over time (Figure 4). The increased instability with MLCAPE values approaching 1000 J/KG supported high rainfall rates, with rates exceeding 1-2”+ an hour (Figure 5). High rainfall rates falling on top of already saturated soils resulted in flash flooding. The forecast office received reports of several water rescues, street and highway closures, and overflowing washes making low-water crossings impassable (Figure 6-7). Unfortunately, a fatality was reported along Waterman Wash, located south of Buckeye. The driver of a vehicle drowned as the vehicle was washed away by the floodwaters in the wash. Search and rescue operations found the body of the driver the following day. The Globe/Miami area, recently impacted by severe flooding in late September, experienced significant flash flooding again. Considerable flow through the different washes and creeks inundated low-water crossings and adjacent streets and nearly overtopped bridges (Figure 8-9). Approximately 15 homes in Queen Valley, 40 miles east of Phoenix, were reported inundated by emergency management. On October 13th, additional shower and thunderstorm activity developed in the afternoon, affecting the Phoenix metro and areas to the east. Similar to the previous day, flash flooding occurred across southern Gila County, including the Globe/Miami area. A water rescue was conducted in Apache Junction along Weekes Wash, an area that is known to be particularly susceptible to flash flooding during heavy rainfall events. NWS Phoenix issued a total of 25 Flash Flood Warnings throughout the event, concentrated between the 12th and 13th. There were also a total of 16 Flood Warnings issued during the same time span for areas that experienced flooding impacts for an extended period of time (Figure 10).
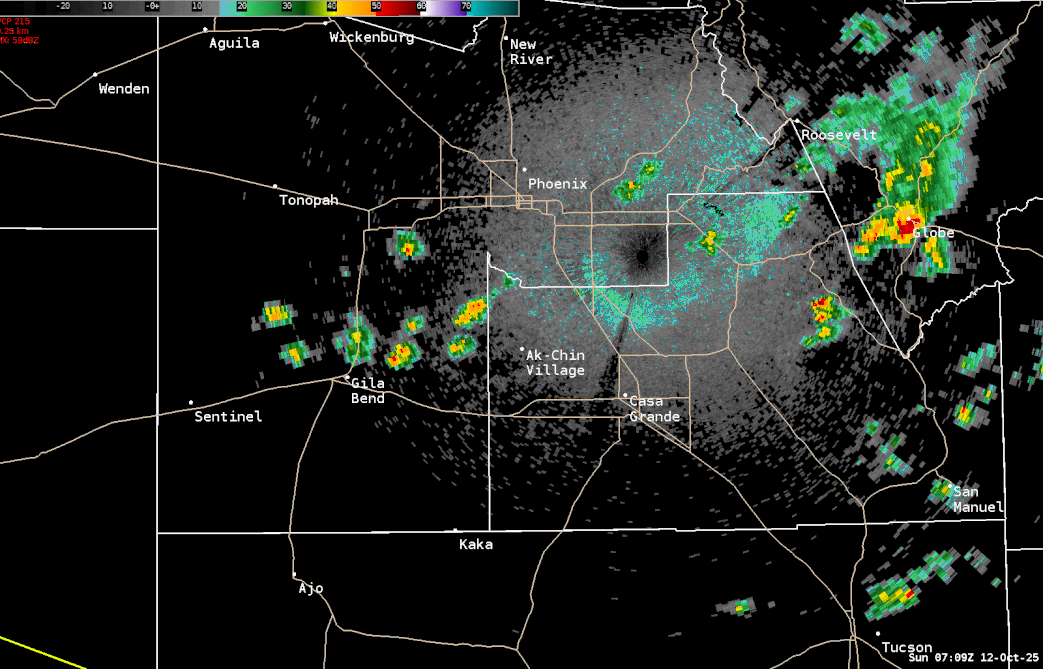
Fig. 4: Reflectivity loop from 12:09 PM to 4:59 PM MST on Oct 12th, 2025 from the KIWA (Phoenix, AZ) radar
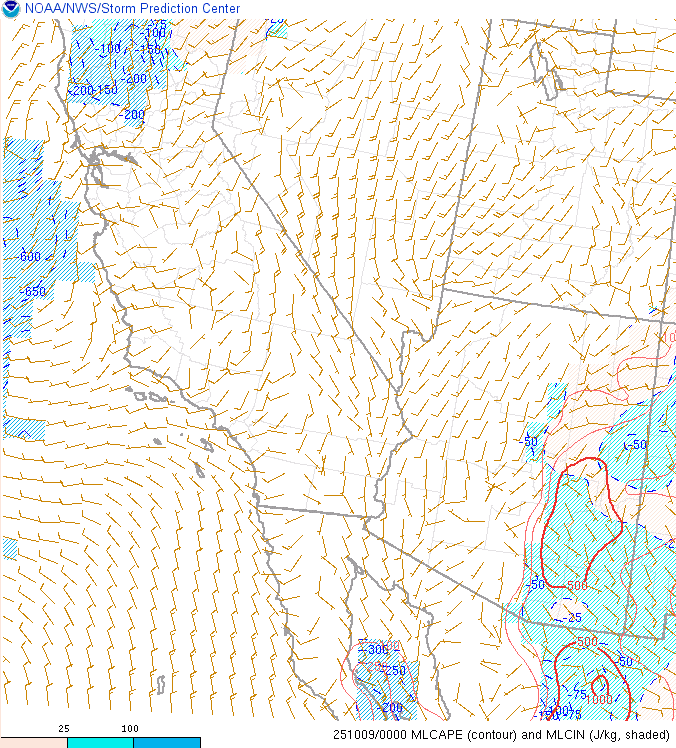
Fig. 5: Animation loop of the Mixed Layer Convective Available Potential Energy (MLCAPE) AND Mixed Layer Convective Inhibition (MLCIN) between 5 PM MST Oct 8th and 5 PM MST Oct 13th, 2025
 |
 |
Fig. 6-7: Images of the flooding in south-central AZ on Oct 12th, 2025. Left image: Flooding along Loop-202 near Cooper Road in Gilbert, requiring this stretch to close (ADOT); Right image: Image of water flowing along SR-238 just east of Gila Bend (Brian Emfingeron on Facebook).
 |
 |
Fig. 8-9: Images of the flooding in the Globe/Miami area on Oct 12th, 2025: Left image: Considerable flow along Bloody Tanks Wash in Miami, AZ with water overtopping the bridge (Joanna Lee TwentyThree on Facebook); Right image: Image of raging water flow along Russell Gulch near the Apache Bowhunters Archery Range near Globe, AZ (Charlene Becker on Facebook).
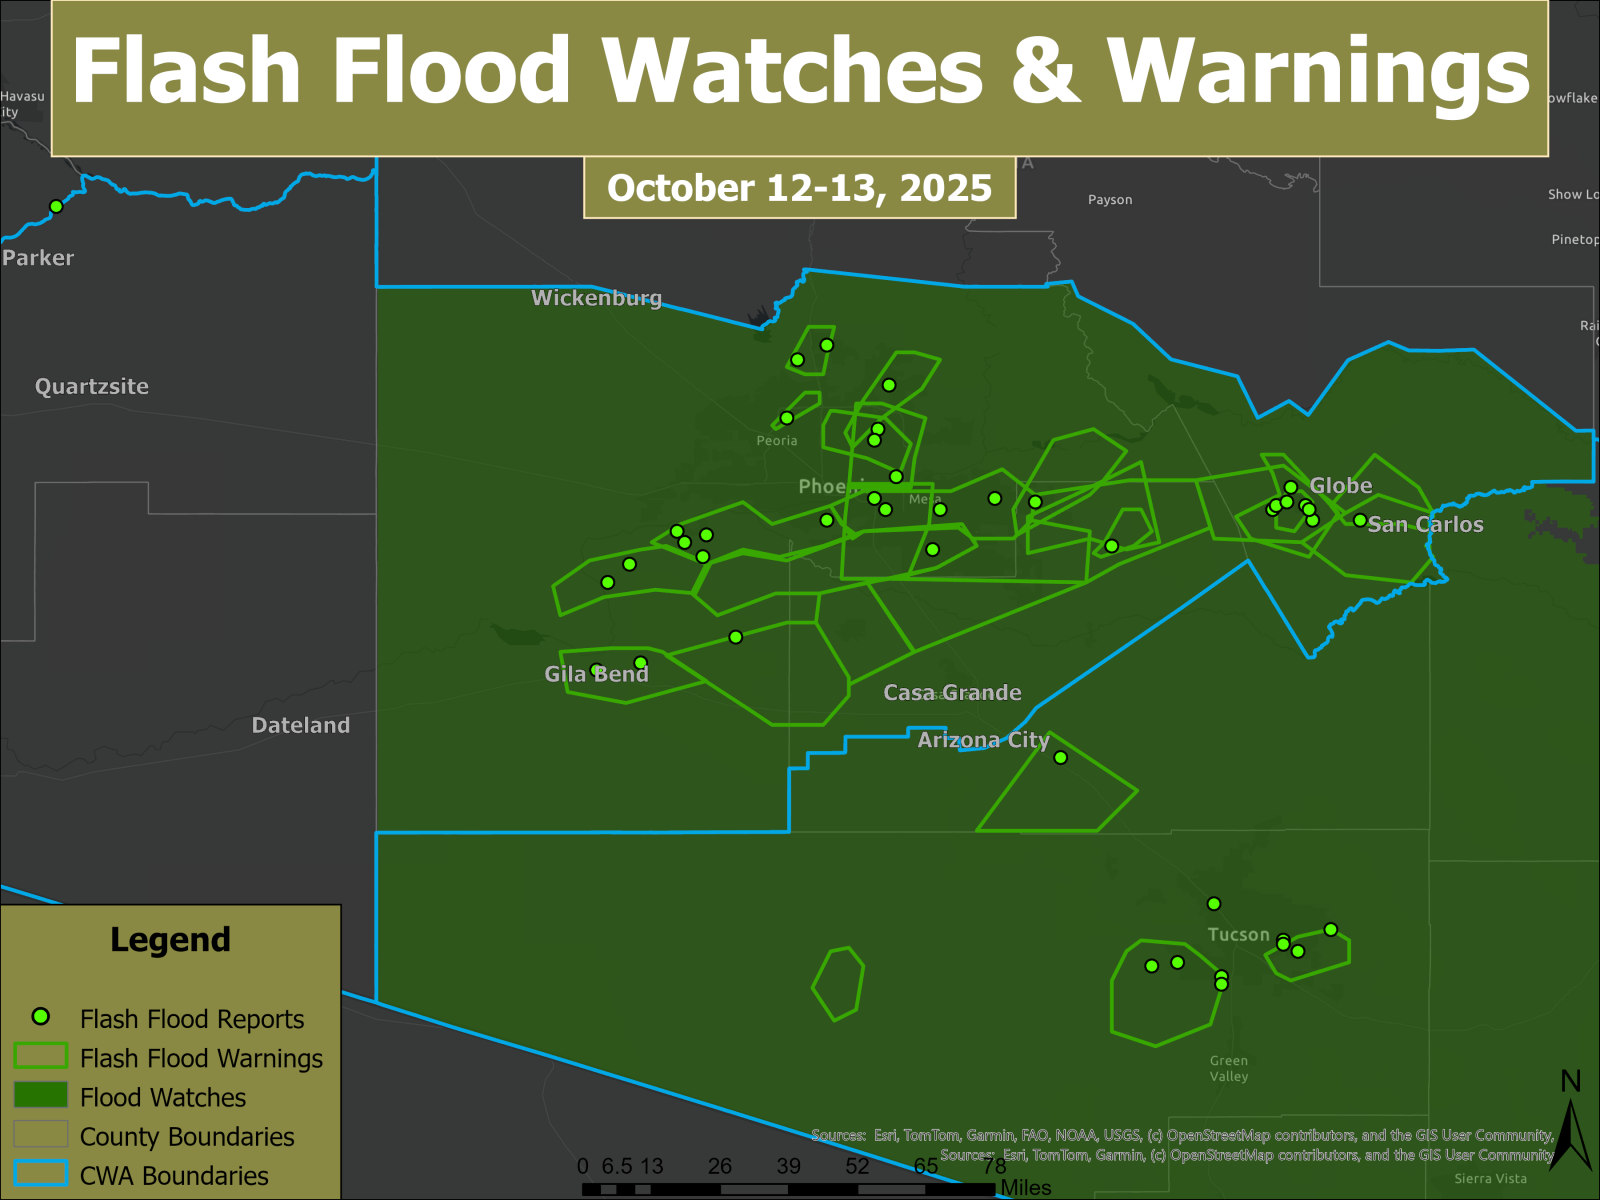
Fig. 10: Spatial extent of the Flood Watches and Flash Flood Warnings issued by the NWS Offices in Phoenix and Tucson between Oct. 12th and 13th, with locations of flash flood reports indicated with green dots.
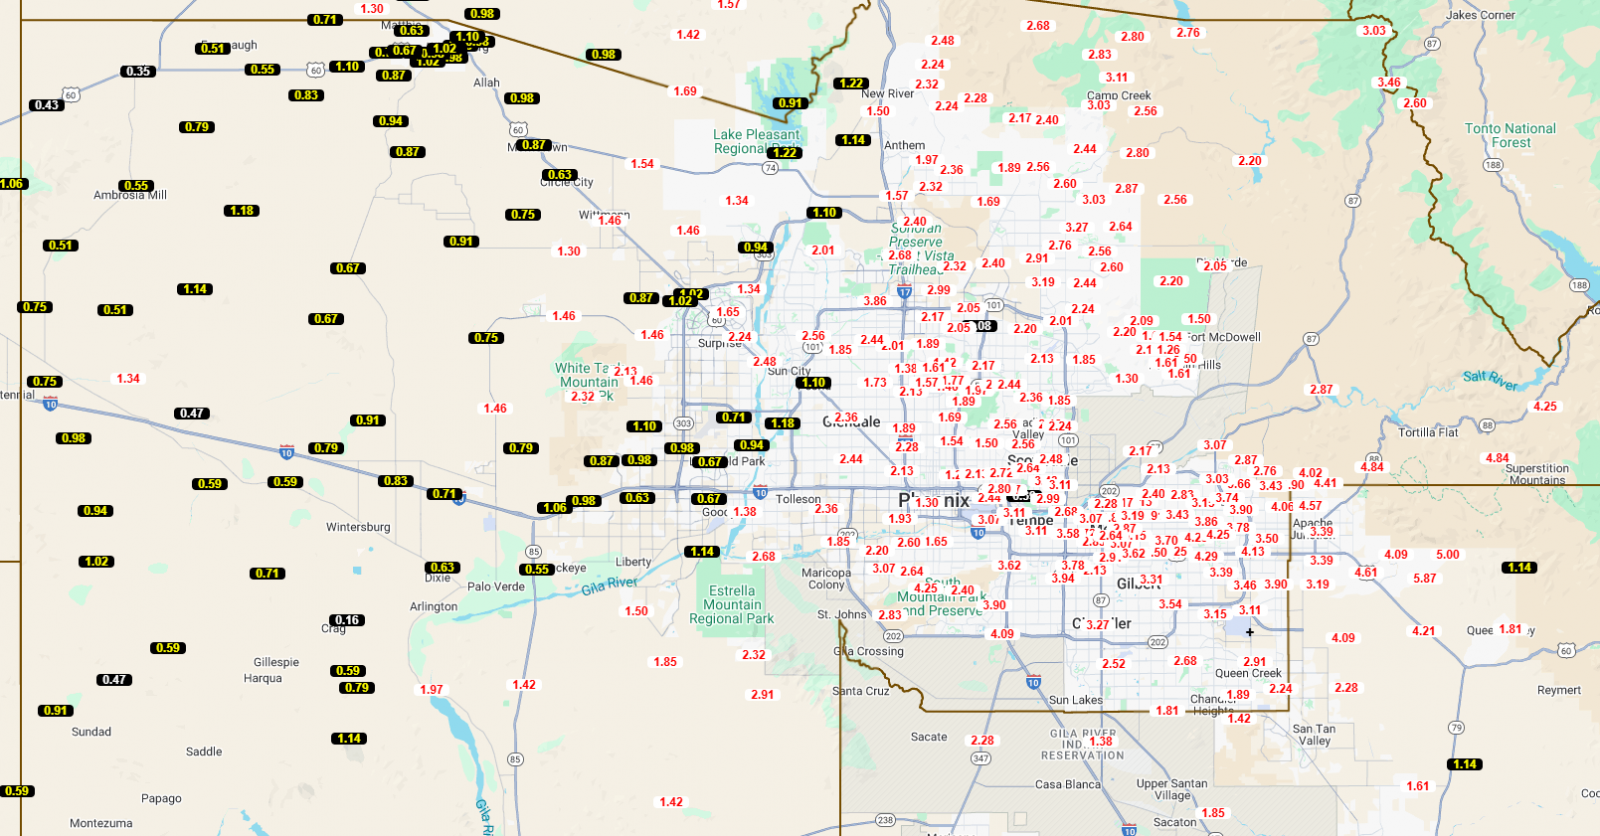
By the end of the multi-day event, rainfall totals ranged between 1.00-1.50” across the Phoenix West Valley to as high as 3.50-4.50” across the Phoenix East Valley, with locations across the foothills and higher terrain areas observing total amounts of 2.50-6.00” (Figure 11-12). At Phoenix Sky Harbor Airport, a total of 3.26” was measured, which makes October 2025 as the third wettest October on record and helped push the average annual precipitation total to above normal. In addition, there were 5 consecutive days with at least 0.10”, which ties the record previously set in 1905 and 1916 for the most consecutive days with at least 0.10” of rainfall.
 |
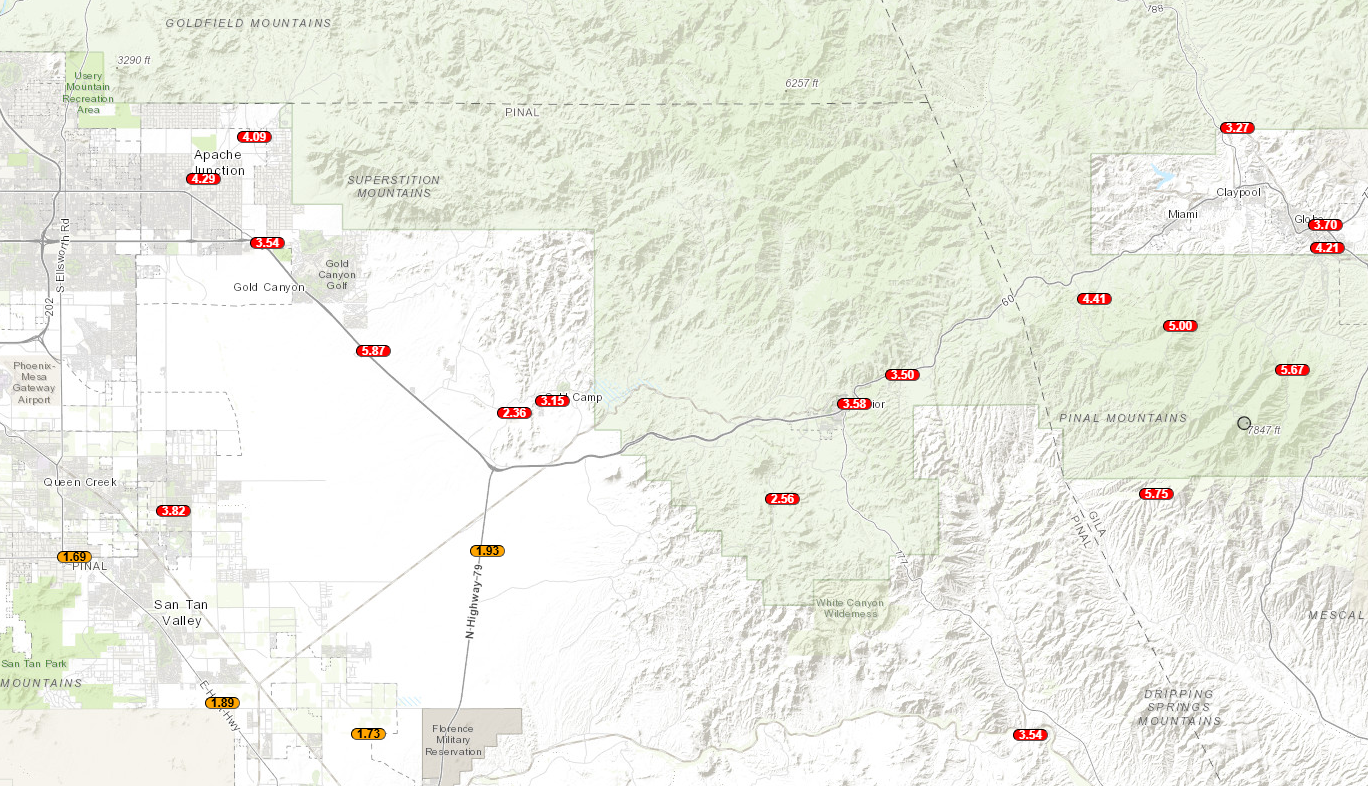 |
Fig. 11-12: (Top Image) Rainfall totals from Oct. 8th to Oct. 13th courtesy of Flood Control District of Maricopa County; (Bottom Image) Rainfall totals from Oct. 8th to Oct. 13th courtesy of the JE Fuller Alert Network (Click on images for better resolution)
Severe Weather: While severe weather in the region was initially subdued due to abundant cloud cover limiting the instability, the afternoon of October 13th saw a significant change. Scattered strong to severe thunderstorms developed, impacting portions of the Phoenix metropolitan area (Figure 13). This shift was driven by a combination of daytime heating and abundant low-level moisture, leading to MLCAPE values peaking at 1000 J/KG (Figure 5). Additionally, very strong 0-6 km shear values, close to 50 kts, were observed, creating a highly favorable environment for the formation of organized thunderstorm clusters, or supercells (Figure 14). Around 1 PM MST, a supercell thunderstorm tracked from south to north, affecting the Chandler, Tempe, and Scottsdale areas (Figures 15-16). Tempe was the hardest hit, with numerous reports of extensive wind damage along an approximately 2-2.5 mile wide north-south corridor (just east of I-10). Reports ranged from large, mature trees uprooted or snapped, some of which damaged buildings and vehicles, to downed power lines, and roofs blown off buildings. A damage survey conducted by NWS Phoenix Meteorologists in the most affected areas of Tempe supported wind gusts peaking around 80-90 mph with this supercell (Figure 17). Beyond the damaging winds, the same storm produced quarter-sized hail further north, and a different storm later in the afternoon generated 2-inch diameter hail near Apache Junction, as reported by a trained NWS storm spotter. NWS Phoenix issued a total of 9 Severe Thunderstorm Warnings, with 8 of them issued on the 13th and 1 on the 12th (Figure 18).
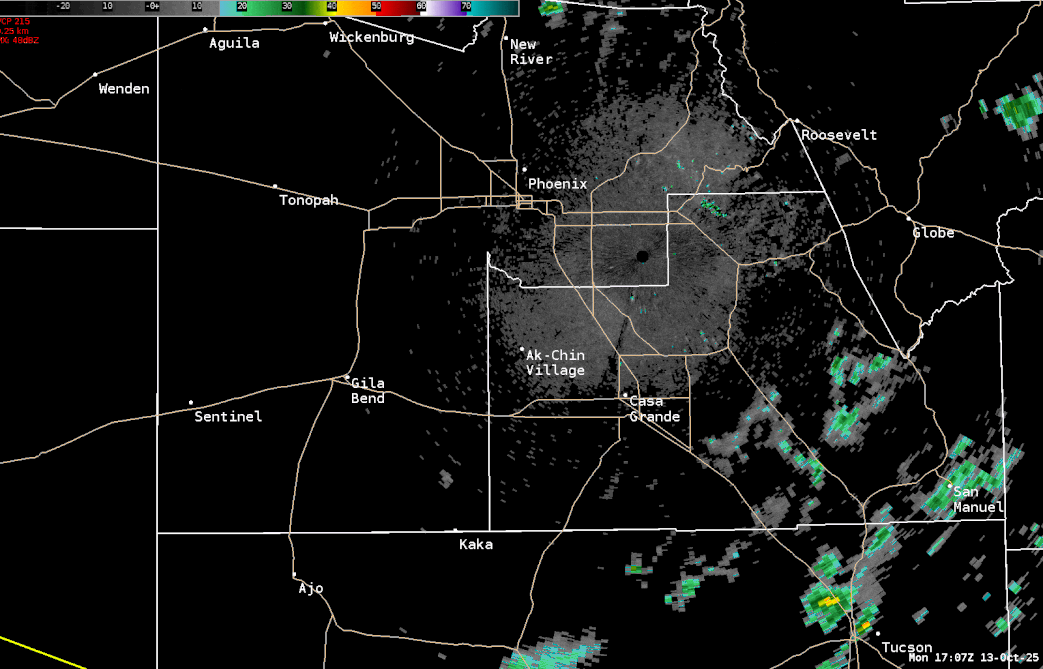
Fig. 13: Reflectivity loop from 10:07 AM to 6:57 PM MST on Oct 13th, 2025 from the KIWA (Phoenix, AZ) radar
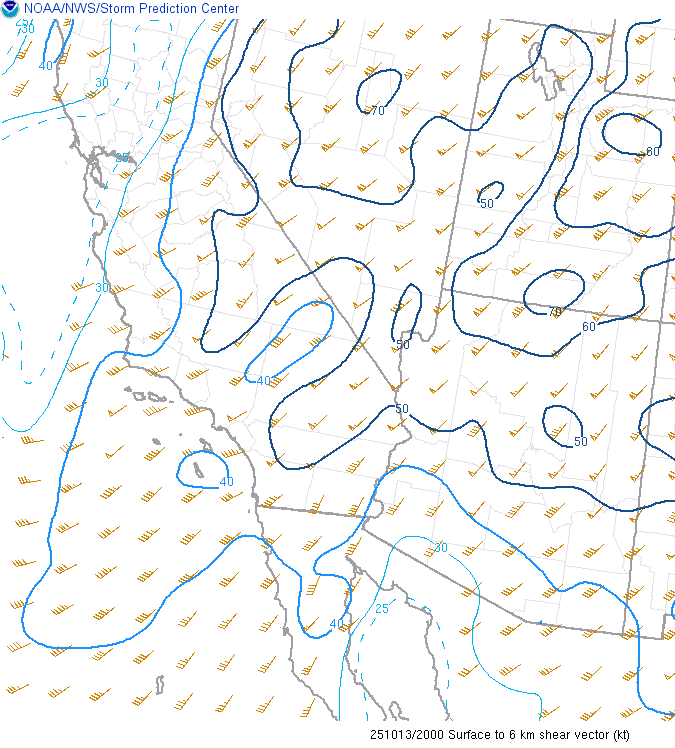
Fig. 14: Surface to 6 km shear at 1 PM MST Oct 13th, 2025
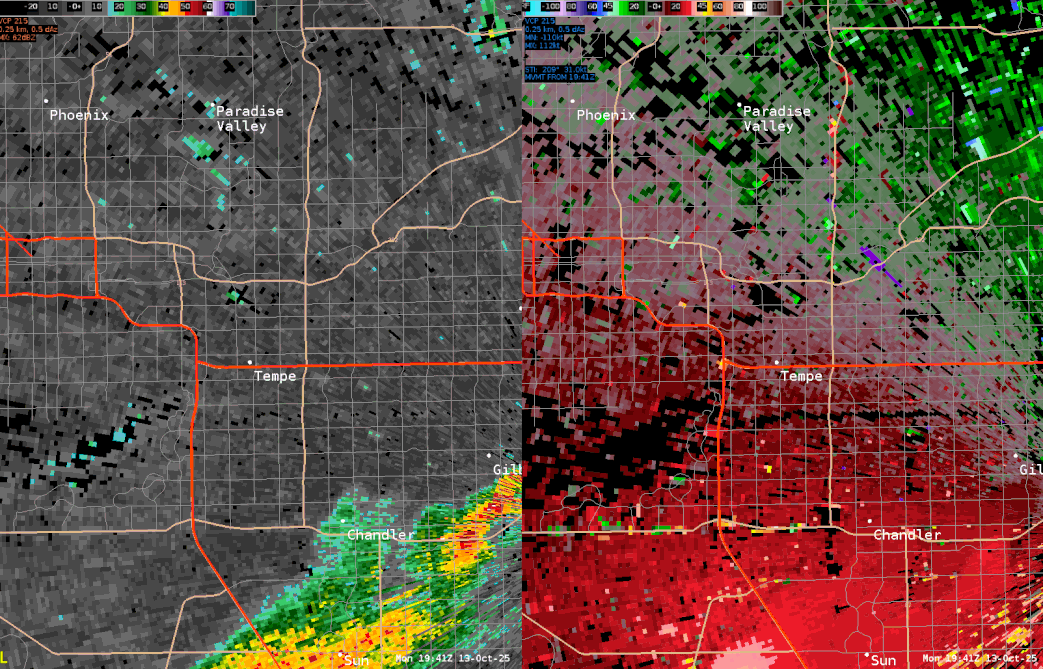
Fig. 15-16: Reflectivity loop (left) and Velocity loop (right) between 12:41 PM and 1:18 PM MST on Oct 13th, 2025 from the KIWA (Phoenix, AZ) radar showing the supercell thunderstorm affecting the Chandler, Tempe, and Scottsdale areas
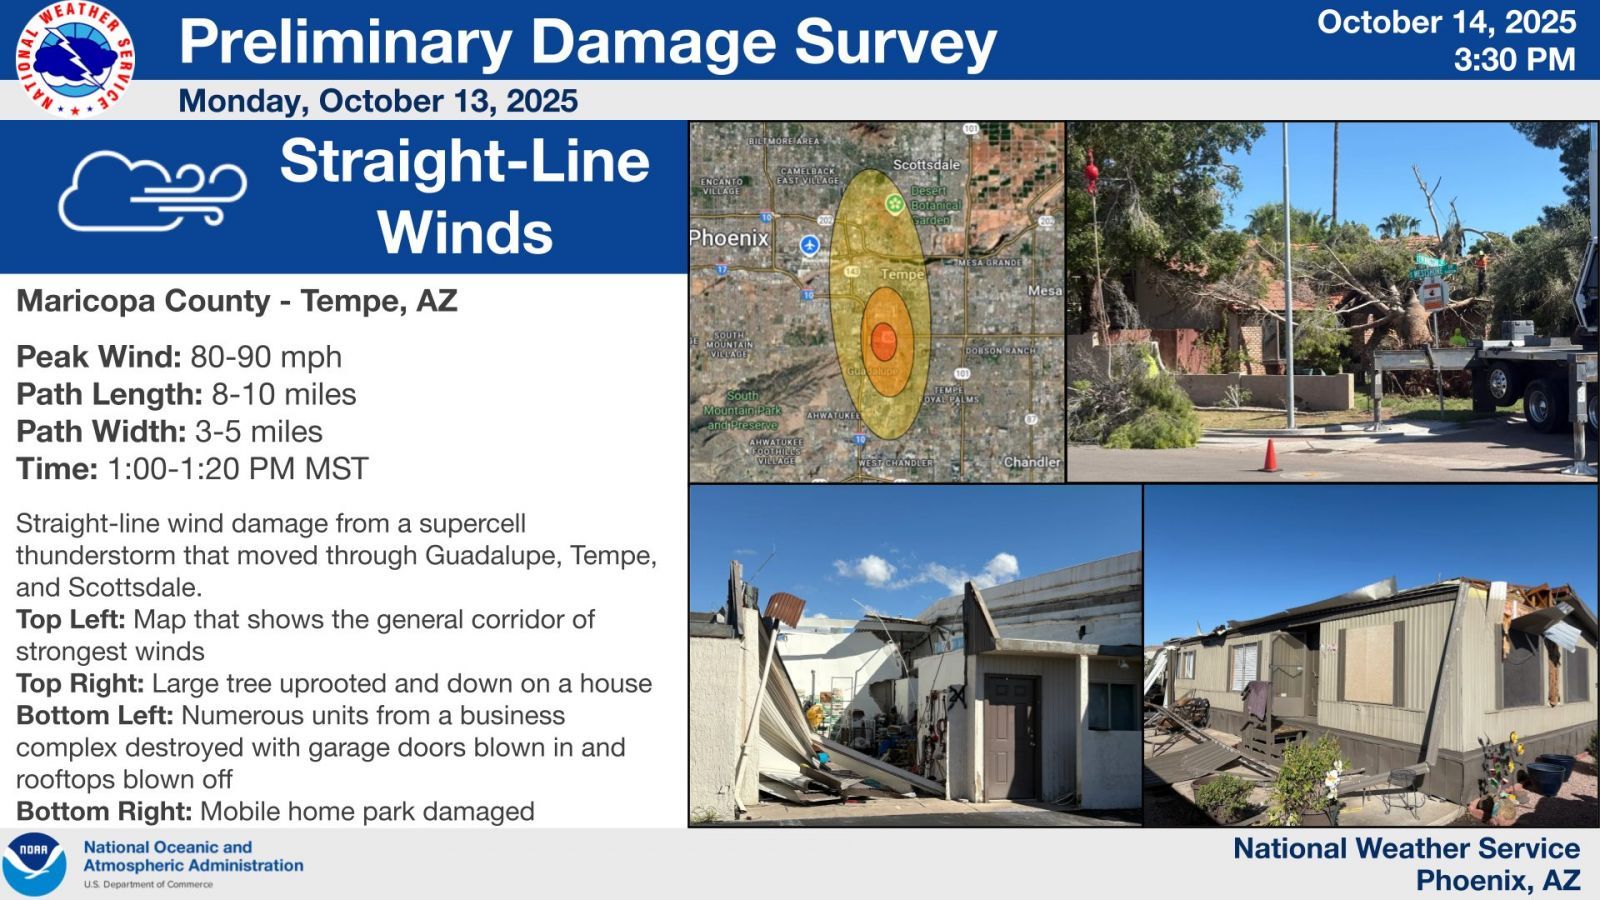
Fig. 17: Preliminary Damage Survey performed by NWS Phoenix in Tempe, AZ
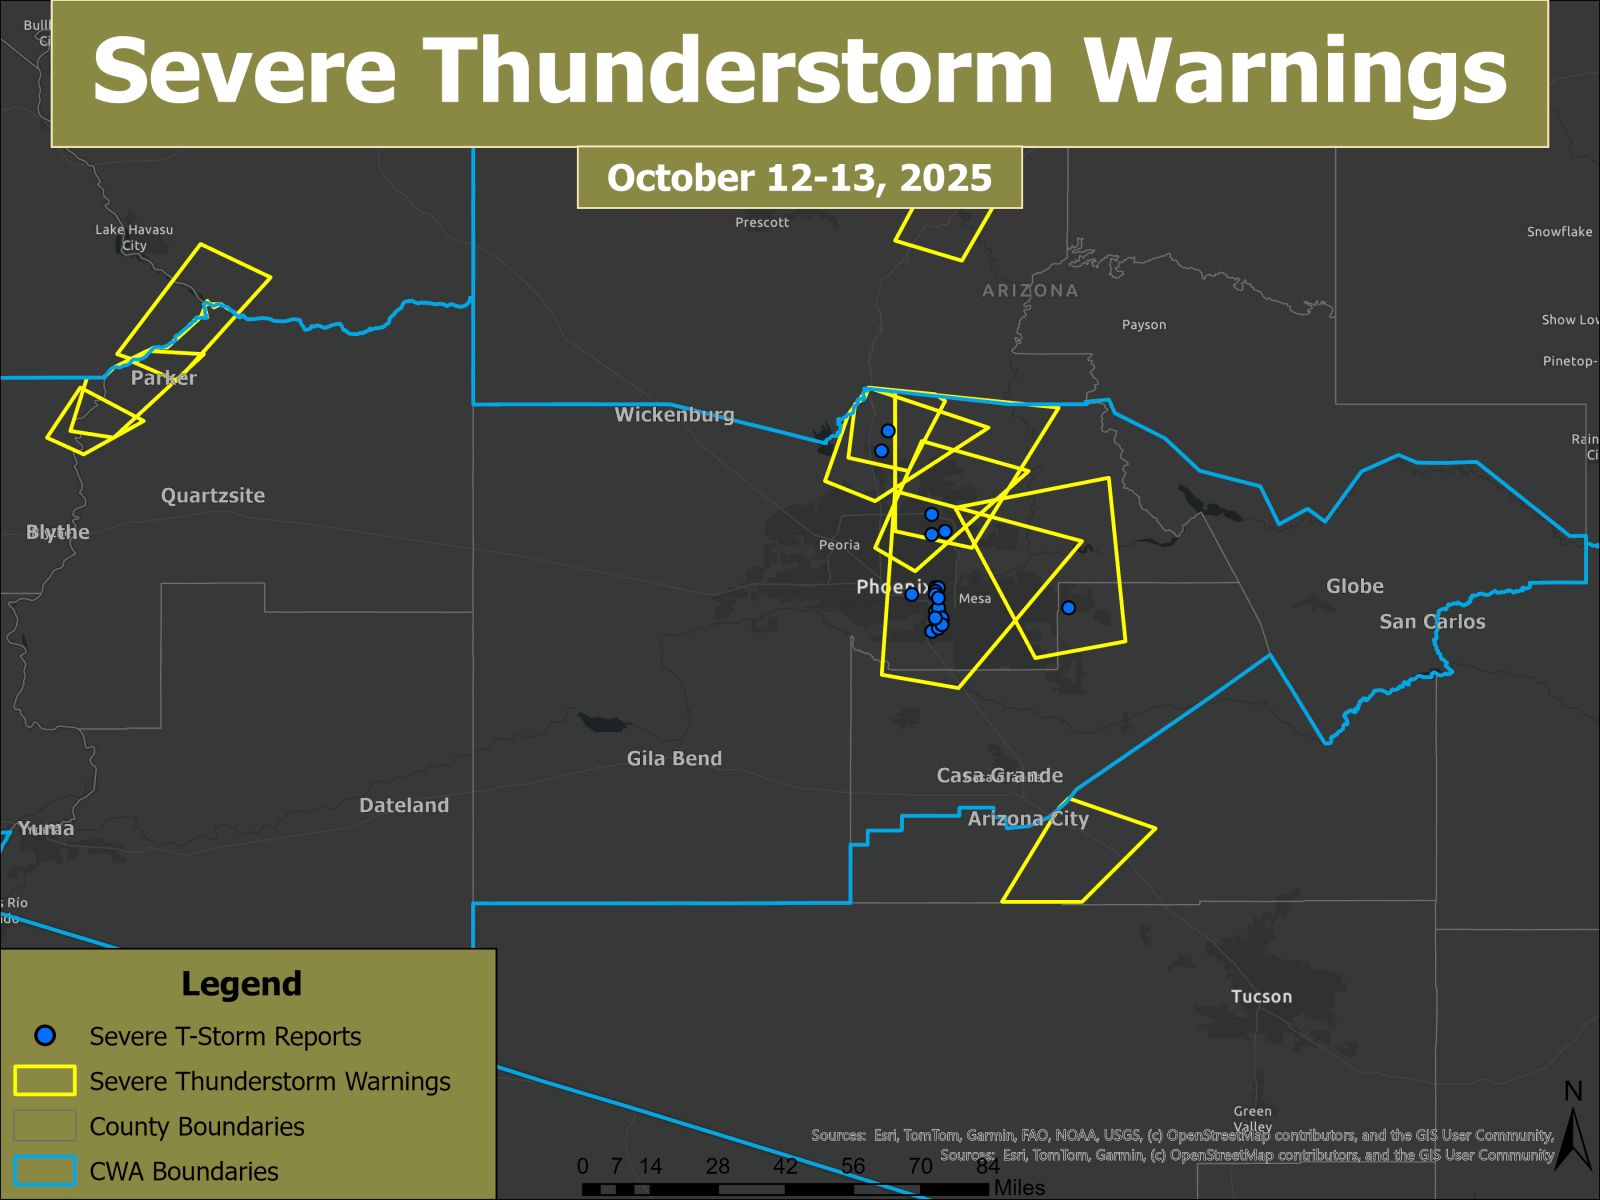
Fig. 18: Spatial extent of the Severe Thunderstorm Warnings issued by the NWS Offices in Phoenix, Flagstaff, Tucson and Las Vegas on Oct 12th and 13th, 2025. Locations of thunderstorm wind damage/severe gusts (wind gusts ≥ 58 mph) reports are noted with the blue dots.
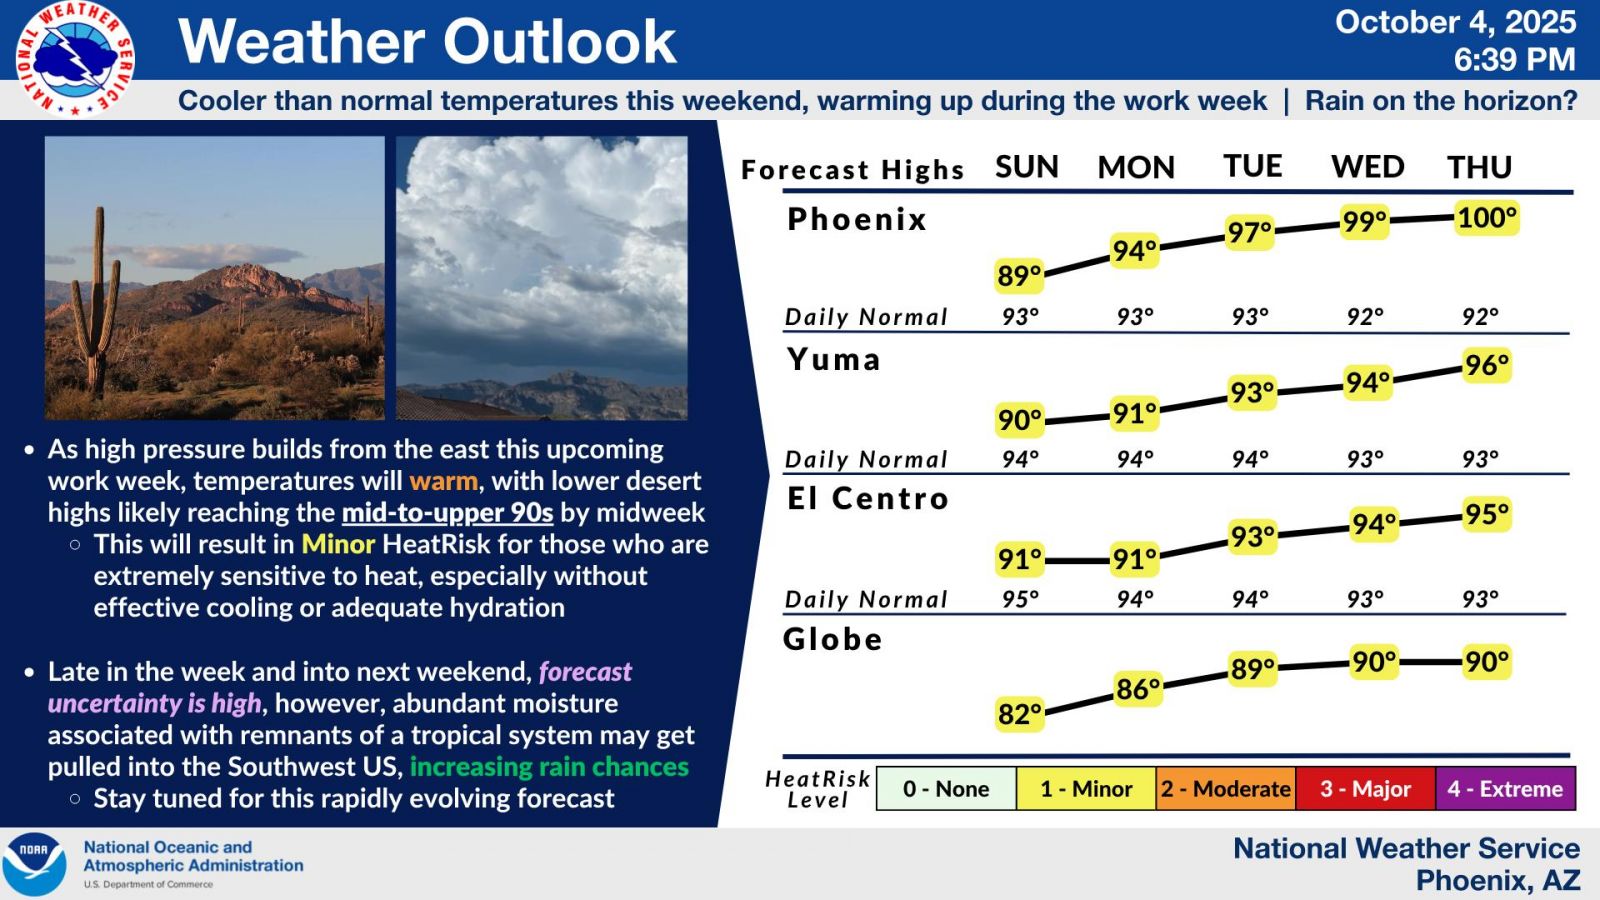
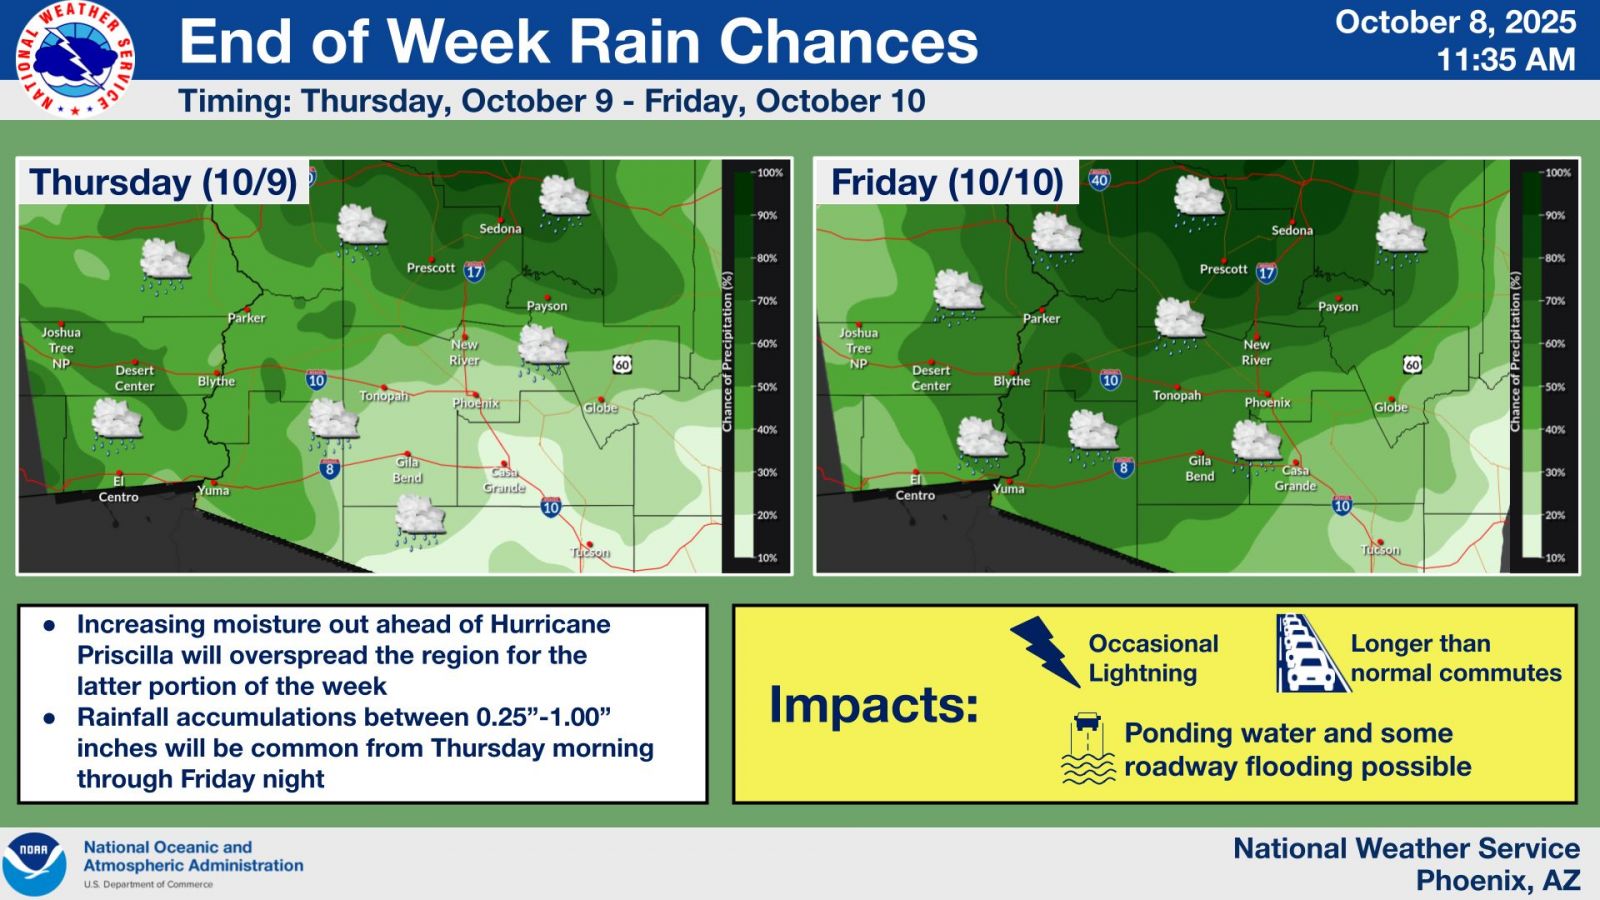
Messaging: With long-range model guidance showing the potential for significant rainfall activity materializing across the area a week out, NWS Phoenix began to highlight this potential with a series of weather story graphics posted on weather.gov/psr and social media from October 4th onwards (Figure 19-20). As the event drew closer and confidence of a widespread heavy rainfall event increased, more detailed graphics regarding timing and impacts were disseminated (Figures 21-22).
 |
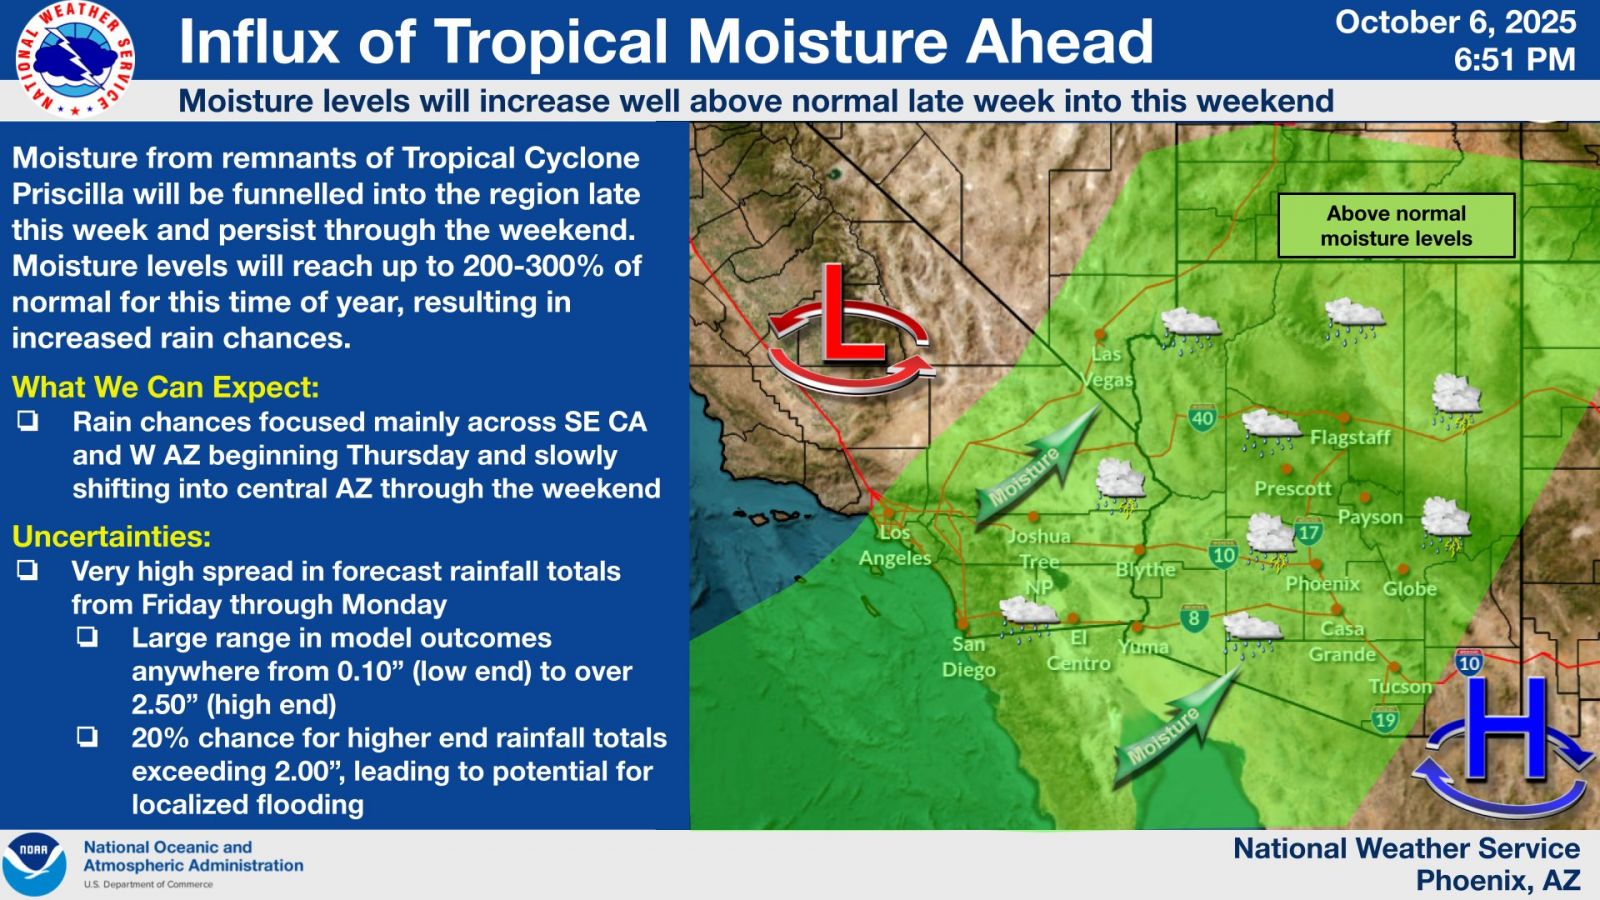 |
Fig. 19-20: Weather story graphics published on Oct 4th and Oct 6th, 2025 highlighting the potential for an active multi-day stretch of rain
 |
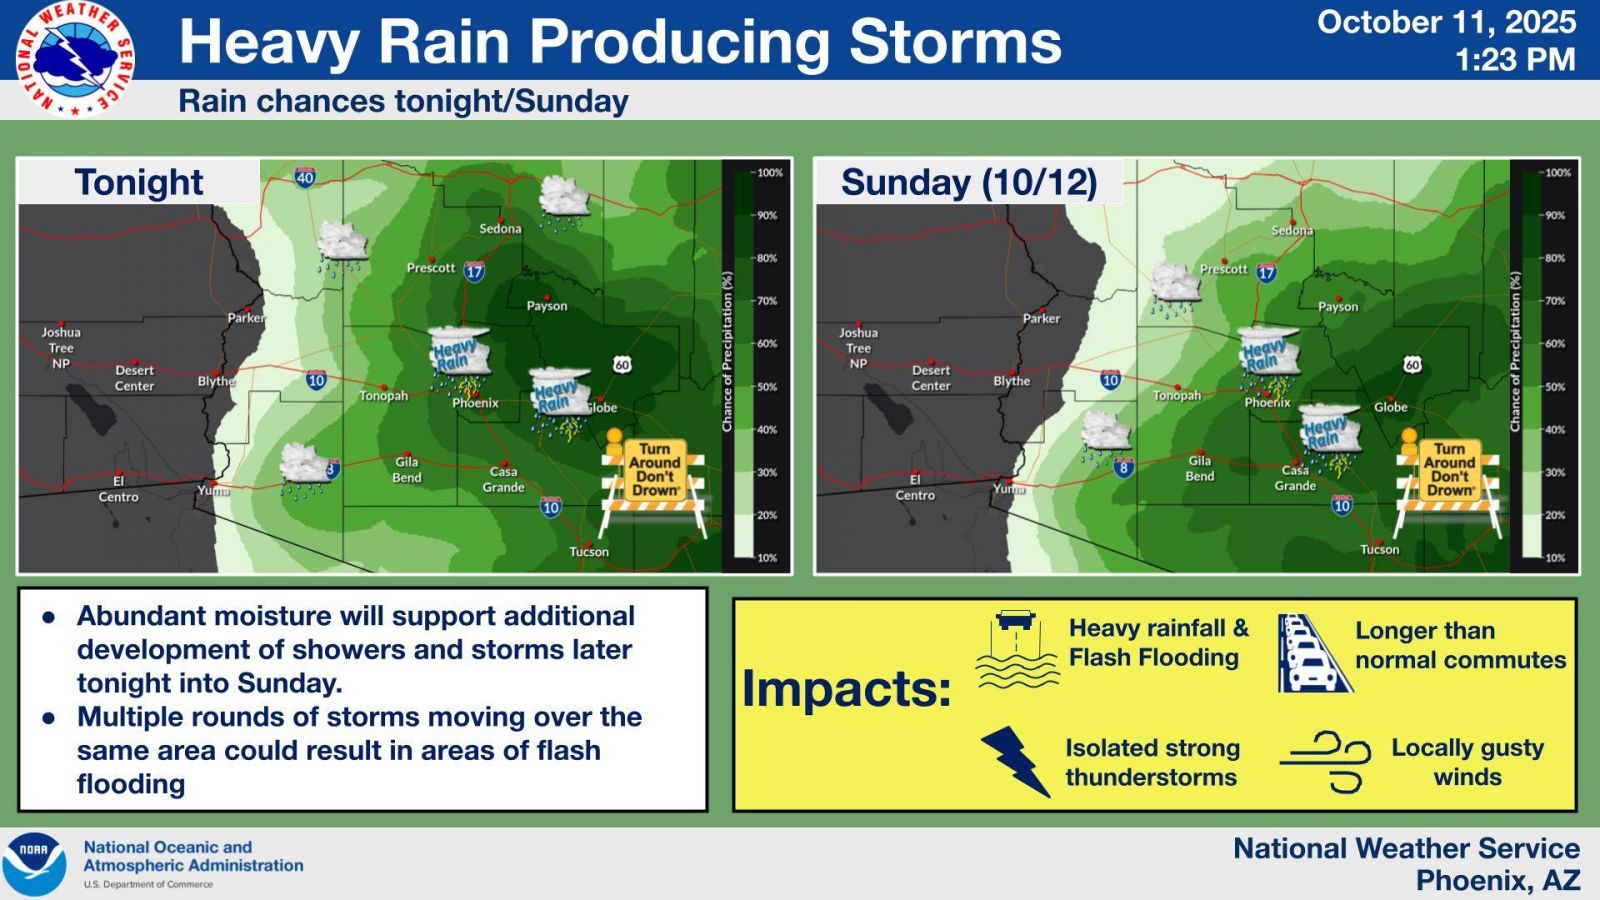 |
Fig. 21-22: Weather story graphics published on Oct 8th and Oct 11th, 2025 providing more detailed information on the rain chances and potential impacts.
In anticipation of heavy rainfall, flood watches were initially issued for most of the area from Wednesday, October 8th, through Saturday, October 11th (Figure 23). A portion of the flood watch was subsequently extended through Monday, October 13th, specifically for south-central Arizona. NWS Phoenix maintained close collaboration with the Arizona Department of Emergency and Military Affairs through twice-daily cooperator calls, where verbal weather forecast briefings were provided. Furthermore, the office hosted daily live webinars for all Emergency Management Personnel from Wednesday, October 8th, to Saturday, October 11th. These webinars facilitated a more in-depth discussion of rainfall forecasts, timing, and anticipated impacts, providing valuable information for emergency management in pre-positioning equipment and resources.
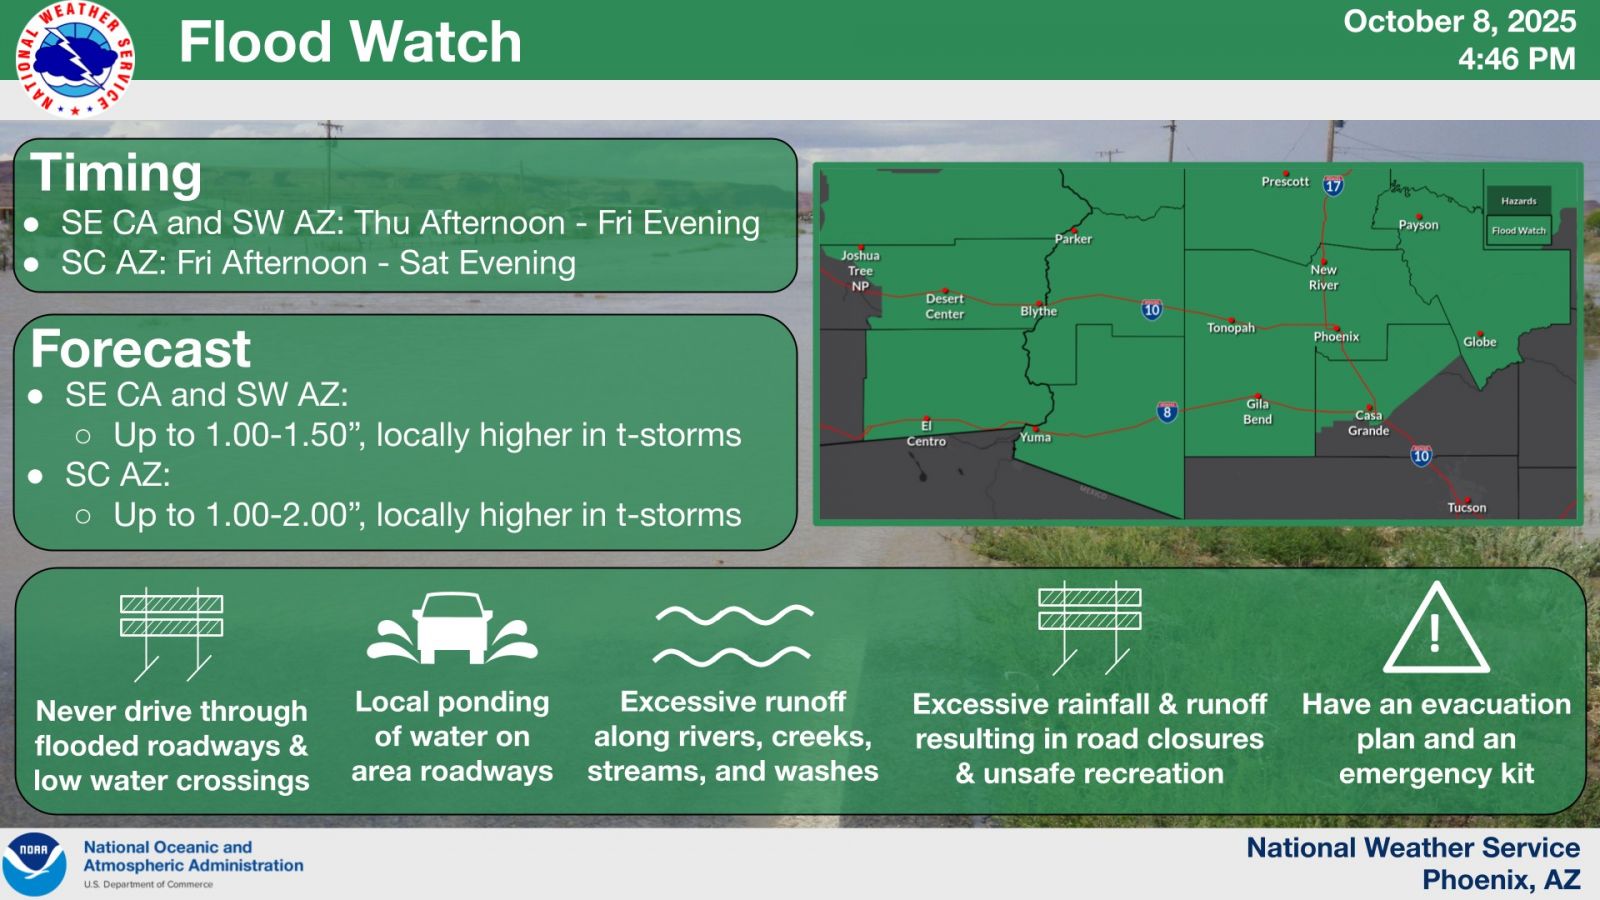
Fig. 23: Weather Story graphic highlighting the Flood Watches issued initially.

