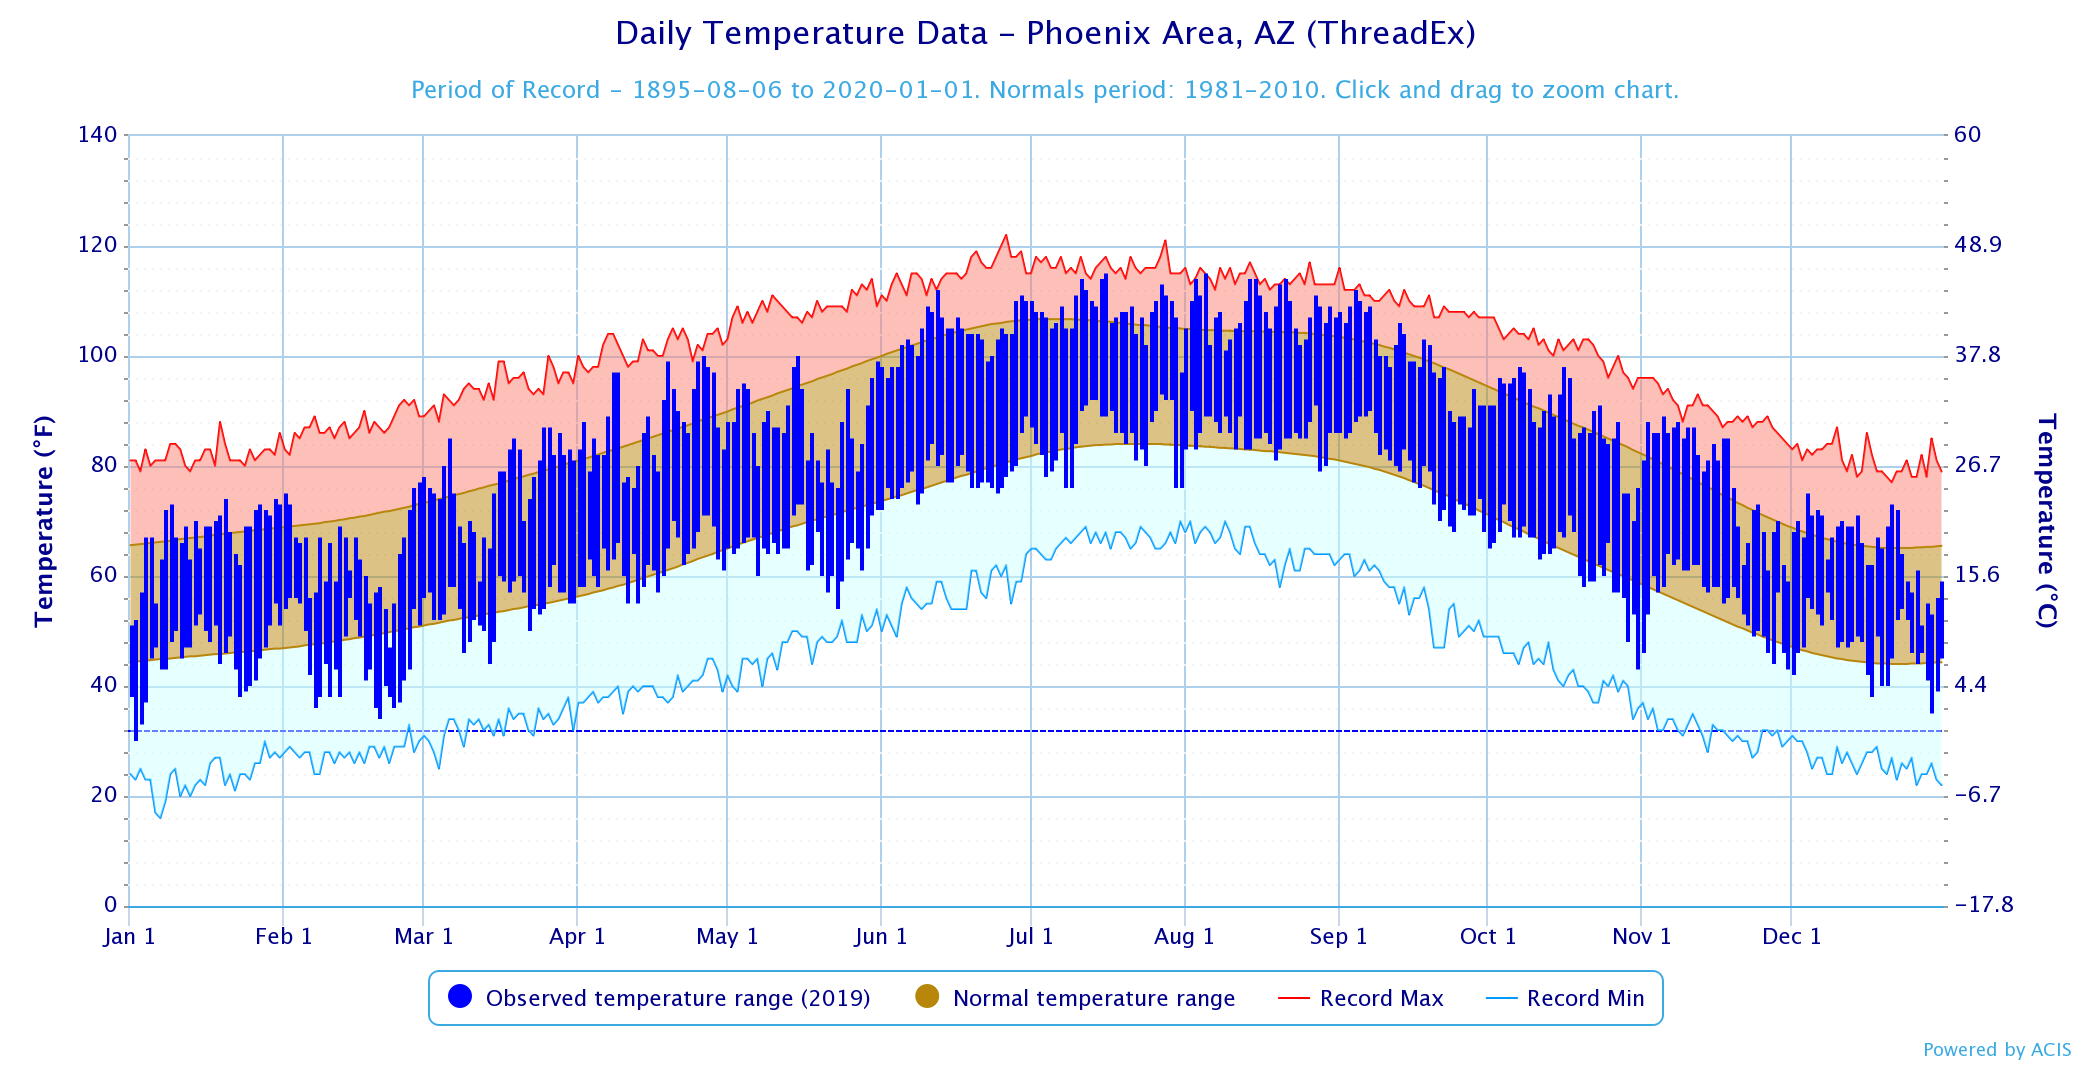
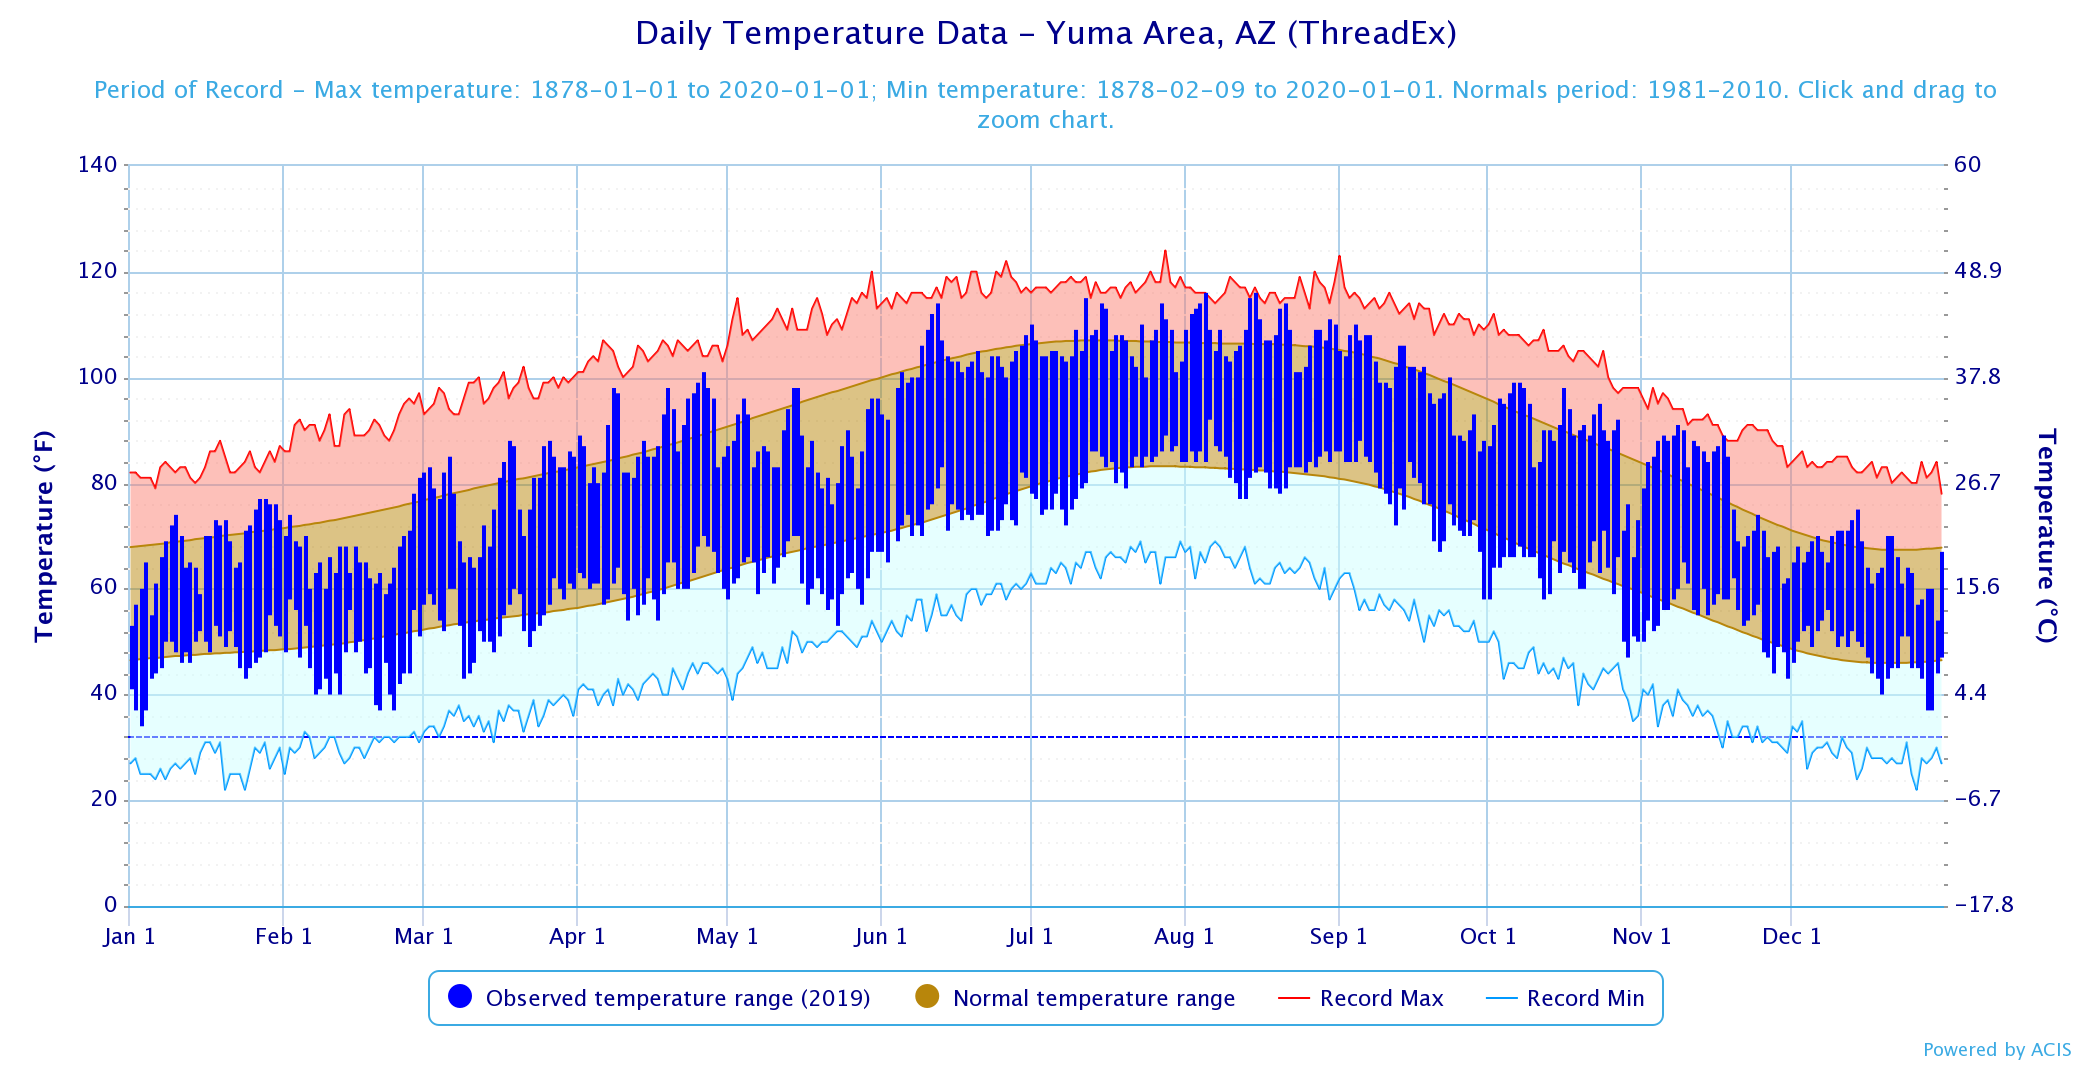
The year 2019 ended up being only the 28th warmest year recorded in the history of central Arizona (Phoenix), and the 46th warmest recorded for southwest Arizona (Yuma). Compared to recent years in Arizona which have habitually fallen in the top 10 warmest ranking due to the impacts of a rapidly changing climate, 2019 was actually somewhat cooler and ended up closer to normal than the area has become accustomed to. Records for Phoenix began in 1896, first taken in downtown and since moved to Sky Harbor airport in the 1950s. Records in Yuma began in 1878.
With a weak El Nino in place, 2019 started fairly unsettled across the Southwest United States. While temperatures in January and March were near normal, a series of potent storm systems in February resulted in a period of abnormally cool weather. In fact, the first 3 months of the year combined produced the coolest Jan-Mar in Phoenix since 1998, and coolest in Yuma since 1985. Old time residents commented that the winter 2018-19 was more like winters when they were young; and temperature records indeed support this as the average Jan-Mar temperature was similar to the average prior to 1980. While an early February storm produced substantial snowfall in northern Arizona, lower elevations experienced the greatest rain and snow during a late February storm.
Lingering cooler weather and even a few storm systems continued through the spring season as the El Nino phase was very slow to deteriorate. May 2019 was significantly cooler than normal, and in fact the monthly average temperature was nearly identical to that in April. This pattern actually held into the early summer and resulted in a lack of thunderstorm activity during the first part of the monsoon. Storm days increased during the second half of the monsoon with the greatest impacts occurring during the month of September. In fact, the first day of September provided some activity across SE California and western AZ. The most notable and memorable storm system swept into the Phoenix metro on September 23rd. In addition to localized heavy rainfall, a brief, weak tornado touched down north of the city. Overall, monsoon 2019 turned out to be one of the hotter and drier monsoon seasons on record.
The monsoon thunderstorm activity ended quicker than it began with dry weather and renewed drought concerns heading through the autumn season. However, an abrupt pattern shift towards the middle of November provided the mechanism to bring several strong storm systems into the Southwest United States. The most significant storm, and one that will probably be remembered for years to come arrived over the Thanksgiving holiday and yielded numerous brief tornadoes across the east parts of the Phoenix metro. The mild, wet pattern continued into December with several storm systems producing more rain and snow for the region, and temporarily easing drought concerns.
|
|
2019
|
Value
|
Rank
|
|
Avg High
|
|
|
|
Avg Low
|
|
|
|
Avg Temp
|
|
|
|
Rain
|
|
|
|
2019
|
Value
|
Rank
|
|
Avg High
|
|
|
|
Avg Low
|
|
|
|
Avg Temp
|
|
|
|
Rain
|
|
|
***Please note all climatic data are considered preliminary until validated by the National Centers for Environmental Information***
|
Phoenix Annual Temperature Rankings (Warmest Years)
|
| Year |
Avg Daily Temp
|
| 2017 |
77.3
|
| 2014 |
77.1
|
| 1989 |
76.9
|
| 2016 |
76.7
|
| 2015 |
76.7
|
| 2012 |
76.7
|
| 2018 |
76.4
|
| 2007 |
76.4
|
| 2003 |
76.3
|
| 2009 |
76.0
|
| #28) 2019 |
74.9
|
|
| Year |
Avg Max Temp |
| 1989 |
89.8
|
| 2017 |
89.1
|
| 2014 |
88.9
|
| 2012 |
88.7
|
| 2016 |
88.5
|
| 1934 |
88.3
|
| 2018 |
88.1
|
| 2015 |
88.0
|
| 2002 |
88.0
|
| 1988 |
88.0
|
| #39) 2019 |
86.2
|
|
| Year |
Avg Min Temp |
| 2017 |
65.4
|
| 2015 |
65.4
|
| 2014 |
65.4
|
|
2016
|
65.0
|
| 2003 |
64.9
|
| 2007 |
64.8
|
|
2018
|
64.7
|
| 2012 |
64.7
|
| 2001 |
64.4
|
| 2005 |
64.3
|
| #22) 2019 |
63.6
|
|
|
|
Avg Max Temp
|
Highest
Temp
|
Avg Min Temp
|
Lowest Temp
|
Avg Temp
|
Rank (1=Warmest, 124=Coldest)
|
| Jan |
67.0
|
74 on the 20th & 30th
|
45.0
|
30 on the 2nd
|
56.0 /-0.4
|
25th
|
| Feb |
63.6
|
77 on the 28th
|
44.6
|
34 on the 20th
|
54.1 /-5.6
|
99th
|
| Mar |
76.8
|
87 on the 25th & 26th
|
54.4
|
44 on the 14th
|
65.6 /+0.4
|
Tied 22nd
|
| Apr |
87.9
|
100 on the 26th
|
62.7
|
55 on the 11th &13th
|
75.3 /+2.6
|
Tied 8th
|
| May |
87.8
|
100 on the 15th
|
64.7
|
54 on the 23rd
|
76.2 /-5.9
|
84th
|
| Jun |
104.0
|
112 on the 12th
|
78.1
|
72 on the 1st
|
91.1 /+0.3
|
27th
|
| Jul |
108.2
|
115 on the 16th
|
85.1
|
76 on the 30th & 31st
|
96.7 /+1.9
|
Tied 6th
|
| Aug |
108.2
|
115 on the 5th
|
85.4
|
79 on the 28th
|
96.8 /+3.2
|
2nd
|
| Sep |
99.5
|
112 on the 4th
|
78.7
|
68 on the 24th & 30th
|
89.1 /+0.7
|
20th
|
| Oct |
88.7
|
98 on the 7th & 16th
|
62.8
|
43 on the 31st
|
75.8 /-0.9
|
32nd
|
| Nov |
77.8
|
89 on the 5th
|
55.1
|
43 on the 30th
|
66.4 /+2.3
|
Tied 13th
|
| Dec |
65.3
|
75 on the 4th
|
46.9
|
35 on the 29th
|
56.1 /+0.7
|
26th
|
(*** click on month for more comprehensive monthly summary ***)
| Date |
Record |
Previous Record |
| Jun 12 |
112 - tied record
|
112 in 1974
|
| Aug 3 |
114 - tied record
|
114 in 2009
|
| Aug 5 |
115
|
114 in 1969
|
| Aug 20 |
113
|
112 in 1986
|
| Aug 21 |
114
|
110 in 2007
|
| Sep 4 |
112 - tied record
|
112 in 1945
|
| No Record Lows were set in 2019 |
Yuma Annual Temperature Rankings (Warmest Years)
| Year |
Avg Daily Temp |
| 2017 |
77.5 |
| 2016 |
77.2
|
| 2008 |
77.1
|
| 1996 |
77.0
|
| 1995 |
76.8
|
| 1981 |
76.8
|
| 2012 |
76.6
|
| 2018 |
76.4
|
| 1989 |
76.5
|
| 1958 |
76.2
|
| #46) 2019 |
74.6 |
|
| Year |
Avg Max Temp |
| 1981 |
91.0
|
| 1950 |
91.0
|
| 1958 |
90.6
|
| 1989 |
90.5
|
| 1954 |
90.5
|
| 1959 |
90.2
|
| 1962 |
90.1
|
|
1960
|
90.1
|
|
2008
|
90.1
|
|
2017
|
90.0
|
| #87) 2019 |
86.8 |
|
| Year |
Avg Min Temp |
| 2017 |
64.9 |
| 2016 |
64.7
|
| 1996 |
64.4
|
| 2008 |
64.2
|
| 2005 |
64.2
|
| 2003 |
64.2
|
| 2018 |
64.1
|
| 2004 |
64.0
|
| 1997 |
63.9
|
|
1995
|
63.9
|
| #25) 2019 |
62.4 |
|
|
|
Avg Max Temp
|
Highest
Temp
|
Avg Min Temp
|
Lowest Temp
|
Avg Temp
|
Rank (1=Warmest, 142=Coldest)
|
| Jan |
68.0
|
77 on the 27th & 28th
|
47.0
|
34 on the 3rd
|
57.5 /-1.1
|
Tied 46th
|
| Feb |
66.5
|
81 on the 28th
|
45.8
|
37 on the 20th & 23rd
|
56.1 /-5.8
|
123rd
|
| Mar |
78.4
|
88 on the 18th & 26th
|
54.4
|
43 on the 9th
|
66.4 /-0.8
|
Tied 43rd
|
| Apr |
89.3
|
101 on the 26th
|
61.1
|
54 on the 11th & 17th
|
75.2 / +2.2
|
16th
|
| May |
87.6
|
98 on the 14th & 15th
|
62.2
|
53 on the 23rd
|
74.9 /-6.4
|
121st
|
| Jun |
102.9
|
114 on the 12th
|
73.2
|
64 on the 3rd
|
88.2 /-0.9
|
Tied 41st
|
| Jul |
107.0
|
115 on the 12th
|
81.2
|
72 on the 8th
|
94.1 /-0.4
|
Tied 39th
|
| Aug |
108.7
|
116 on the 5th & 15th
|
82.9
|
77 on the 12th & 13th
|
95.8 /+1.5
|
Tied 9th
|
| Sep |
99.3
|
110 on the 4th
|
76.5
|
58 on the 30th
|
87.9 /-1.1
|
Tied 52nd
|
| Oct |
89.3
|
99 on the 6th & 7th
|
62.3
|
47 on the 29th
|
75.8 /-1.7
|
Tied 55th
|
| Nov |
79.3
|
91 on the 8th
|
54.6
|
43 on the 30th
|
67.0 /+1.3
|
Tied 19th
|
| Dec |
65.7
|
75 on the 14th
|
47.5
|
37 on the 28th & 29th
|
56.6 /-0.8
|
Tied 68th
|
(*** click on month for more comprehensive monthly summary ***)
| Date |
Record |
Previous Record |
| Aug 5 |
116
|
115 in 1995
|
| Aug 14 |
115 - tied record
|
115 in 2015
|
| Nov 17 |
89
|
88 in 1949
|
| No Record Lows were set in 2019 |
|
Arizona 2019 Average
Maximum Temperature 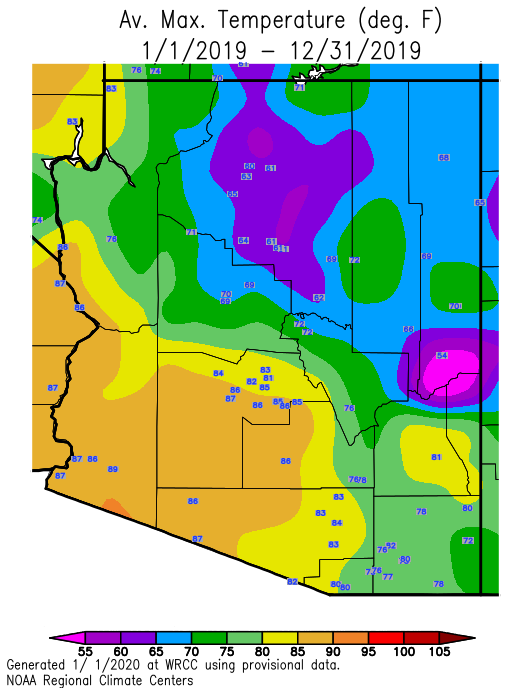
|
Arizona 2019 Maximum Temp Departure from normal 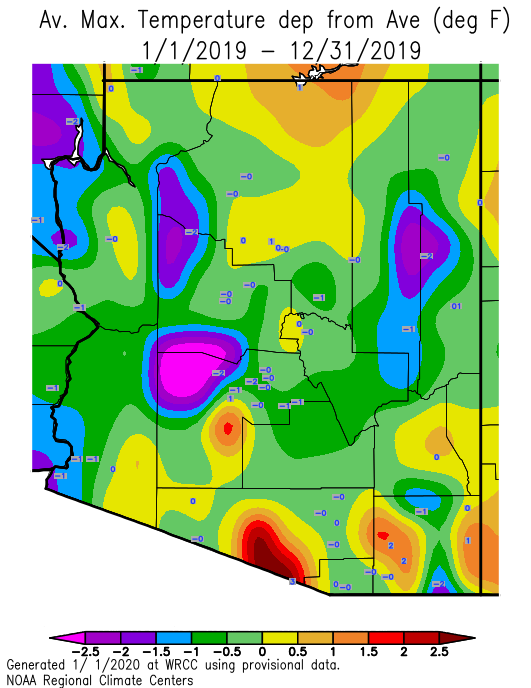
|
|
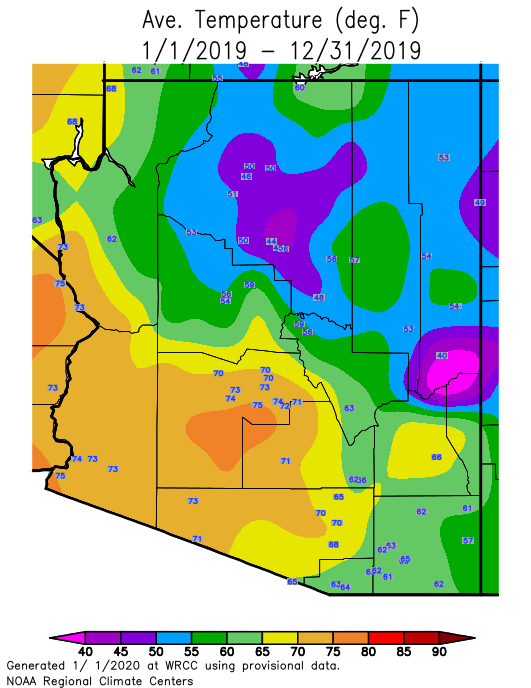
Arizona 2019 Average
Minimum Temperature 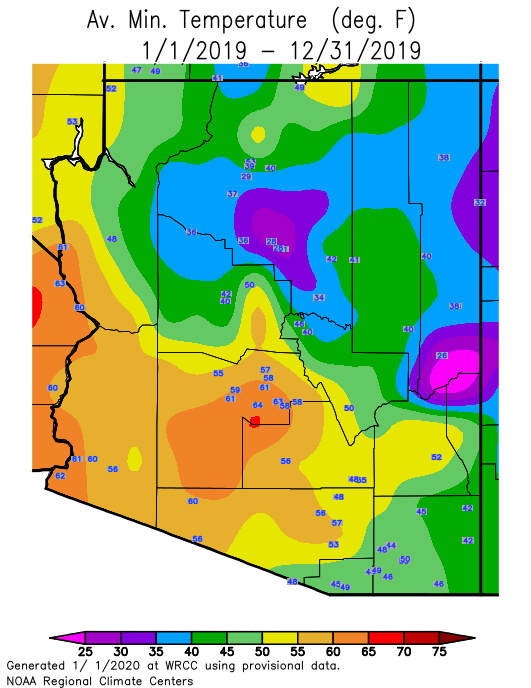
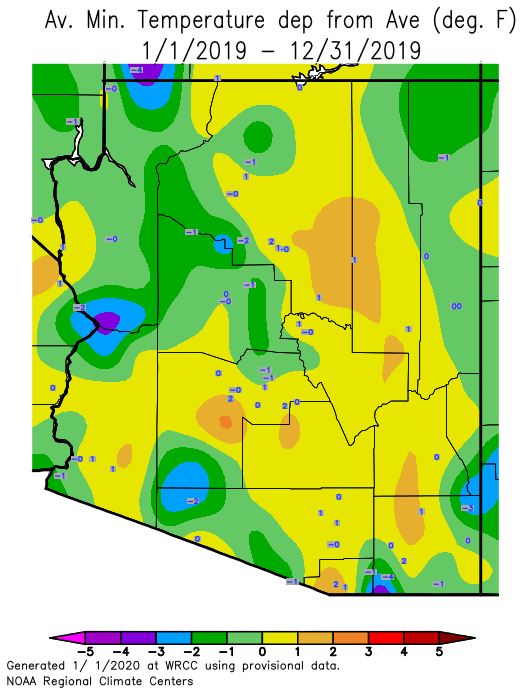
|
Arizona 2019 Minimum Temp
Departure from normal
|
|
Arizona 2019 Average Temperature
|
Arizona 2019 Average Temp
Departure from normal 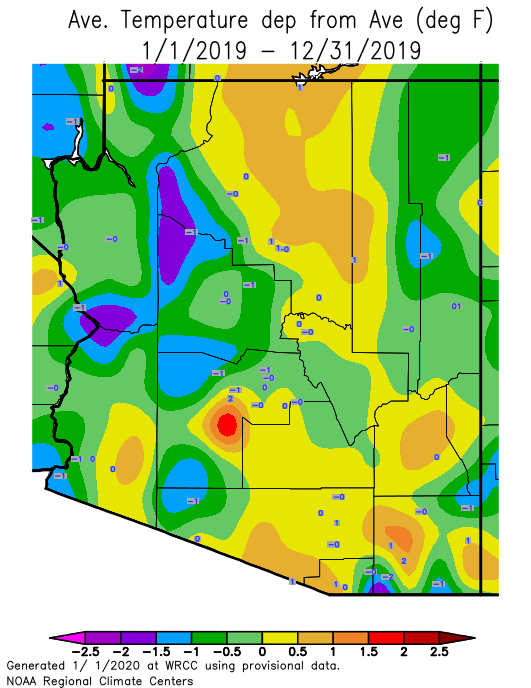
|
| 2019 Phoenix Precipitation Statistics |
| |
Precip Total |
Departure |
Rank (1=Wettest, 124=Driest) |
| Jan |
0.74
|
-0.17
|
54th
|
| Feb |
1.79
|
+0.87
|
14th
|
| Mar |
0.30
|
-0.69
|
83rd
|
| Apr |
0.09
|
-0.19
|
Tied 68th
|
| May |
0.10
|
-0.01
|
Tied 35th
|
| Jun |
0.00
|
-0.02
|
Tied 124th
|
| Jul |
0.17
|
-0.88
|
107th
|
| Aug |
0.24
|
-0.76
|
102nd
|
| Sep |
0.25
|
-0.39
|
74th
|
| Oct |
0.00
|
-0.58
|
Tied 124th
|
| Nov |
1.55
|
+0.90
|
16th
|
| Dec |
0.70
|
-0.18
|
54th
|
(*** click on month for more comprehensive monthly summary ***)
| Phoenix Record Daily Rainfall for 2019 |
| Date |
Record |
Previous Record |
| Feb 21 |
1.01
|
0.73 in 1973
|
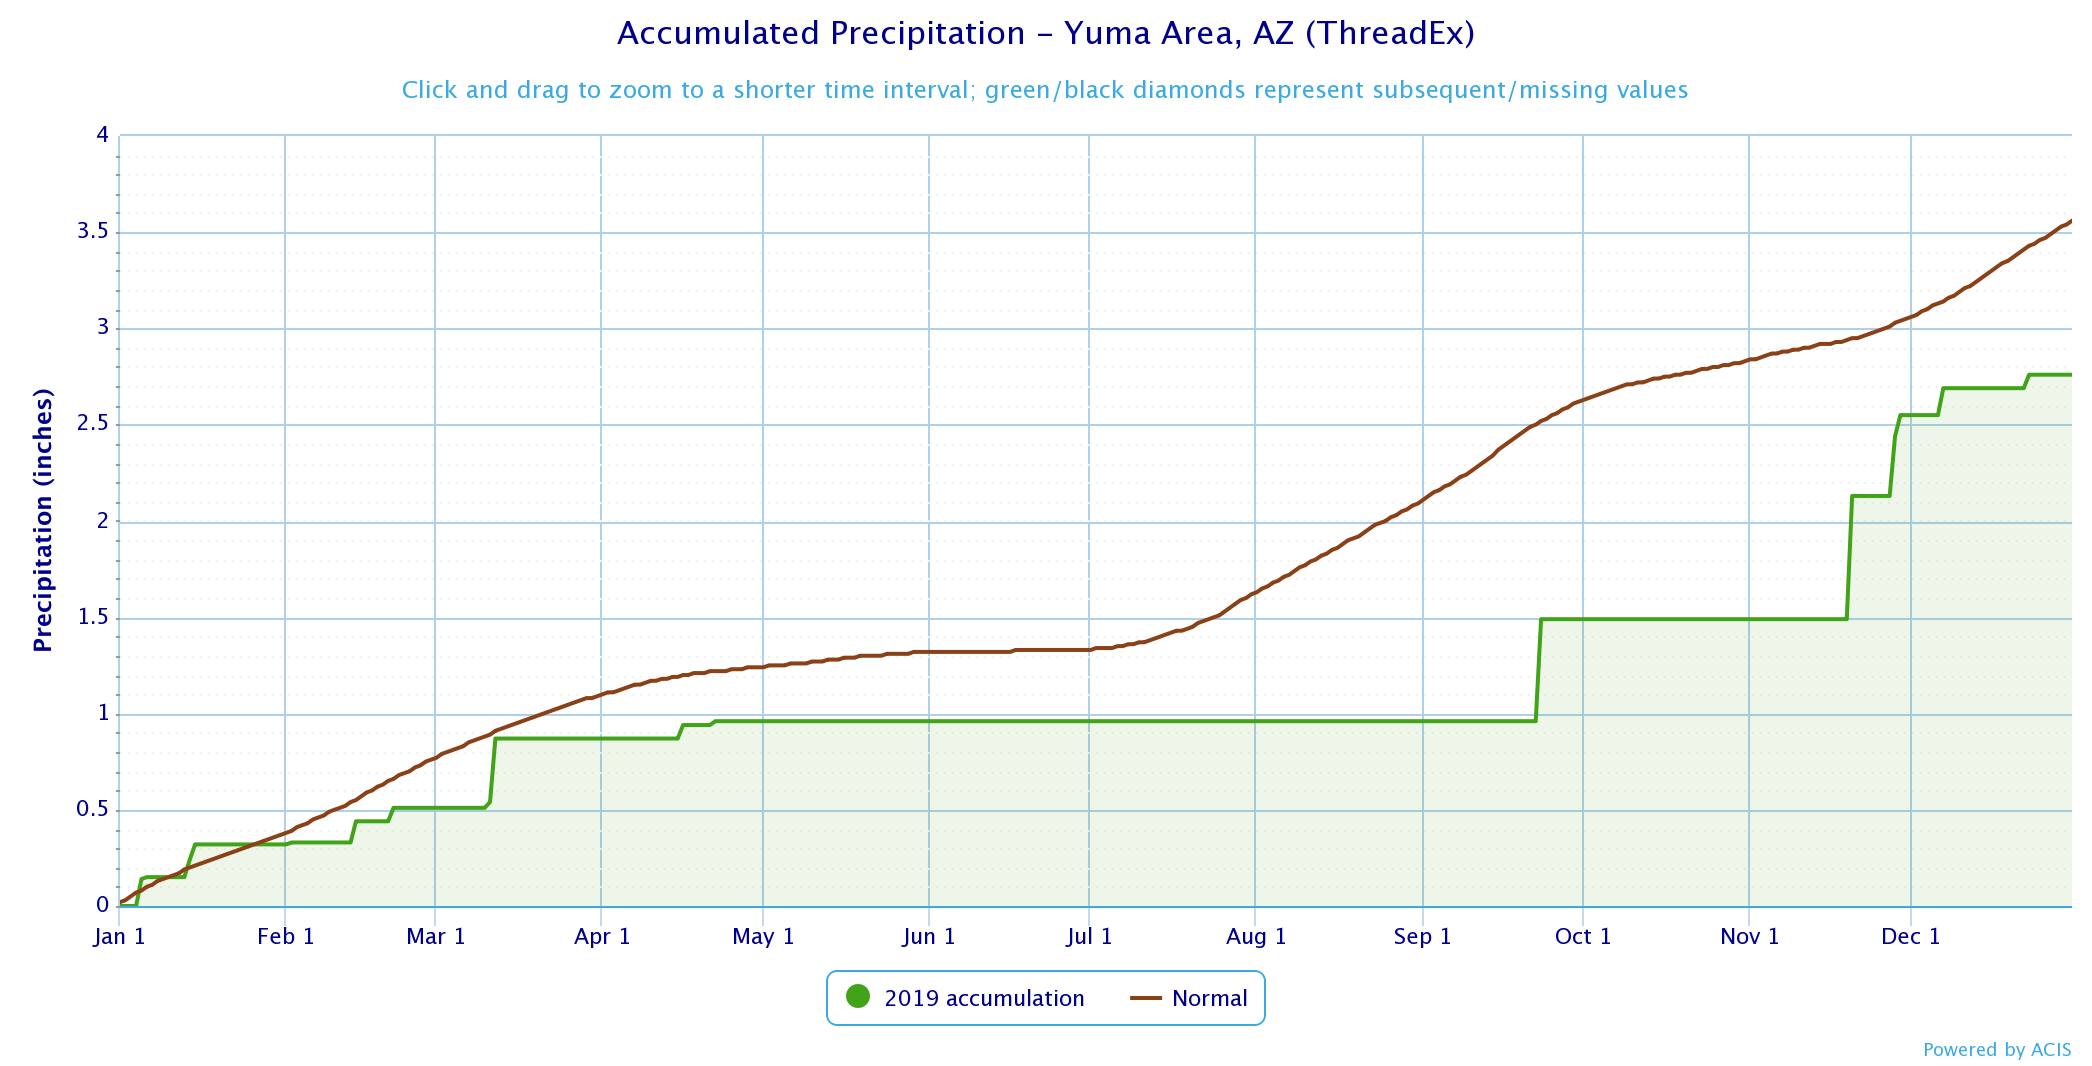
| 2019 Yuma Precipitation Statistics |
| |
Precip Total |
Departure |
Rank (1=Wettest, 142=Driest) |
| Jan |
0.32
|
-0.05
|
56th
|
| Feb |
0.19
|
-0.20
|
Tied 55th
|
| Mar |
0.36
|
+0.03
|
37th
|
| Apr |
0.09
|
-0.06
|
39th
|
| May |
T
|
-0.08
|
Tied 142nd
|
| Jun |
0.00
|
-0.01
|
Tied 142nd
|
| Jul |
T
|
-0.29
|
Tied 142nd
|
| Aug |
T
|
-0.47
|
Tied 142nd
|
| Sep |
0.53
|
+0.00
|
Tied 30th
|
| Oct |
0.00
|
-0.21
|
Tied 142nd
|
| Nov |
1.06
|
+0.84
|
9th
|
| Dec |
0.21
|
-0.30
|
67th
|
(*** click on month for more comprehensive monthly summary ***)
| Yuma Record Daily Rainfall for 2019 |
| Date |
Record |
Previous Record |
| Sep 23 |
0.53
|
0.24 in 1999
|
| Nov 28 |
0.31
|
0.06 in 1981
|
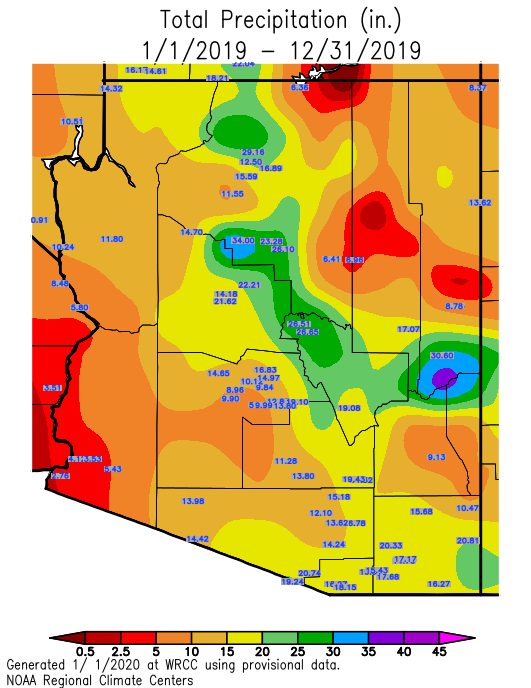
|
Arizona 2019
Precipitation
|
Arizona 2019 Precip Departure from normal 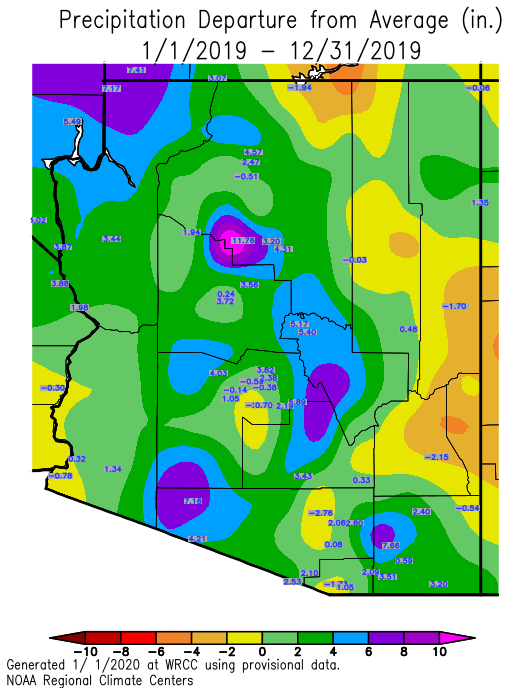
|
Arizona 2019 Precip Percent Normal 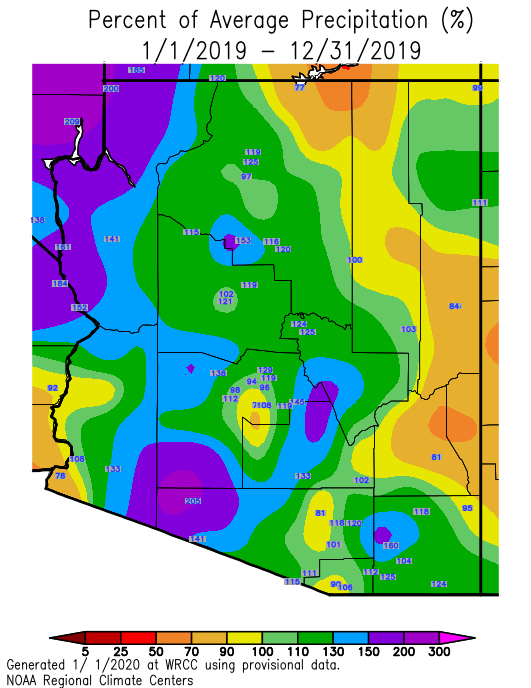
|
CLIMATE REPORT
NATIONAL WEATHER SERVICE PHOENIX AZ
759 AM MST THU JAN 02 2020
...................................
...THE PHOENIX AZ CLIMATE SUMMARY FOR THE YEAR OF 2019...
CLIMATE NORMAL PERIOD 1981 TO 2010
CLIMATE RECORD PERIOD 1895 TO 2020
WEATHER OBSERVED NORMAL DEPART LAST YEAR`S
VALUE DATE(S) VALUE FROM VALUE
NORMAL
..............................................................
TEMPERATURE (F)
RECORD
HIGH 122 06/26/1990
LOW 16 01/07/1913
HIGHEST 115 07/16 114 1
08/05
LOWEST 30 01/02 35 -5
AVG. MAXIMUM 86.2 86.7 -0.5
AVG. MINIMUM 63.6 63.5 0.1
MEAN 74.9 75.1 -0.2
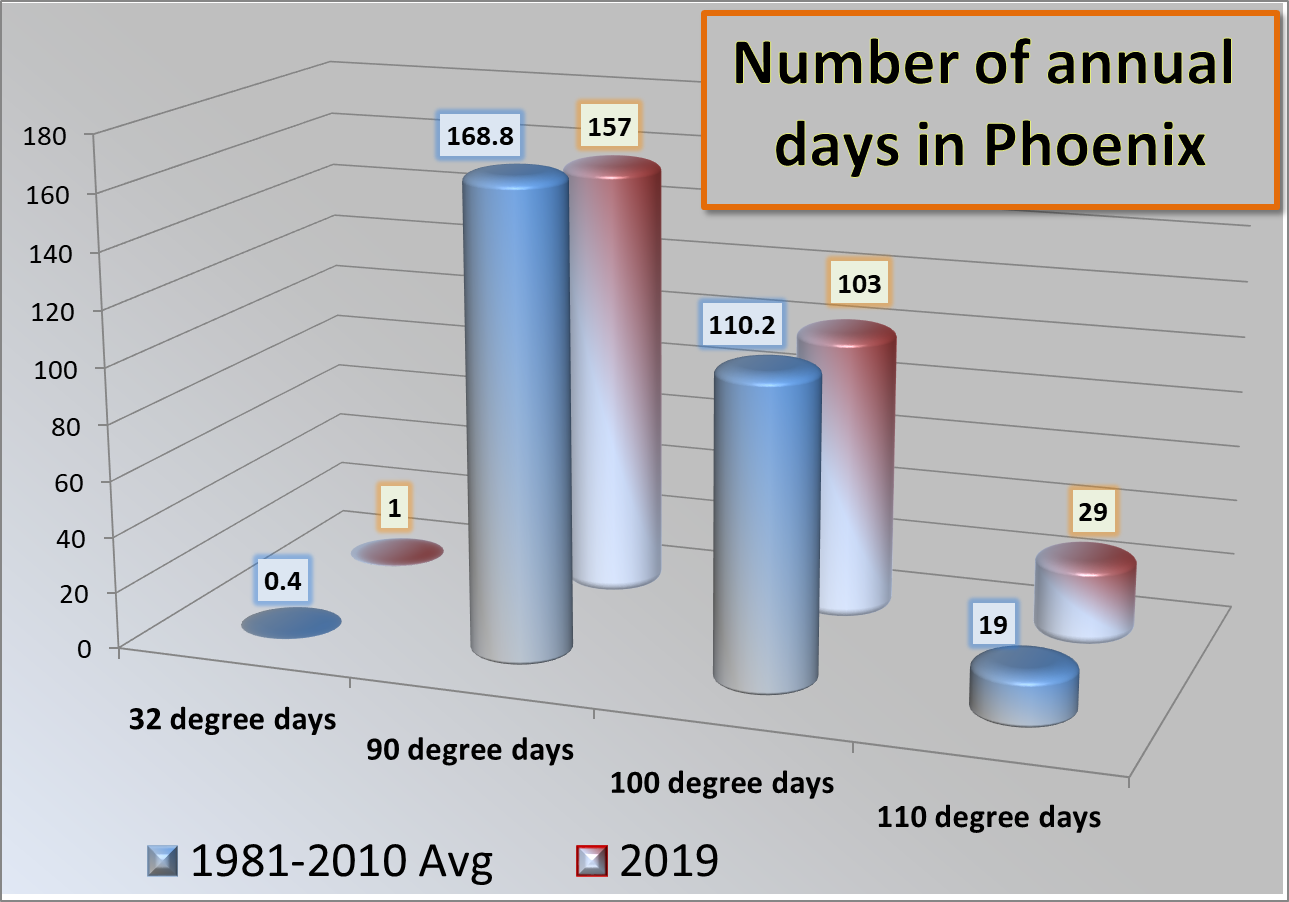
DAYS MAX >= 90 157 168.8 -11.8
DAYS MAX <= 32 0 0.0 0.0
DAYS MAX >= 100 103
DAYS MAX >= 110 29
DAYS MIN <= 32 1 0.4 0.6
DAYS MIN <= 0 0 0.0 0.0
DAYS MIN >= 90 12
PRECIPITATION (INCHES)
RECORD
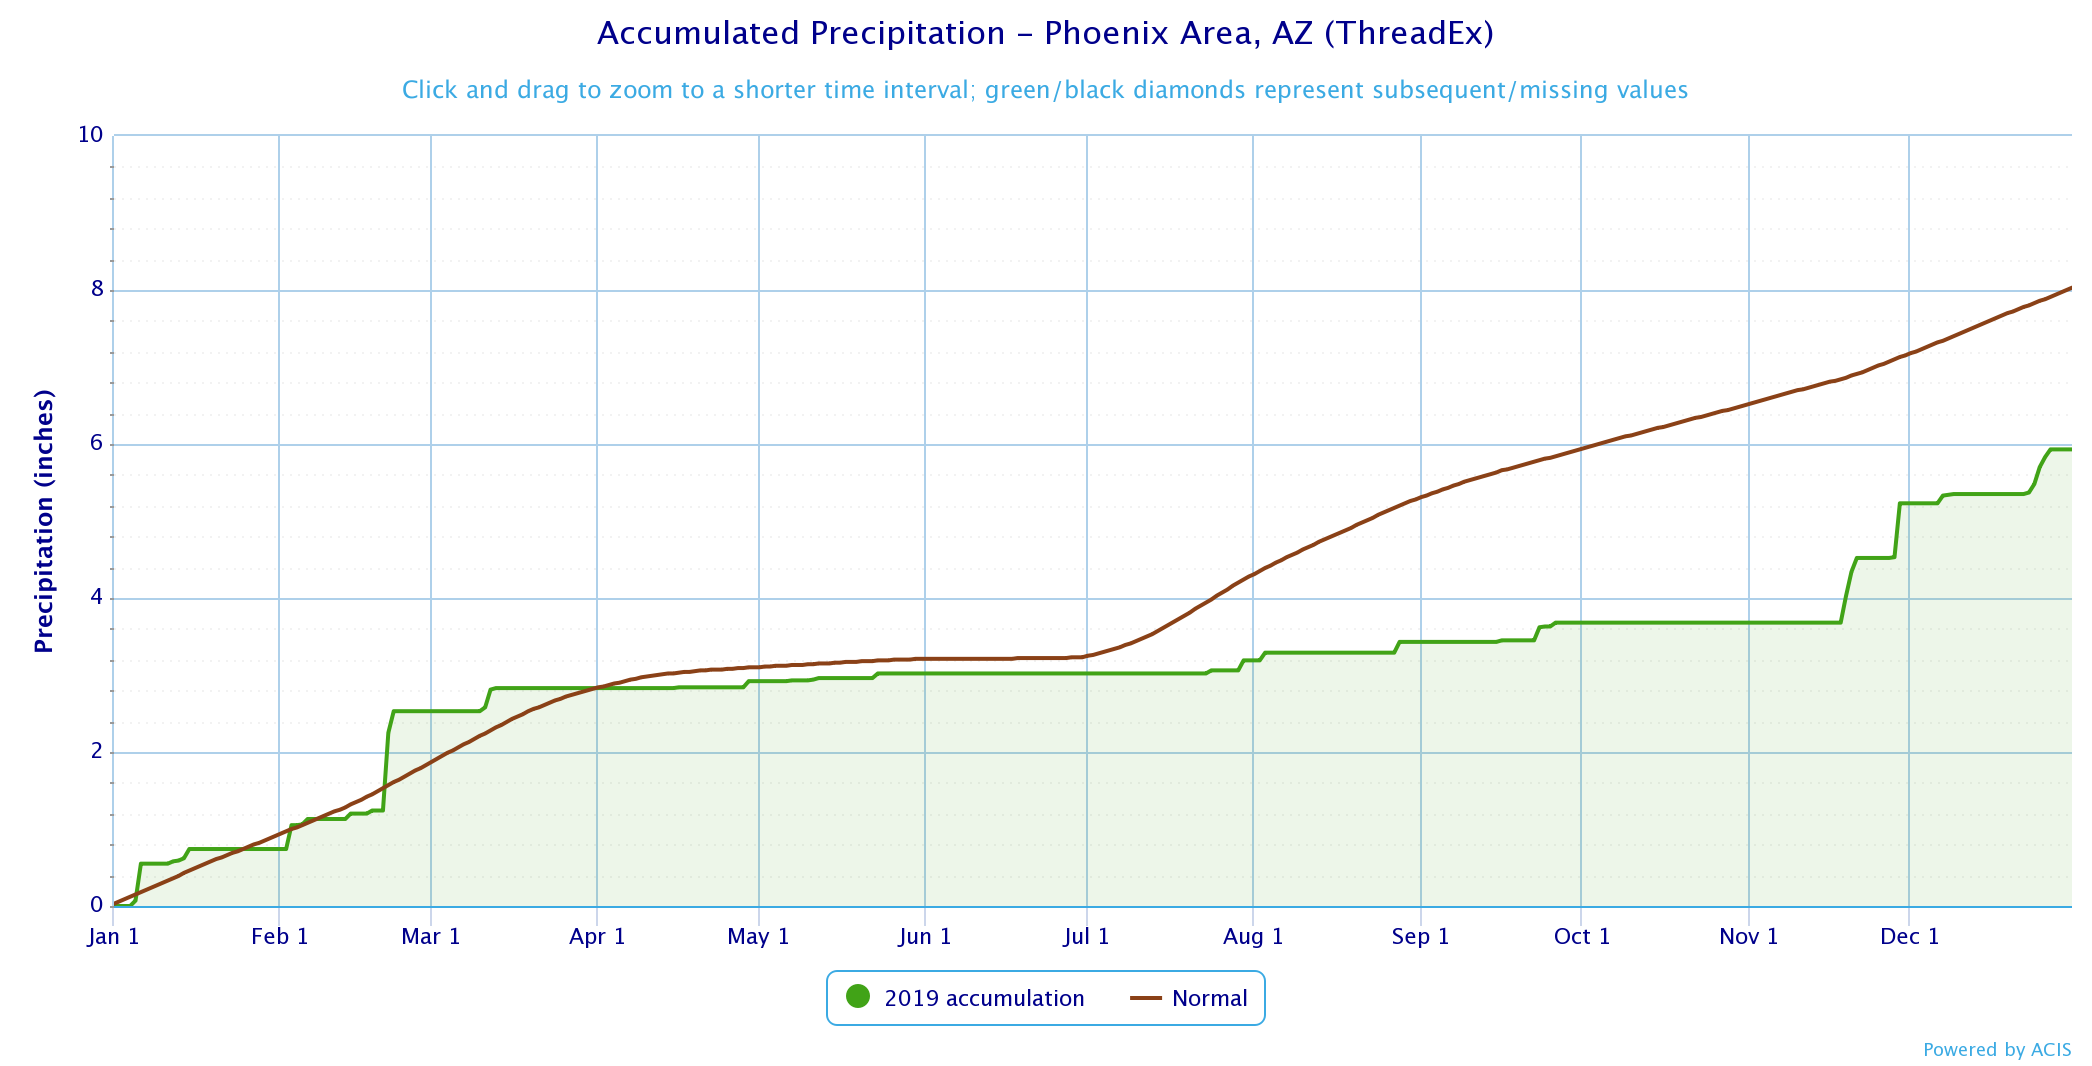
MAXIMUM 19.73 1905
MINIMUM 2.82 2002
TOTALS 5.93 8.03 -2.10
DAYS >= .01 43 36.6 6.4
DAYS >= .10 19 18.7 0.3
DAYS >= .50 2 4.5 -2.5
DAYS >= 1.00 1 1.3 -0.3
GREATEST
24 HR. TOTAL 1.01 02/21 TO 02/21
DEGREE DAYS
HEATING TOTAL 984 935 49
SINCE 7/1 358 397 -39
COOLING TOTAL 4746 4608 138
SINCE 1/1 4746 4607 139
..............................................................
WIND (MPH)
AVERAGE WIND SPEED 6.6
HIGHEST GUST SPEED/DIRECTION 52/060 DATE 11/29
AVERAGE RH (PERCENT) 37
WEATHER CONDITIONS. NUMBER OF DAYS WITH
THUNDERSTORM 23 HEAVY RAIN 6
RAIN 17 LIGHT RAIN 47
FOG W/VIS <= 1/4 MILE 1
- INDICATES NEGATIVE NUMBERS.
R INDICATES RECORD WAS SET OR TIED.
MM INDICATES DATA IS MISSING.
T INDICATES TRACE AMOUNT.
CLIMATE REPORT
NATIONAL WEATHER SERVICE PHOENIX AZ
759 AM MST THU JAN 02 2020
...................................
...THE YUMA AZ CLIMATE SUMMARY FOR THE YEAR OF 2019...
CLIMATE NORMAL PERIOD 1981 TO 2010
CLIMATE RECORD PERIOD 1876 TO 2020
WEATHER OBSERVED NORMAL DEPART LAST YEAR`S
VALUE DATE(S) VALUE FROM VALUE
NORMAL
..............................................................
TEMPERATURE (F)
RECORD
HIGH 124 07/28/1995
LOW 22 01/24/1937
12/26/1911
01/20/1883
HIGHEST 116 08/15 115 1
08/05
LOWEST 34 01/03 36 -2
AVG. MAXIMUM 86.8 88.3 -1.5
AVG. MINIMUM 62.4 63.4 -1.0
MEAN 74.6 75.9 -1.3
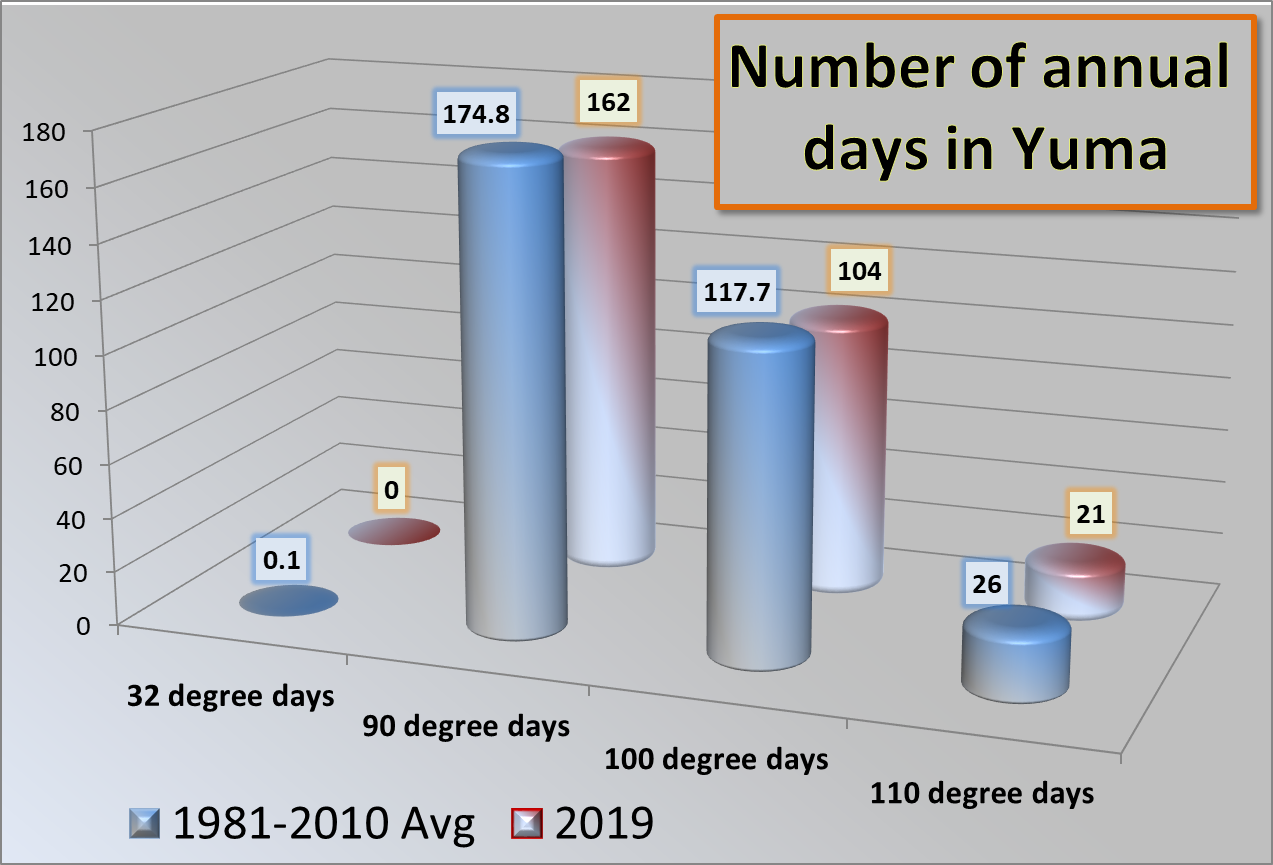
DAYS MAX >= 90 162 174.8 -12.8
DAYS MAX <= 32 0 0.0 0.0
DAYS MAX >= 100 104
DAYS MAX >= 110 21
DAYS MIN <= 32 0 0.1 -0.1
DAYS MIN <= 0 0 0.0 0.0
DAYS MIN >= 90 1
PRECIPITATION (INCHES)
RECORD
MAXIMUM 11.41 1905
MINIMUM 0.03 2002
TOTALS 2.76 3.56 -0.80
DAYS >= .01 17 17.4 -0.4
DAYS >= .10 8 8.6 -0.6
DAYS >= .50 2 1.9 0.1
DAYS >= 1.00 0 0.5 -0.5
GREATEST
24 HR. TOTAL 0.64 11/20 TO 11/21
DEGREE DAYS
HEATING TOTAL 863 687 176
SINCE 7/1 330 300 30
COOLING TOTAL 4482 4650 -168
SINCE 1/1 4482 4651 -169
..............................................................
WIND (MPH)
AVERAGE WIND SPEED 7.1
HIGHEST GUST SPEED/DIRECTION 55/360 DATE 09/23
AVERAGE RH (PERCENT) 38
WEATHER CONDITIONS. NUMBER OF DAYS WITH
THUNDERSTORM 14 HEAVY RAIN 4
RAIN 6 LIGHT RAIN 24
FOG W/VIS <= 1/4 MILE 2
- INDICATES NEGATIVE NUMBERS.
R INDICATES RECORD WAS SET OR TIED.
MM INDICATES DATA IS MISSING.
T INDICATES TRACE AMOUNT.