NO IMPROVEMENT TO DROUGHT CONDITIONS ACROSS THE REGION
|
 |
|
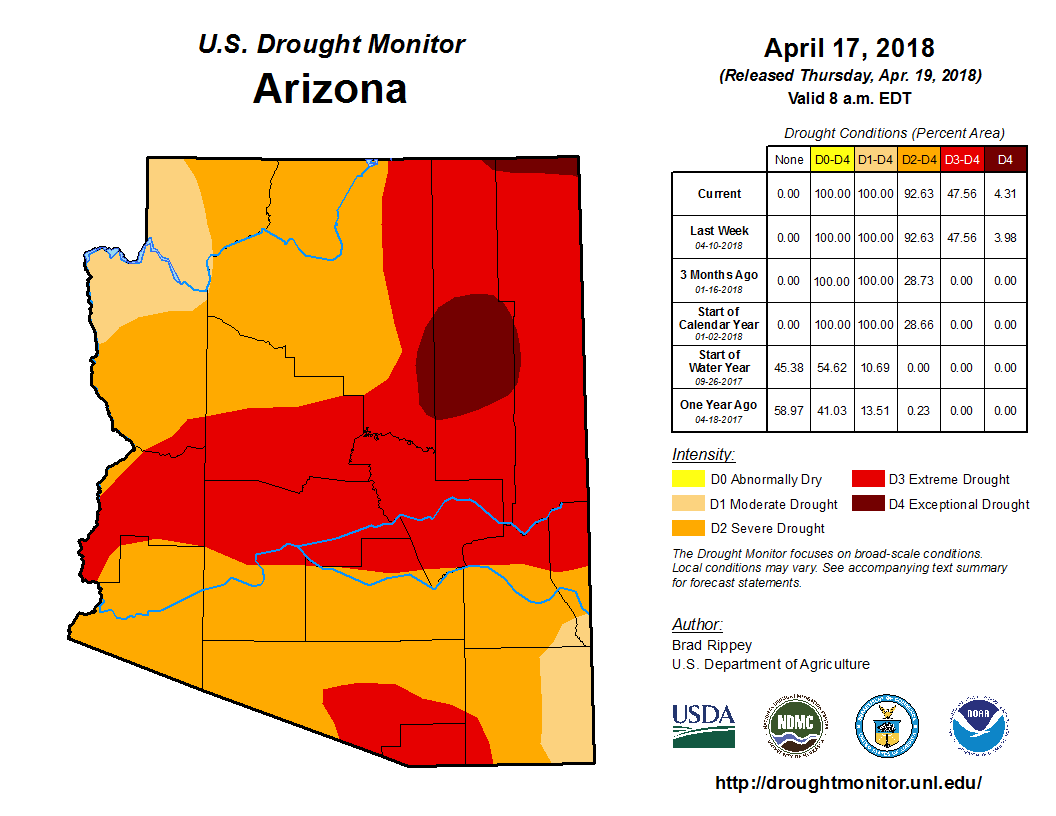
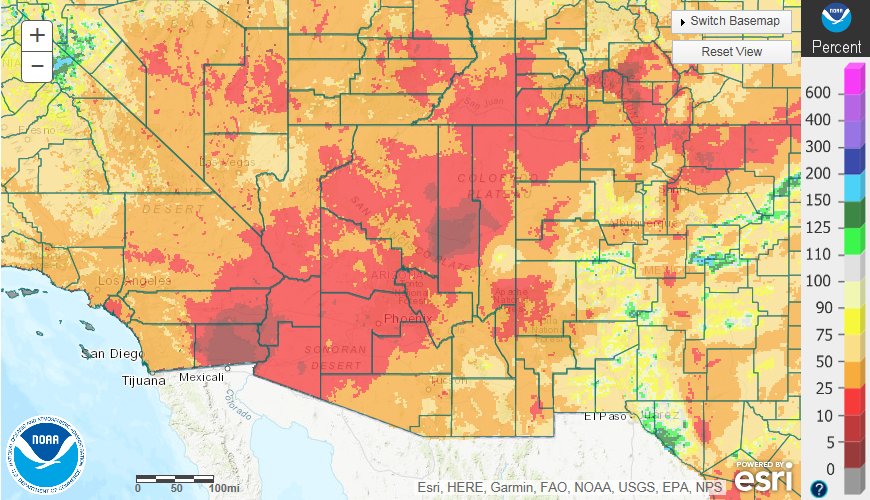
Summary: There has been little relief to drought conditions across the entire Southwest region over the past month with only spotty rain and snow. Precipitation amounts for the Water Year 2017-18 (since Oct 1st) have been paltry with many locations in Arizona sitting as one of the top 5 driest winters ever recorded. The winter season is typically a wetter period for the region, especially across the mountains of northern and eastern Arizona where snow pack is accumulated and refills reservoirs in the spring. We are now entering the drier spring season where little additional precipitation will fall until the summer monsoon. Regional precipitation deficits remain substantial, especially with respect to high elevation snow. As a result, severe to extreme drought conditions have been maintained and some areas have continued to worsen over the past month. Severe drought levels cover much of the area, and extreme drought continues to slowly grow. Even some spots of exceptional drought have started to develop.
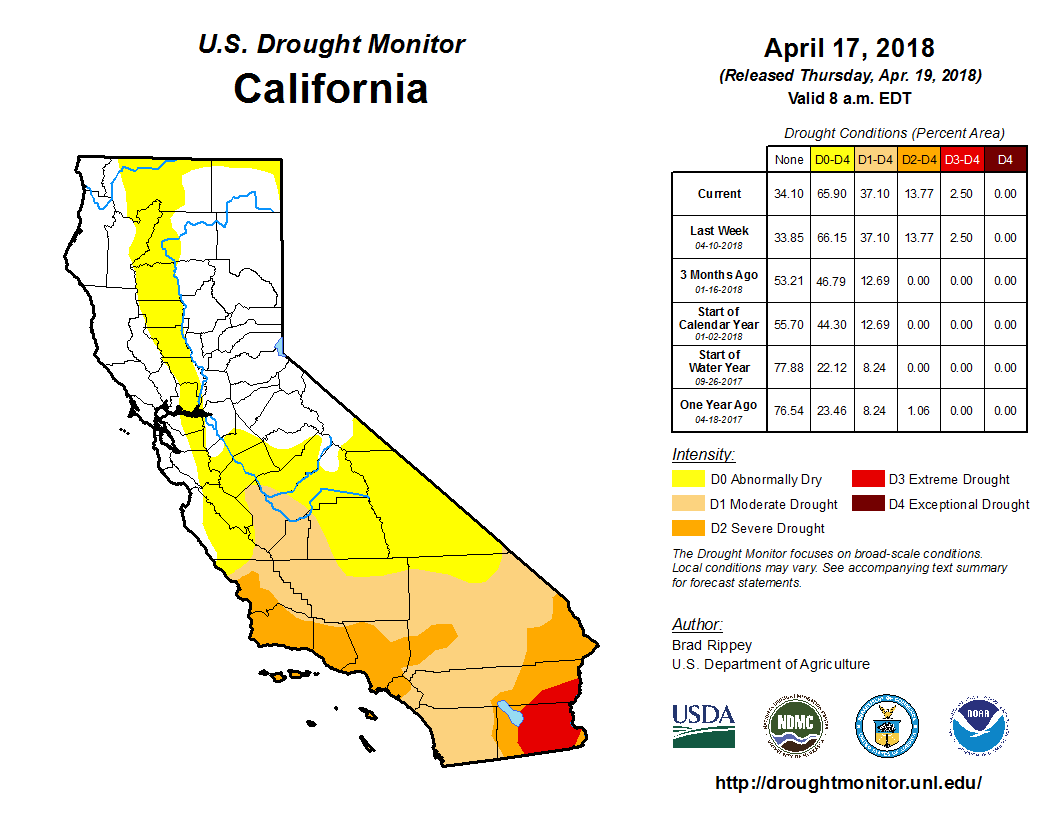
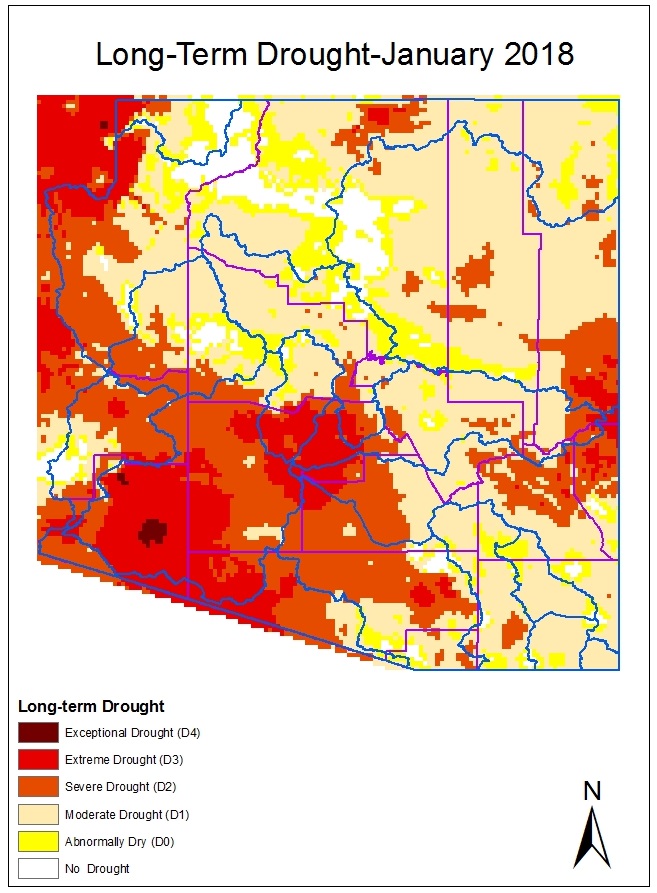
Local Area Affected: The National Drought Monitor has depicted worsening drought conditions over the region in the past several months. Extreme drought conditions still exist over a large part of Arizona, and now pockets of Exceptional Drought are being shown in areas that have the greatest precipitation deficits. Severe drought conditions exist much of the remainder Arizona, except the far northwest and southeast parts of the state where Moderate drought conditions exist. Extreme drought remains in far southeast California with Severe and Moderate drought holding firm through the rest of the southeast California deserts. Extreme Drought (D3) - across much of central, southern, and western Arizona, as well as Southeast California In Arizona: northern Maricopa, far northern Pinal, Gila, and La Paz counties In California: much of Imperial and far southeastern Riverside counties Severe Drought (D2) - across parts of central, southern, and western Arizona; as well as far southeast California In Arizona: southwest Maricopa, much of Pinal, and Yuma counties In California: western Imperial and much of eastern Riverside counties Moderate Drought (D1) - southeast California. In California: central Riverside County
Local Climatology: Below are water year precipitation totals since October 2017 and totals
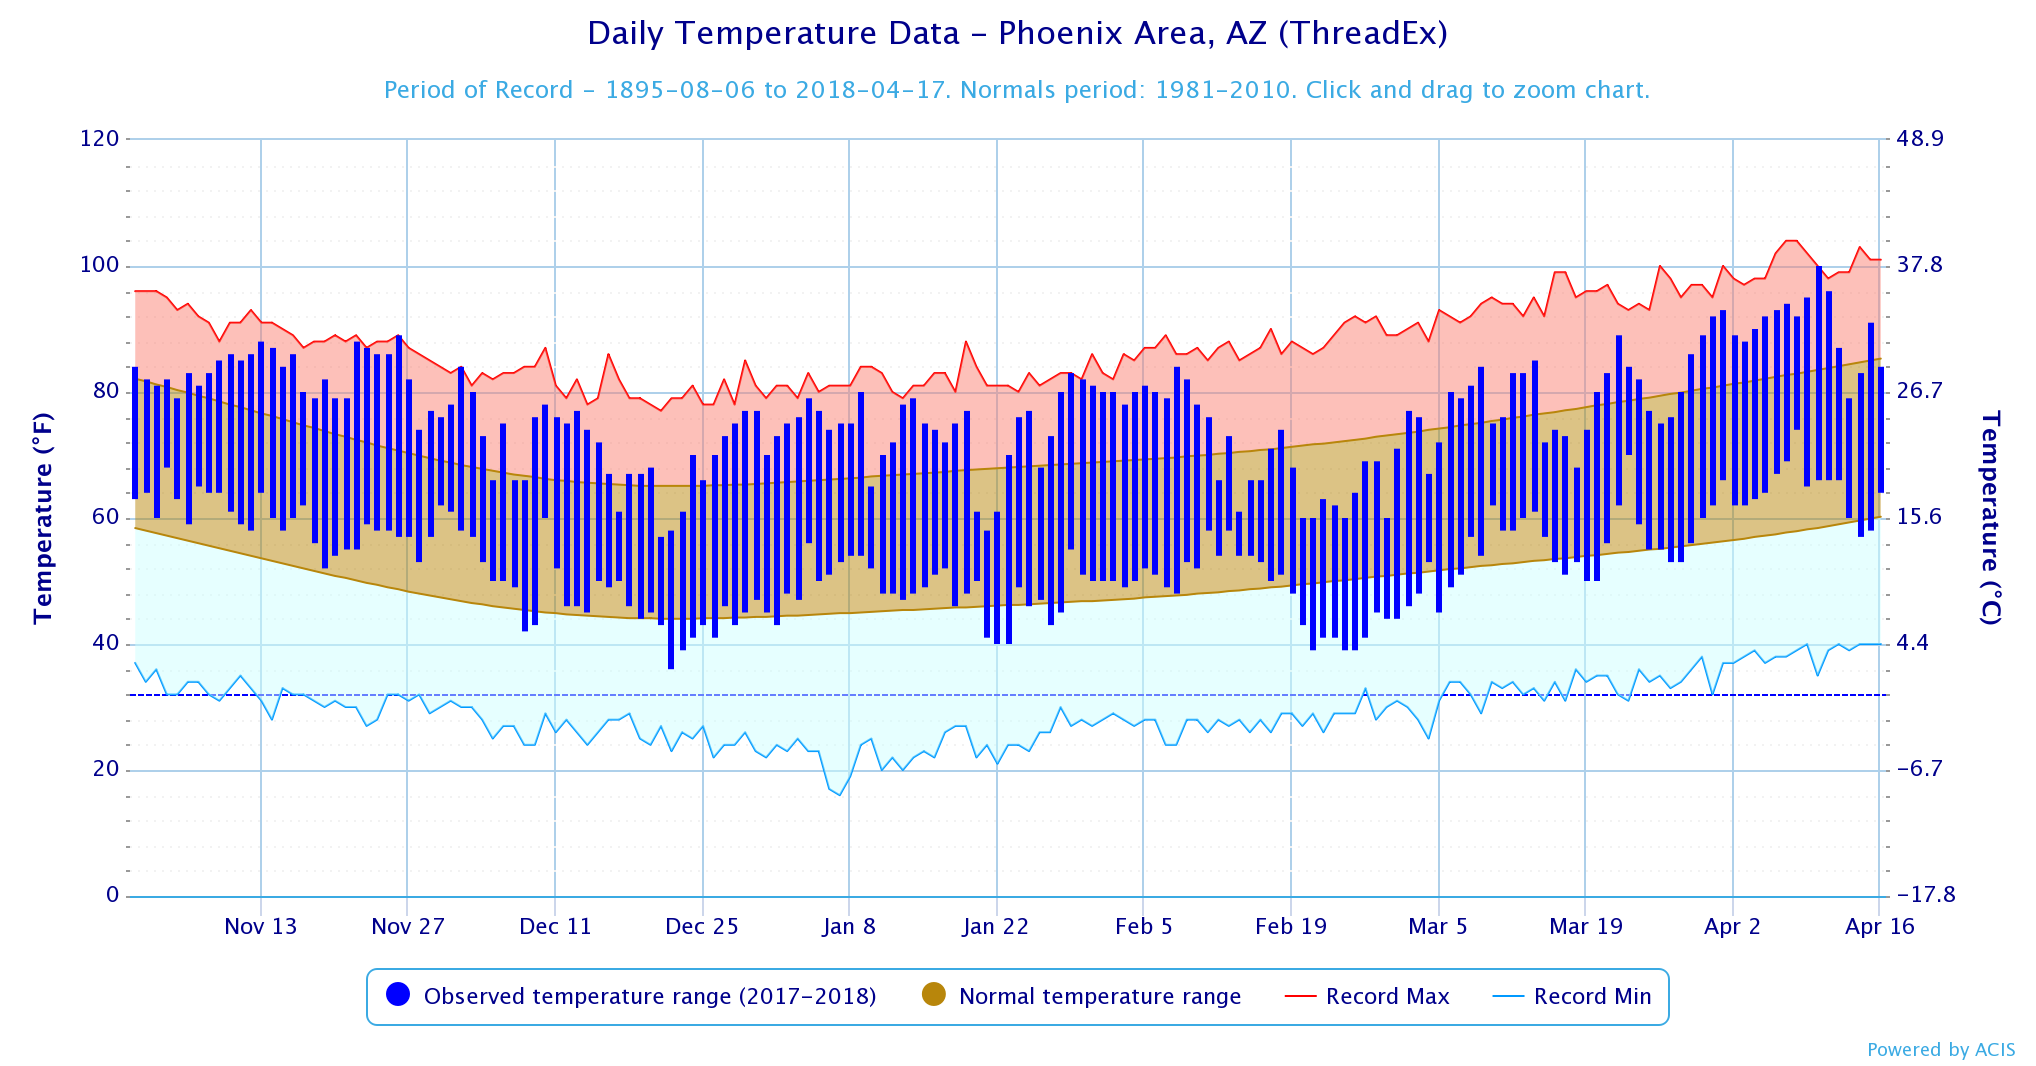
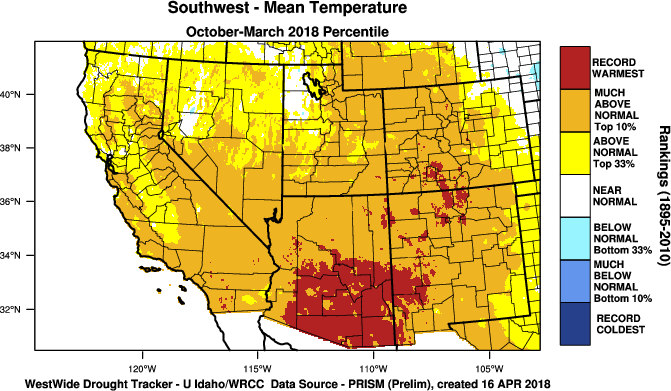
Making the lack of rain worse has been the unseasonably warm temperatures this winter. Phoenix has barely experienced temperatures below 40 degrees, and reaching near record levels has been almost as common as being near normal. This type of unusual warmth has been common across all lower elevation communities.
In fact, essentially the southern half of Arizona is experiencing its warmest Water Year (Oct 1st-Mar 31st) in recorded history (since 1895) while the entire Southwest is within the top 10% of historical Water Year rankings.
|
The U.S. Drought Monitor is a weekly collaborative effort between a number of federal agencies including NOAA/NWS, U.S. Department of Agriculture and the National Drought Mitigation Center. Details and explanations of the Drought Monitor can found at the web site: http://droughtmonitor.unl.edu/ The categories of drought are defined as follows: Moderate Drought (D1) - Some damage to crops, pastures; fire risk high; streams, reservoirs, or wells low, some water shortages developing or imminent, voluntary water use restrictions requested. Severe Drought (D2) - Crop or pasture losses likely; fire risk very high; water shortages common; water restrictions imposed. Extreme Drought (D3) - Major crop/pasture losses; extreme fire danger; widespread water shortages or restrictions. Exceptional Drought (D4) - Exceptional and widespread crop/pasture losses; exceptional fire risk; shortages of water in reservoirs, streams, and wells, creating water emergencies. |
|
State and Local Actions: A Drought Emergency Declaration remains in effect for the state of Arizona as signed by the governor in accordance with the Arizona Drought Preparedness Plan. The continuation of this Drought Emergency has been recommended by the Drought Interagency Coordinating Group in their bi-annual meeting on November 16, 2017. This recommendation is based on long term precipitation deficits, along with ongoing negative impacts across the state. In northeast Arizona, the Navajo Nation has issued an emergency drought declaration to deal with severe drought conditions.
|
Additional information concerning the drought in Arizona can be obtained via the Arizona Department of Water Resources web site at: https://new.azwater.gov/drought Additional information concerning the drought in California can be obtained via the California Department of Water Resources web site at: |
|
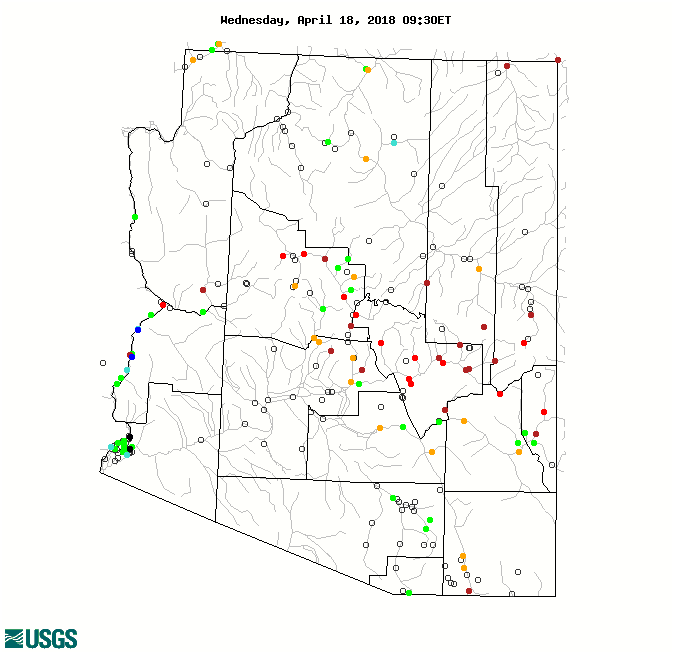
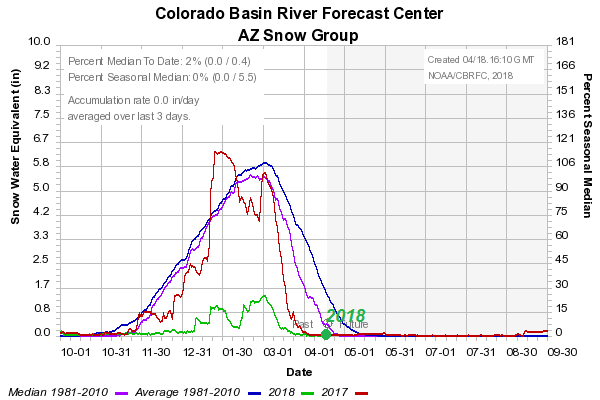
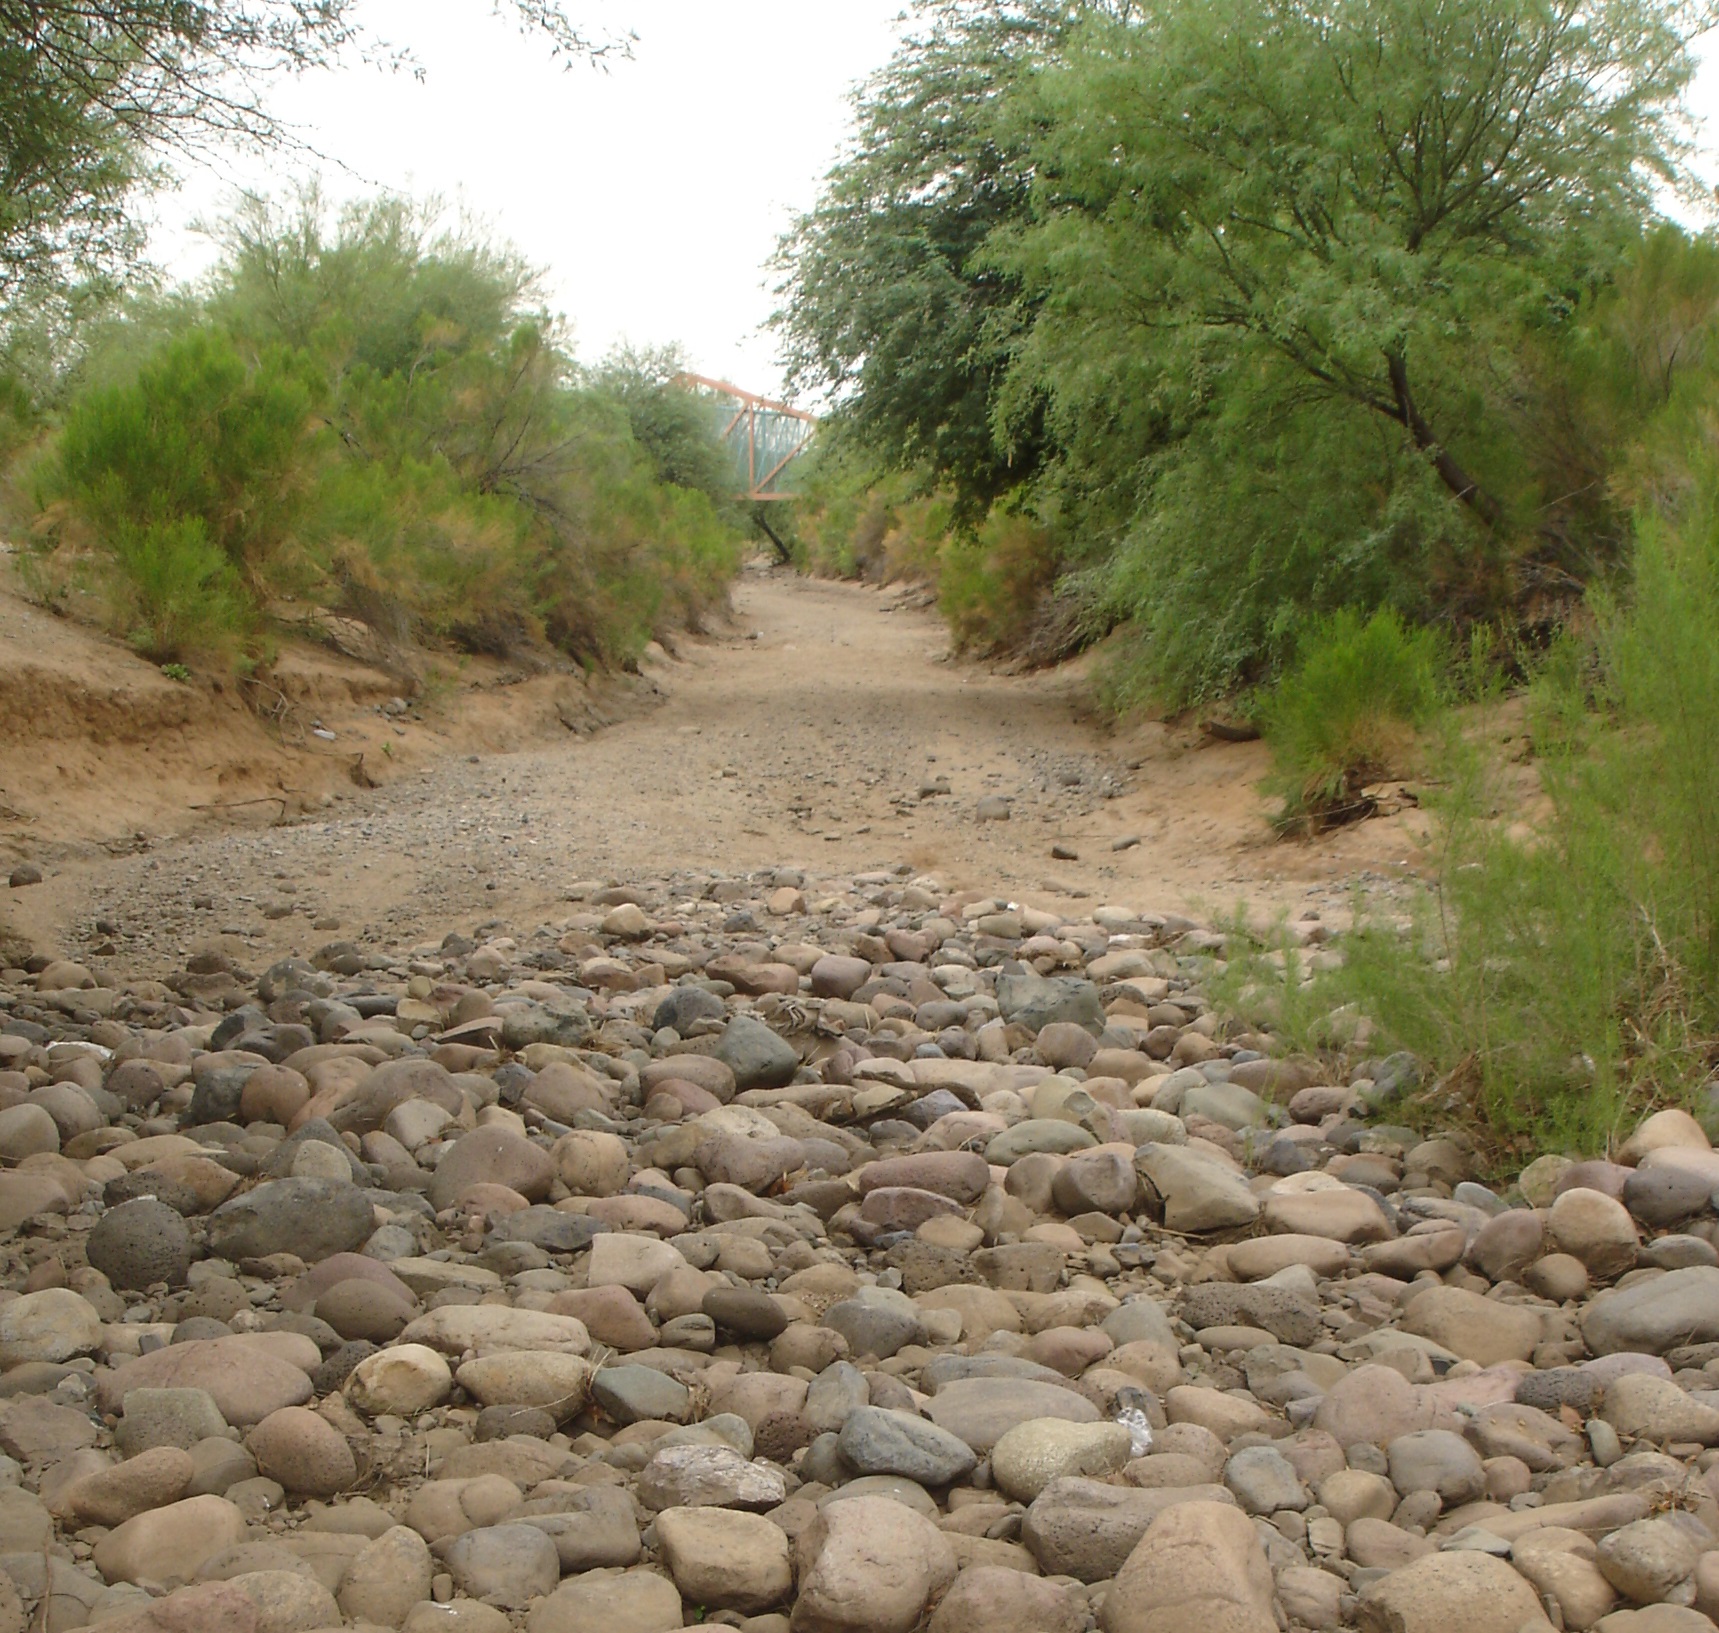
River, Stream Flow, and Reservoir Conditions: Most smaller, unregulated rivers through the state of Arizona are flowing at much below average rates with unusually low rain or snow amounts over the past 5 months or more. Many of these smaller rivers and stream are flowing below the 10th percentile for this time of year. The only real exception has been parts of SE Arizona where one very beneficial storm system in February greatly aided in stream flow. Larger regulated rivers, including much of the Colorado River, remain in a near to normal flow rate due to management efforts.
Reservoir levels at this point of the year have fallen well below levels at the same time last year. The mountain snow pack above these reservoirs is also far less than last year with the snow season just about over. Runoff will be well below average for the remainder of the spring and additional reservoir re-charge will be minimal this year.
|
Hourly and forecast river stages out to 90 days can be found at the National Weather Service's (NWS) Advanced Hydrologic Prediction Service (AHPS) web page: http://water.weather.gov/ahps2/index.php?wfo=psr Additional Current stream and river stages may be viewed at the following USGS Web Site: |
|
Agriculture Impacts: With prolonged drought conditions, impacts have included increased water hauling necessary for farmers and ranchers, distressed vegetation, and loss of forage acreage. Most new forage areas are completely absent this year, and there have been reports in NW Arizona of evergreens dying due to lack of moisture. Livestock on regional ranches have suffered the greatest impacts from drought conditions and many ranchers are considering selling off higher amounts of their herds this spring. Range land and pasture conditions have worsened substantially in the past couple months after monsoon rains stopped early and winter rain and snow have been lacking. 86% of the area pasture and range land has been rated poor or very poor versus 57% one month ago and just 19% at this time last year. |
For additional information on agriculture impacts may be viewed at the United States Department of Agriculture (USDA) National Agricultural Statistics Service NASS Web Site: |
|
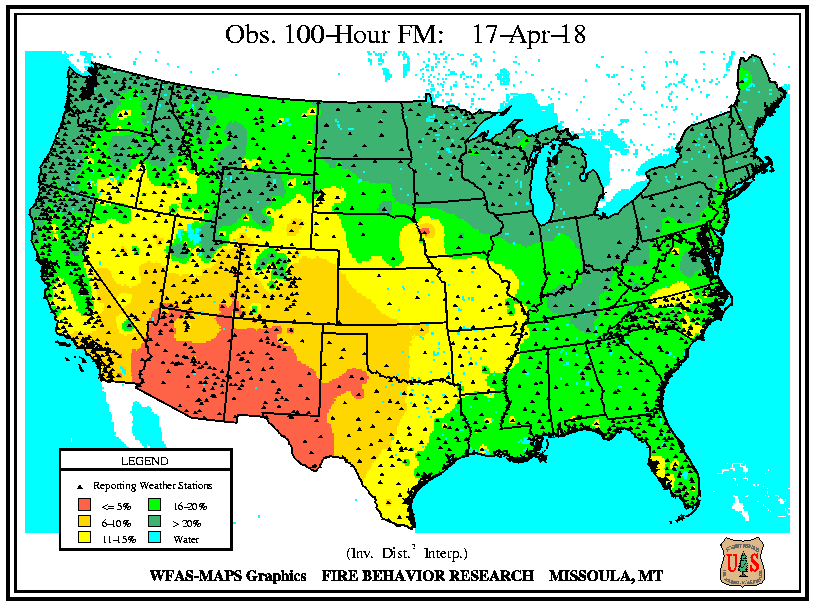
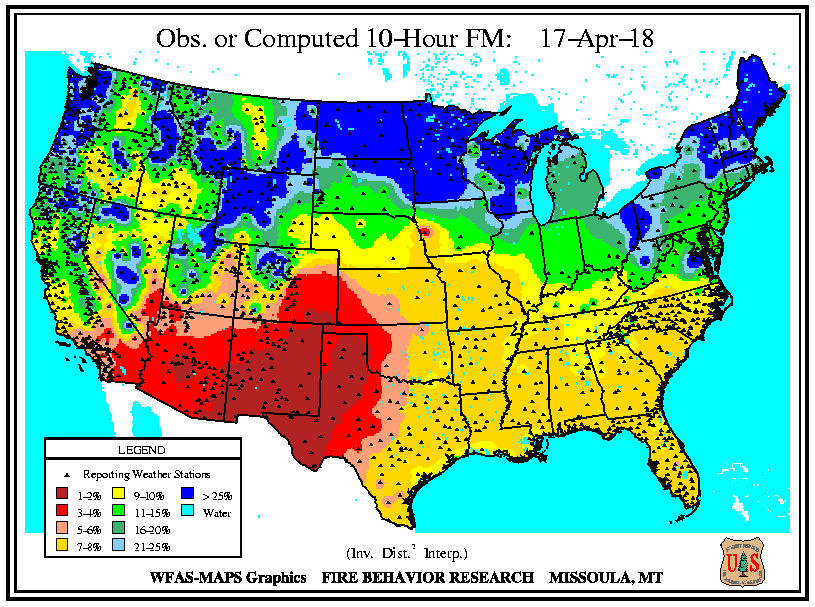
Fire Danger Hazards: The National Fire Danger Rating: High to Very High category for the entire area The current KDBI: Southwest Arizona and southeast California: Ranging from Extreme in SE California and SW Arizona to High towards central Arizona.
Abnormally dry conditions have pushed 100-hour dead fuel moisture values further down below 5% for almost all of the Southwest. The smaller sized 10-hour dead fuel moisture values in a 3-4% range have expanded throughout much of the region as well. Even pockets of the worst 1-2% moisture values are showing up around the area. These fuel moisture values are more indicative of values typically seen in the beginning of June versus April. Not surprisingly, wildfires have been more prevalent early this spring than is usual. The combination of these increasingly dry fuels may lead to enhanced fire behavior in the future should dry and windy weather conditions develop later in the spring.
|
The Keetch-Byram Drought Index (KBDI) is a drought index that is specifically related to fire potential. The KDBI is broken into four categories which indicate the susceptibility of ground fuels to fire danger. Below are the four categories and a brief description of each.
KBDI and Dead Fuel Moisture data can be found on the Wildland Fire Assessment System (WFAS) web site at: |
||||||||||||
|
Precipitation/Temperature Outlooks: The 8-14 day temperature outlook for April 26-May 2 period calls for slightly better chances of above average temperatures and precipitation likely not too far from average. The 30 day outlook for May 2018 (not shown) indicates better chances for above average temperatures and equal chances for above, below, or near average precipitation (which is close to nothing for much of the state anyways). The 90 day outlook for the period May through July 2018 indicates much better chances for above average temperatures and equal chances of above, below, or near average precipitation.
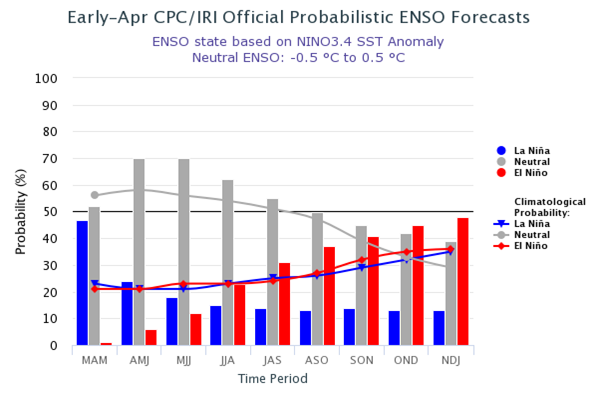
La Nina conditions are weakening fairly rapidly this spring; and a transition to neutral conditions will occur over the next several months. This La Nina likely has exhibited some influence on the drier winter, however will exhibit little influence for the remainder of the spring as the signal wanes. Once the shift to neutral conditions occurs, any predictable influence of this cycle will be negligible. There is little to no evidence suggesting whether the upcoming summer monsoon season would be wetter or drier than normal.
|
For updated temperature and precipitation probabilities consult the following Climate Prediction Center (CPC) Web Sites: 8 to 14 Day Outlook: http://www.cpc.ncep.noaa.gov/ 30 Day Outlook: http://www.cpc.ncep.noaa.gov 90 Day Outlook: |
|
Questions or Comments: If you have any questions or comments about this information |
Other Contacts: For state climate impacts: http://www.stateclimate.org |
|
Acknowledgements: The Drought Monitor is a multi-agency effort involving NOAA’s National |
Related Websites : NWS - http://www.weather.gov/phoenix CPC - http://www.cpc.ncep.noaa.gov Drought Monitor - http://droughtmonitor.unl.edu/ |