ONLY MODEST IMPROVEMENTS TO DROUGHT CONDITIONS AS THE MONSOON BEGINS IN EARNEST
|
 |
|
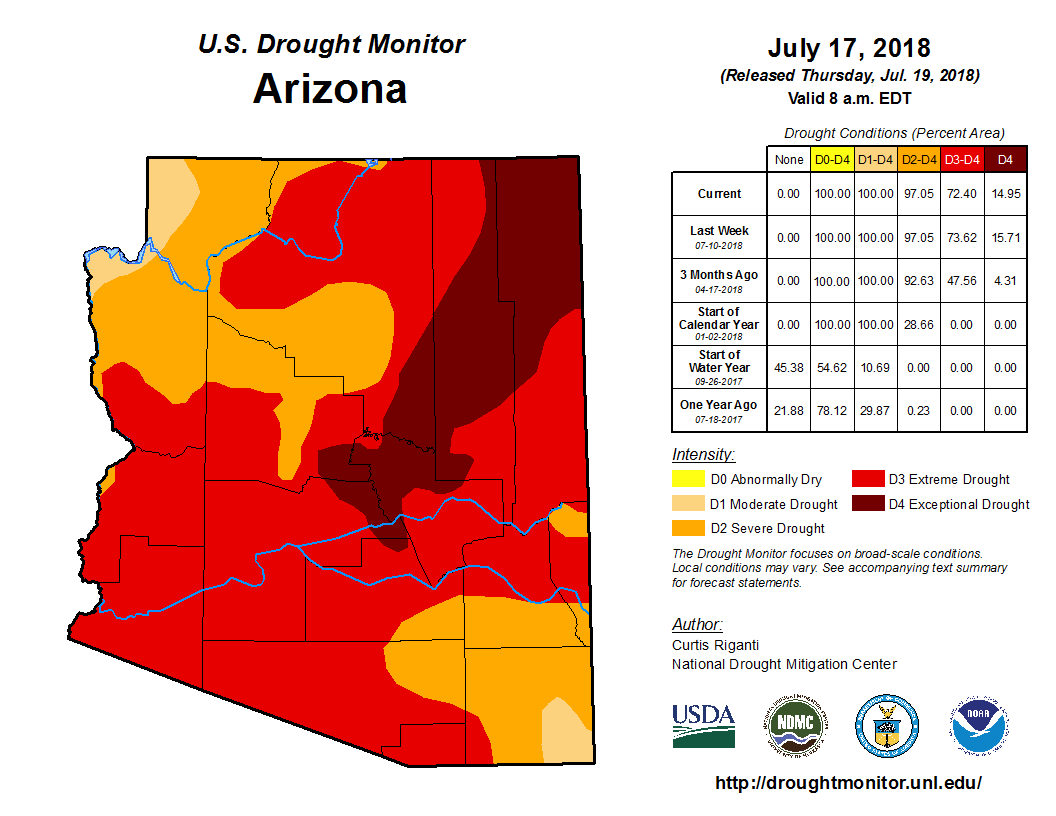
Summary: Over the past several weeks, showers and thunderstorms have become more widespread across the region yielding locally generous rainfall for many locations. Northern Arizona has been the beneficiary of the heaviest rains resulting in localized flooding and some relief from drought conditions. However as is typical with summer thunderstorms, rainfall coverage has not been uniform and not all aspects of drought impacts are alleviated by these brief, heavy rains. In addition, precipitation deficits and impacts from drought have been so extreme since last year, this beneficial rain has only started the drought relief process. As a result, extreme and exceptional drought conditions have persisted over much of the area with only modest improvements where the heaviest rainfall has occurred. A continuation of frequent, widespread rain will be necessary the remainder of the summer for more expansive improvement in drought conditions.
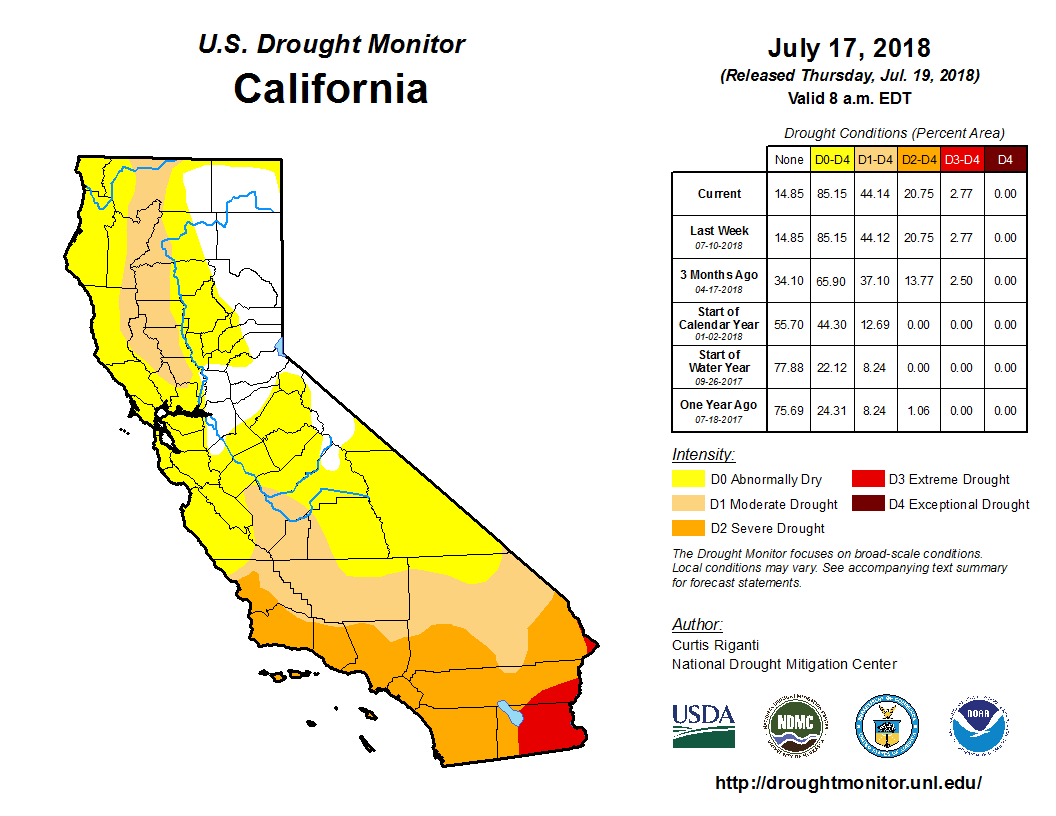
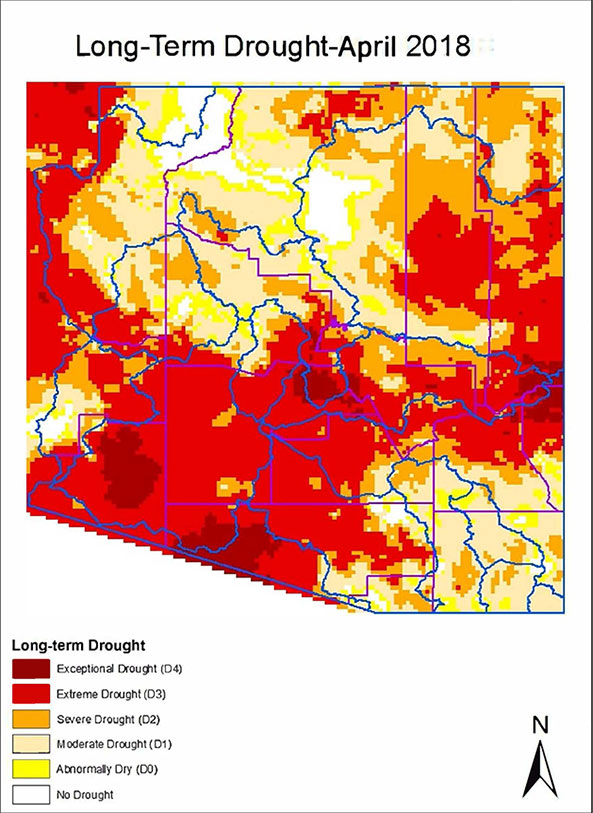
Local Area Affected: The National Drought Monitor depicts only minor improvement to drought conditions in the past month. Extreme and Exceptional drought conditions continue to persist over a large part of Arizona. Severe drought conditions exist much of the remainder Arizona, except the far northwest and southeast parts of the state where Moderate drought conditions exist. Extreme drought remains in parts of far southeast California with Severe drought holding firm through the rest of the southeast California deserts. Exceptional Drought (D4) - across parts of central Arizona In Arizona: far eastern Maricopa and part of Gila counties Extreme Drought (D3) - across much of central, southern, and western Arizona, as well as Southeast California In Arizona: Maricopa, northern Pinal, southern Gila, La Paz, and Yuma counties In California: much of Imperial and far southeastern Riverside counties Severe Drought (D2) - southeast California In California: far western Imperial and much of eastern Riverside counties
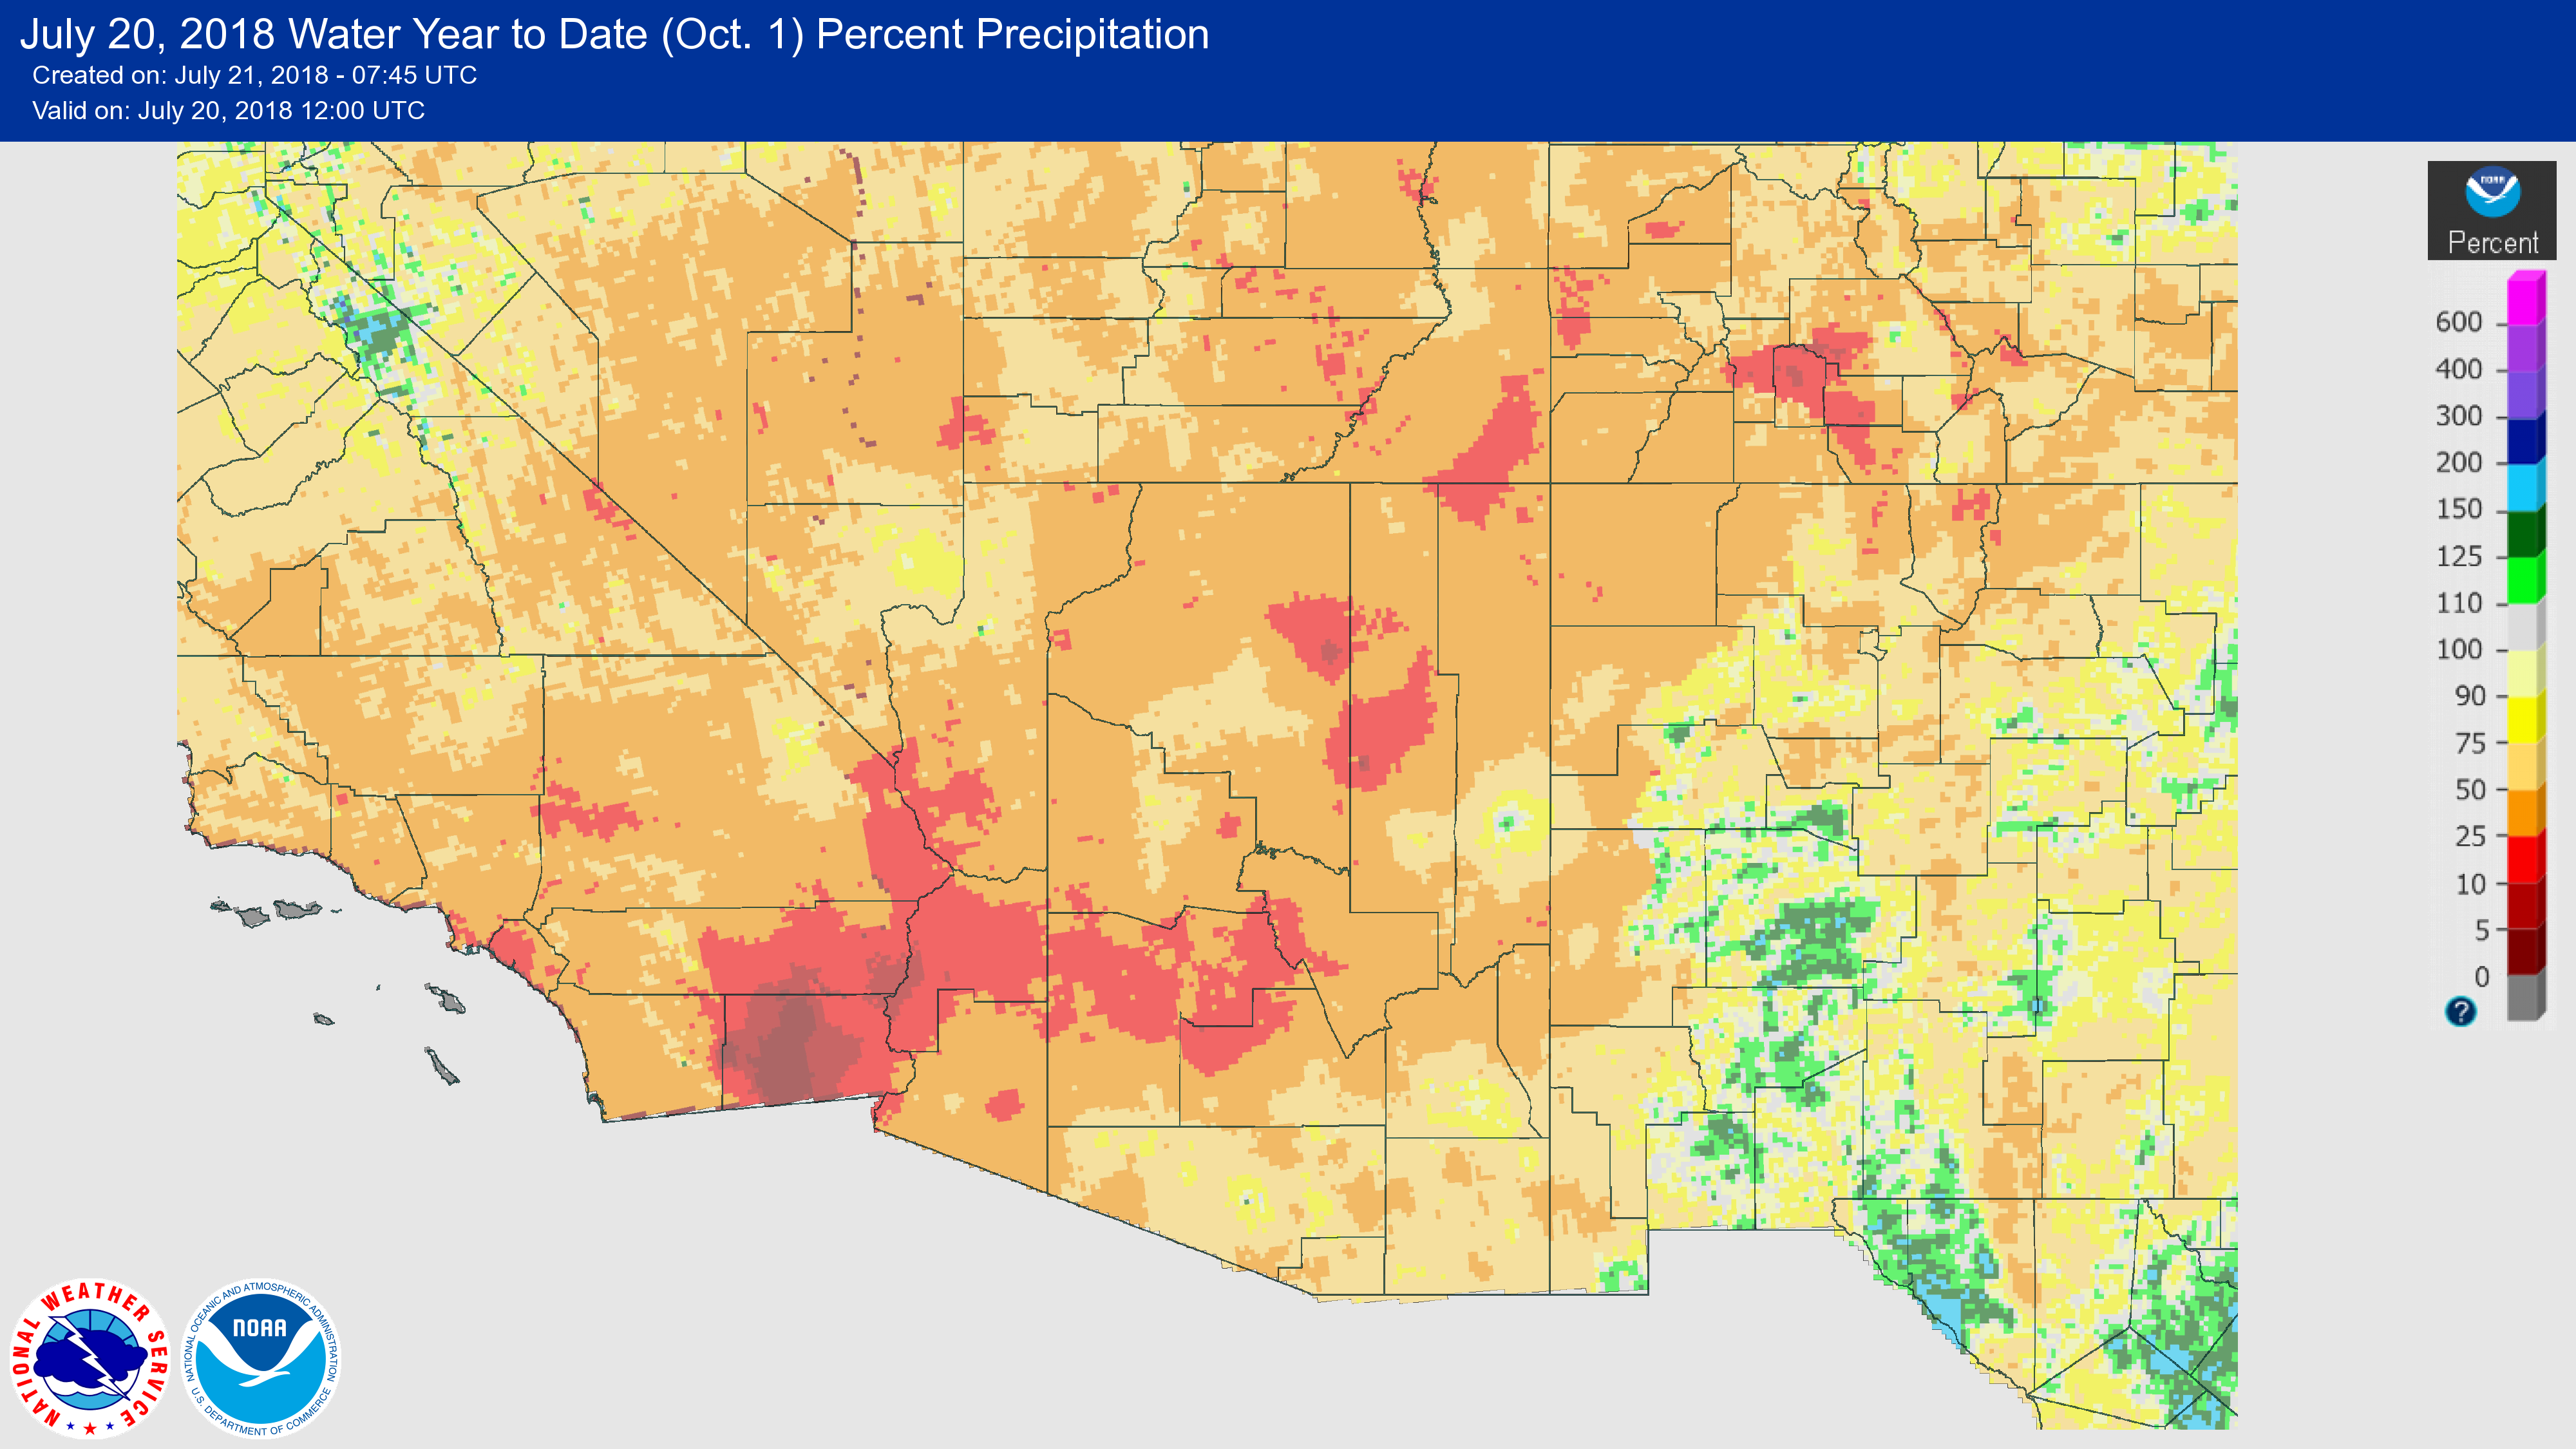
Local Climatology: Below are water year precipitation totals since October 2017 and totals
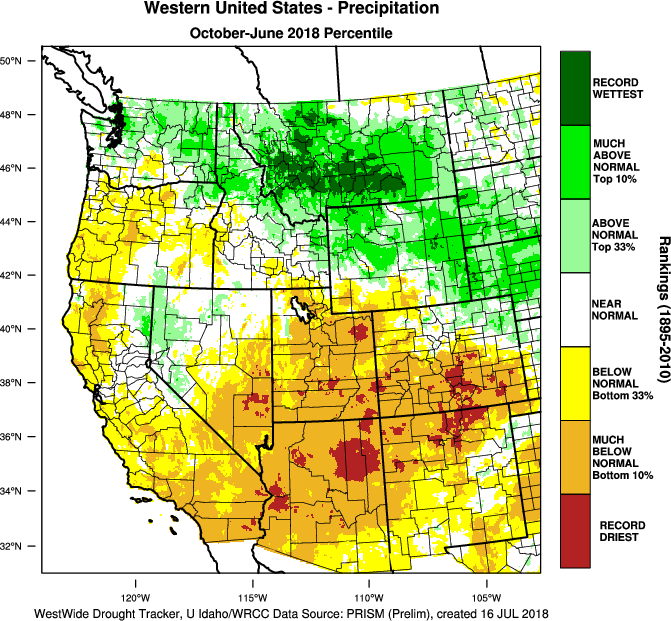
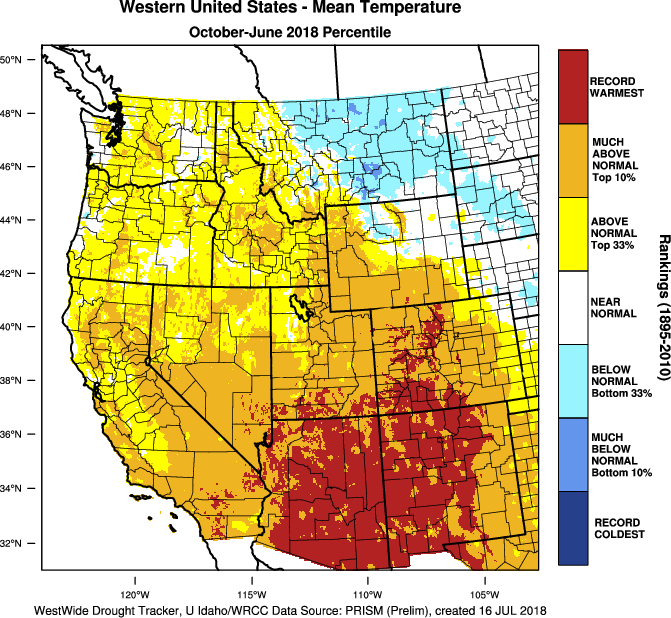
The drought conditions have been exacerbated by the fact that the majority of Arizona (and a good deal of the entire Southwest) is experiencing its warmest Water Year (Oct 1st-June 30th) in recorded history (since 1895).
|
The U.S. Drought Monitor is a weekly collaborative effort between a number of federal agencies including NOAA/NWS, U.S. Department of Agriculture and the National Drought Mitigation Center. Details and explanations of the Drought Monitor can found at the web site: http://droughtmonitor.unl.edu/ The categories of drought are defined as follows: Moderate Drought (D1) - Some damage to crops, pastures; fire risk high; streams, reservoirs, or wells low, some water shortages developing or imminent, voluntary water use restrictions requested. Severe Drought (D2) - Crop or pasture losses likely; fire risk very high; water shortages common; water restrictions imposed. Extreme Drought (D3) - Major crop/pasture losses; extreme fire danger; widespread water shortages or restrictions. Exceptional Drought (D4) - Exceptional and widespread crop/pasture losses; exceptional fire risk; shortages of water in reservoirs, streams, and wells, creating water emergencies. |
|
State and Local Actions: A Drought Emergency Declaration remains in effect for the state of Arizona as signed by the governor in accordance with the Arizona Drought Preparedness Plan. The continuation of this Drought Emergency has been recommended by the Drought Interagency Coordinating Group in their bi-annual meeting on May 29, 2018. This recommendation is based on long term precipitation deficits, along with ongoing negative impacts across the state. In northeast Arizona, the Navajo Nation has issued an emergency drought declaration to deal with extreme drought conditions.
|
Additional information concerning the drought in Arizona can be obtained via the Arizona Department of Water Resources web site at: https://new.azwater.gov/drought Additional information concerning the drought in California can be obtained via the California Department of Water Resources web site at: |
|
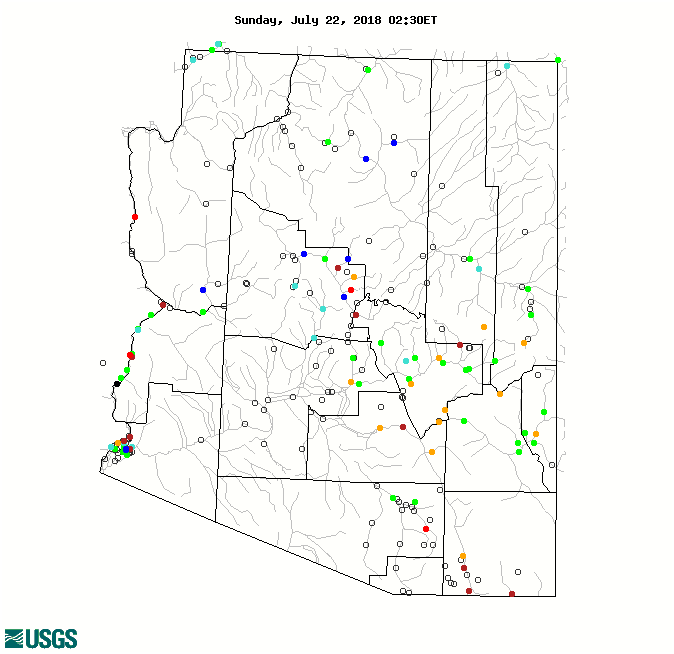
River, Stream Flow, and Reservoir Conditions: Many smaller unregulated streams have responded to the early monsoon rainfall, though there is a wide range in flows obviously depending on proximity to the more prolific storms. This range of much below to much above seasonal flow rate is quite typical during the monsoon season. Otherwise, much of the Colorado River and other highly regulated rivers remain in a near normal flow rates due to ongoing management efforts.
Reservoir levels remain well below levels at the same time last year, and similar to levels in 2016. Runoff has been near record low levels and additional reservoir re-charge will be minimal this year as monsoon season rains typical only offer limited benefits.
|
Hourly and forecast river stages out to 90 days can be found at the National Weather Service's (NWS) Advanced Hydrologic Prediction Service (AHPS) web page: http://water.weather.gov/ahps2/index.php?wfo=psr Additional Current stream and river stages may be viewed at the following USGS Web Site: |
|
Agriculture Impacts: With prolonged drought conditions, impacts have included increased water hauling necessary for farmers and ranchers, distressed vegetation, and loss of forage acreage. Reports around the state indicate stock tank water has now become nearly non-existent requiring extensive water hauling. Livestock on regional ranches have suffered the greatest impacts from drought and many ranchers are selling off higher amounts of their herds this year. With recent rainfall, range land and pasture conditions have shown local improvements. However, 88% of the area pasture and range land still is rated poor or very poor. Just one month ago, around 90% of range land was rated poor or very poor versus just 53% at this time last year. |
For additional information on agriculture impacts may be viewed at the United States Department of Agriculture (USDA) National Agricultural Statistics Service NASS Web Site: |
|
Fire Danger Hazards: The National Fire Danger Rating: Low to Moderate category for the entire area The current KDBI: Southwest Arizona and southeast California: Ranging from Extreme in SE California and much of SW Arizona to High towards central Arizona, and Moderate in the higher elevations north and east of Phoenix
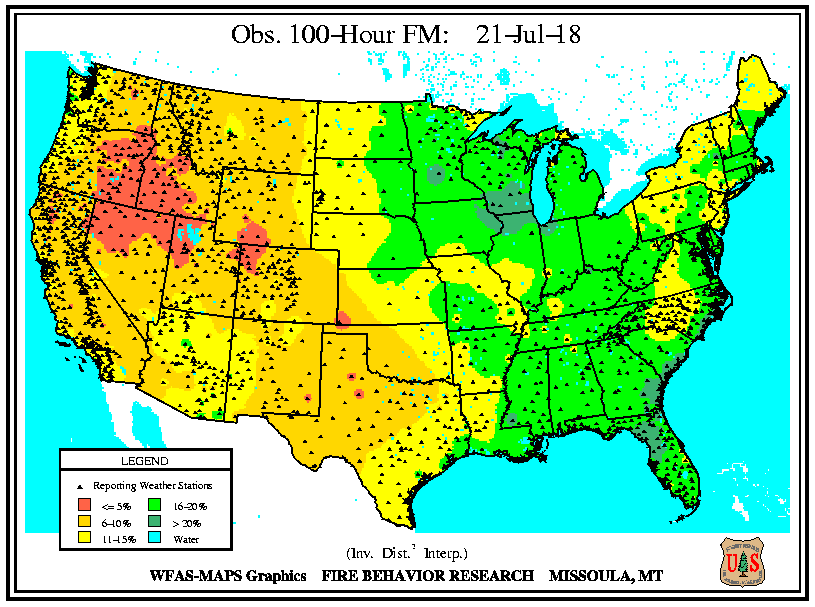
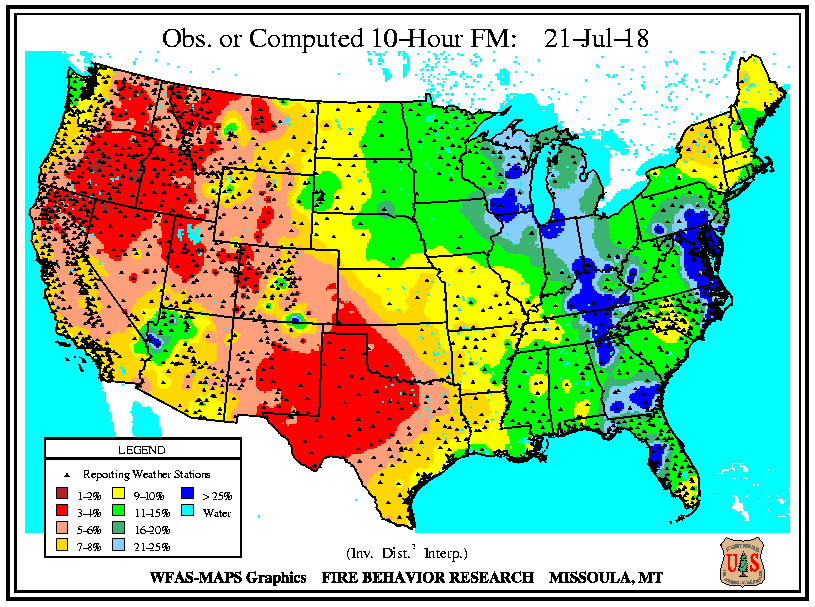
Recent rainfall and larger increases in humidity levels have allowed 100-hour dead fuel moisture values to improve above 5% for lower elevations of SE California and central Arizona, and even higher levels above 10% at higher elevation locations. Smaller sized 10-hour dead fuel moisture values have also seen vast improvements above 5% for much of the area. Locations that have experienced even heavier rainfall have seen even higher moisture levels. The spring wildfire season was somewhat more active this year. However, preventative efforts such as closing large portions of state lands along with fairly tranquil weather conditions precluded a worse fire season with no single large acreage, high intensity incidents. The increased rainfall and humidity levels of the monsoon season have allowed state lands to be re-opened, and minimal fire activity should be expected for the remainder of the summer.
|
The Keetch-Byram Drought Index (KBDI) is a drought index that is specifically related to fire potential. The KDBI is broken into four categories which indicate the susceptibility of ground fuels to fire danger. Below are the four categories and a brief description of each.
KBDI and Dead Fuel Moisture data can be found on the Wildland Fire Assessment System (WFAS) web site at: |
||||||||||||
|
Precipitation/Temperature Outlooks: The 8-14 day temperature outlook for July 28-Aug 3 period calls for much better chances of above average temperatures and a very slight chance of above average rainfall. The 30 day outlook for August 2018 (not shown) indicates only a modest chance for above average temperatures and above average precipitation. The 90 day outlook for the period August through October 2018 indicates better chances for above average temperatures and enhanced odds of above average precipitation.
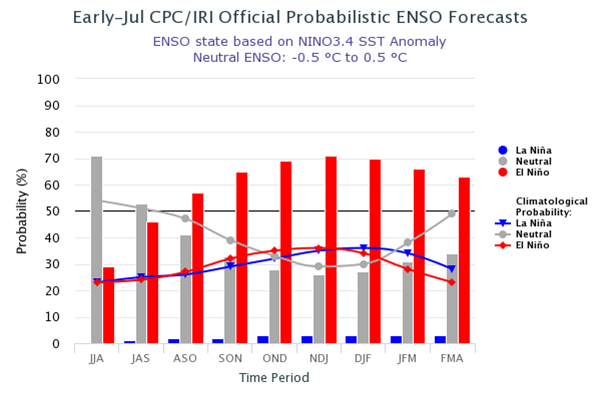
With a fairly good start to the monsoon season, model based evidence continues to suggest the remainder of the monsoon season would trend towards wetter than normal over a larger scale. However as is typical with summer thunderstorms, rainfall amounts can be highly variable over small distances and not everyone should expect plentiful rainfall all summer. ENSO has little overall impact on monsoon season patterns, through the current neutral state should begin transitioning to an El Nino episode later this year. Confidence is growing that equatorial Pacific sea surface temperatures will reach El Nino thresholds by the fall season and peak during the winter. It is likely that weak to moderate El Nino conditions will exist later this year. While many other factors contribute to the atmospheric circulation pattern, there may be a slight tilting of the odds towards wetter conditions later in the year.
|
For updated temperature and precipitation probabilities consult the following Climate Prediction Center (CPC) Web Sites: 8 to 14 Day Outlook: http://www.cpc.ncep.noaa.gov/ 30 Day Outlook: http://www.cpc.ncep.noaa.gov 90 Day Outlook: |
|
Questions or Comments: If you have any questions or comments about this information |
Other Contacts: For state climate impacts: http://www.stateclimate.org |
|
Acknowledgements: The Drought Monitor is a multi-agency effort involving NOAA’s National |
Related Websites : NWS - http://www.weather.gov/phoenix CPC - http://www.cpc.ncep.noaa.gov Drought Monitor - http://droughtmonitor.unl.edu/ |