CONTINUED LOCAL DROUGHTIMPROVEMENT IN NOVEMBER
|
 |
|
Summary: After a favorable weather pattern yielded several heavy rainfall events across much of the Southwest United States during the first half of October, conditions became much drier in November with only localized rainfall across the region. As a result, very little additional drought improvement was realized with only very minor changes in the past month. The heavy October rains helped both short term rangeland conditions and streamflow through much of Arizona. Soil moisture profiles and fire weather conditions also correspondingly improved. The cooler fall weather allowed these impact groups to stabilize during November with little to no improvement or degradation despite the lack of rain or snow. Greater improvements to longer term water resources will still require adequate winter rain and snow given the prolonged regional drought.
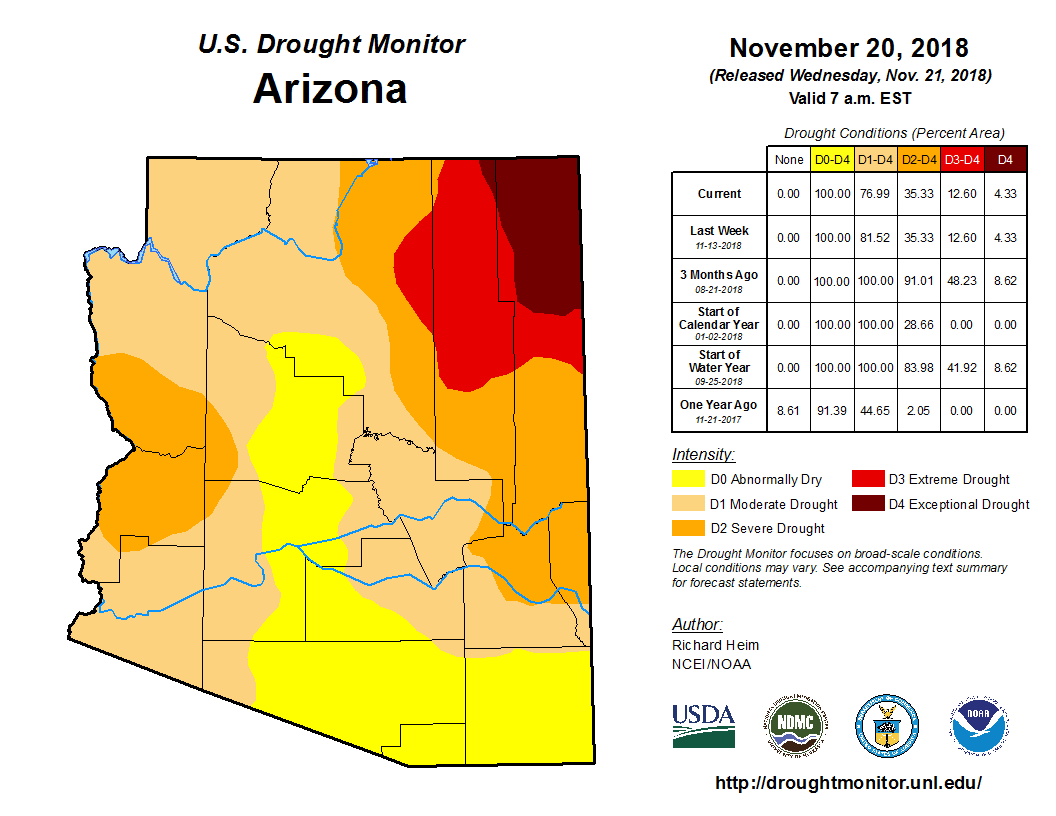
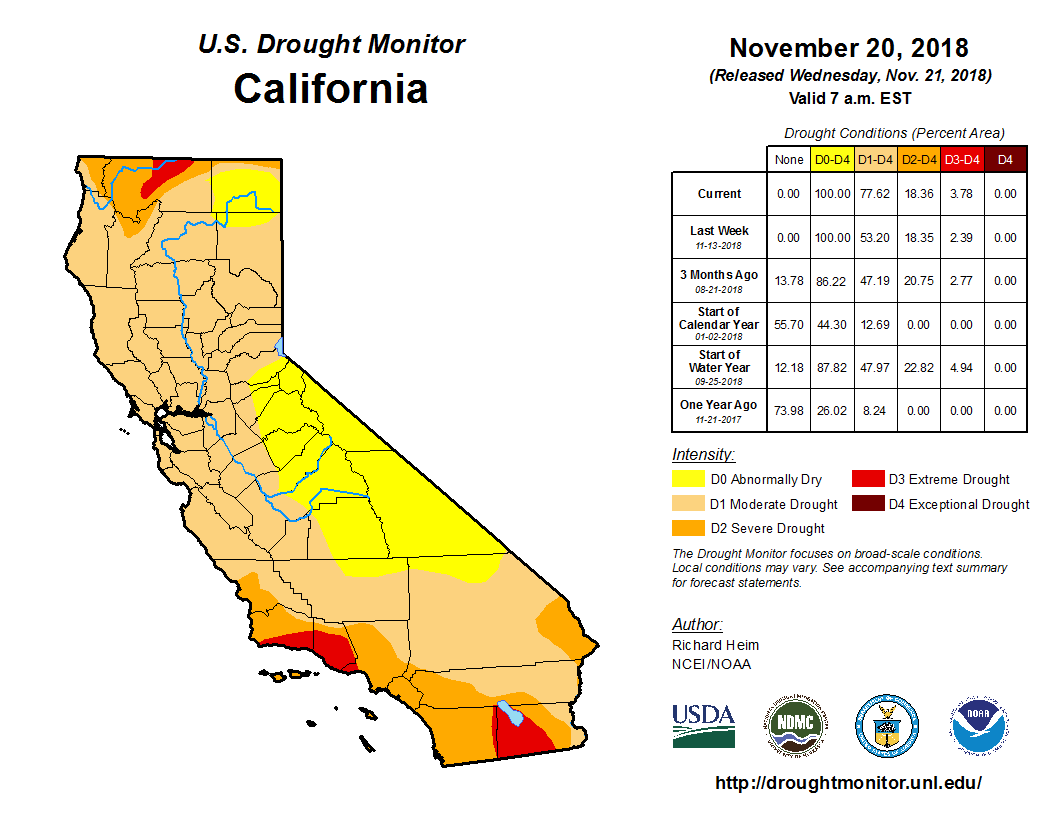
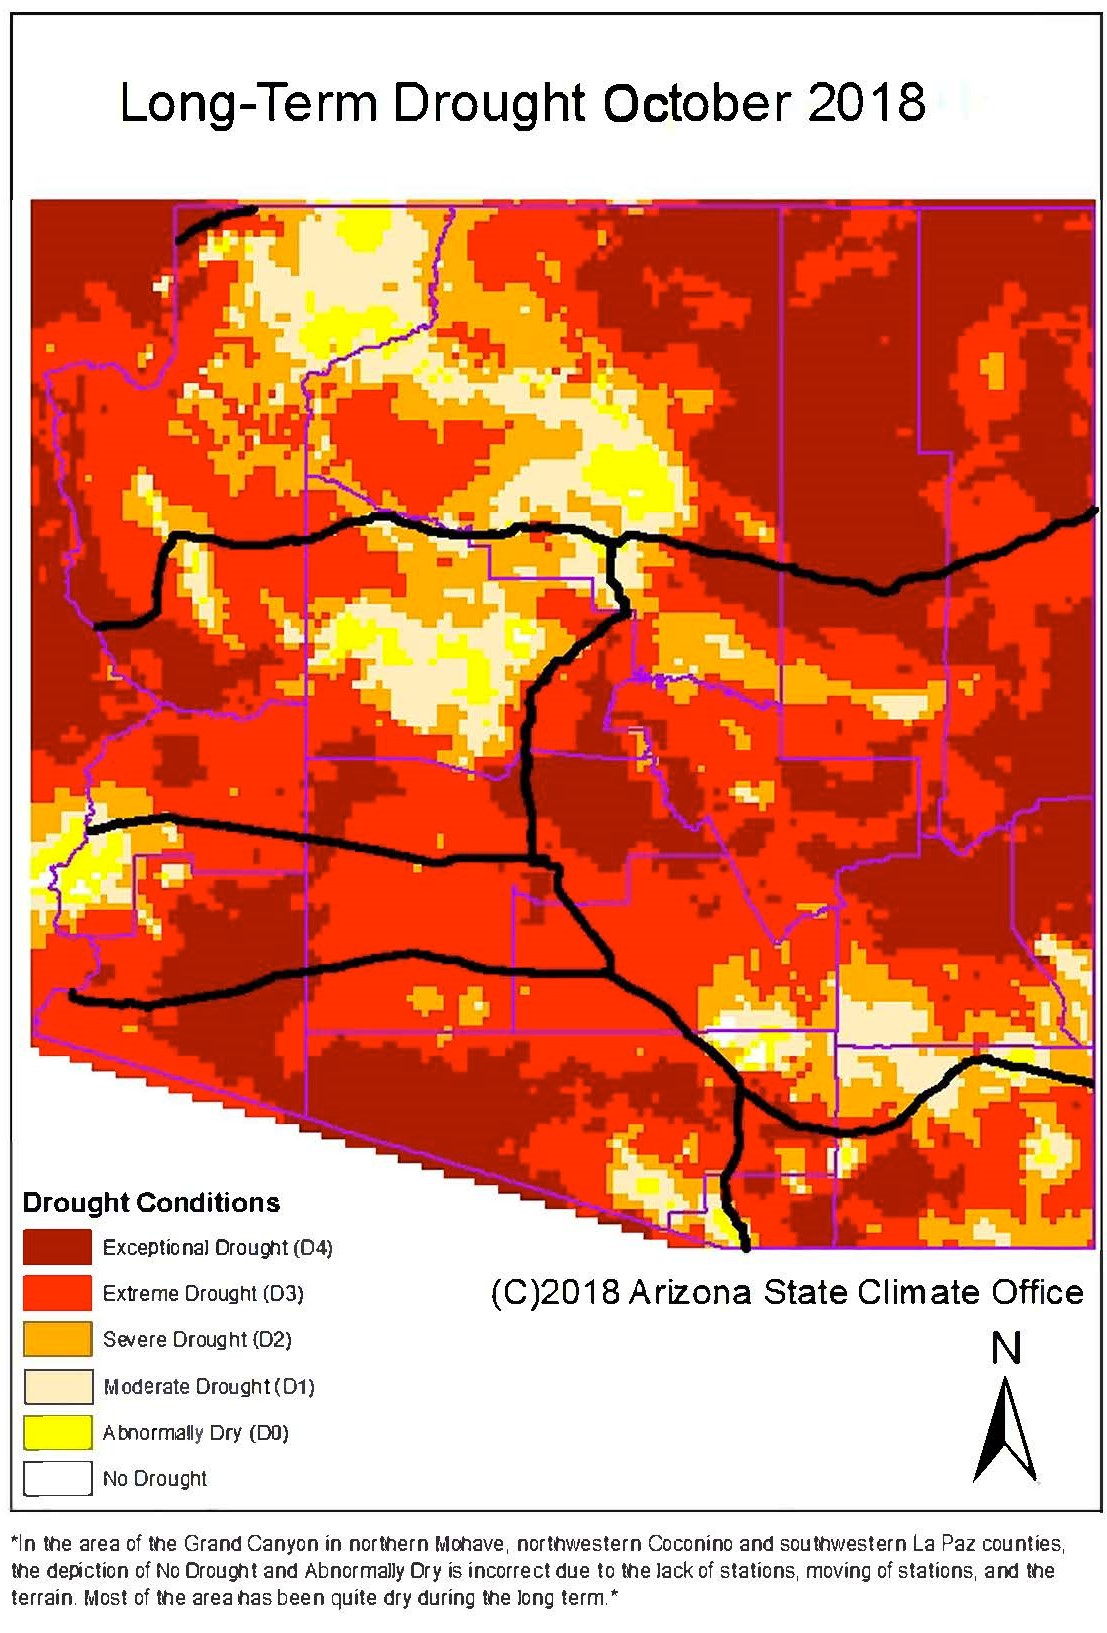
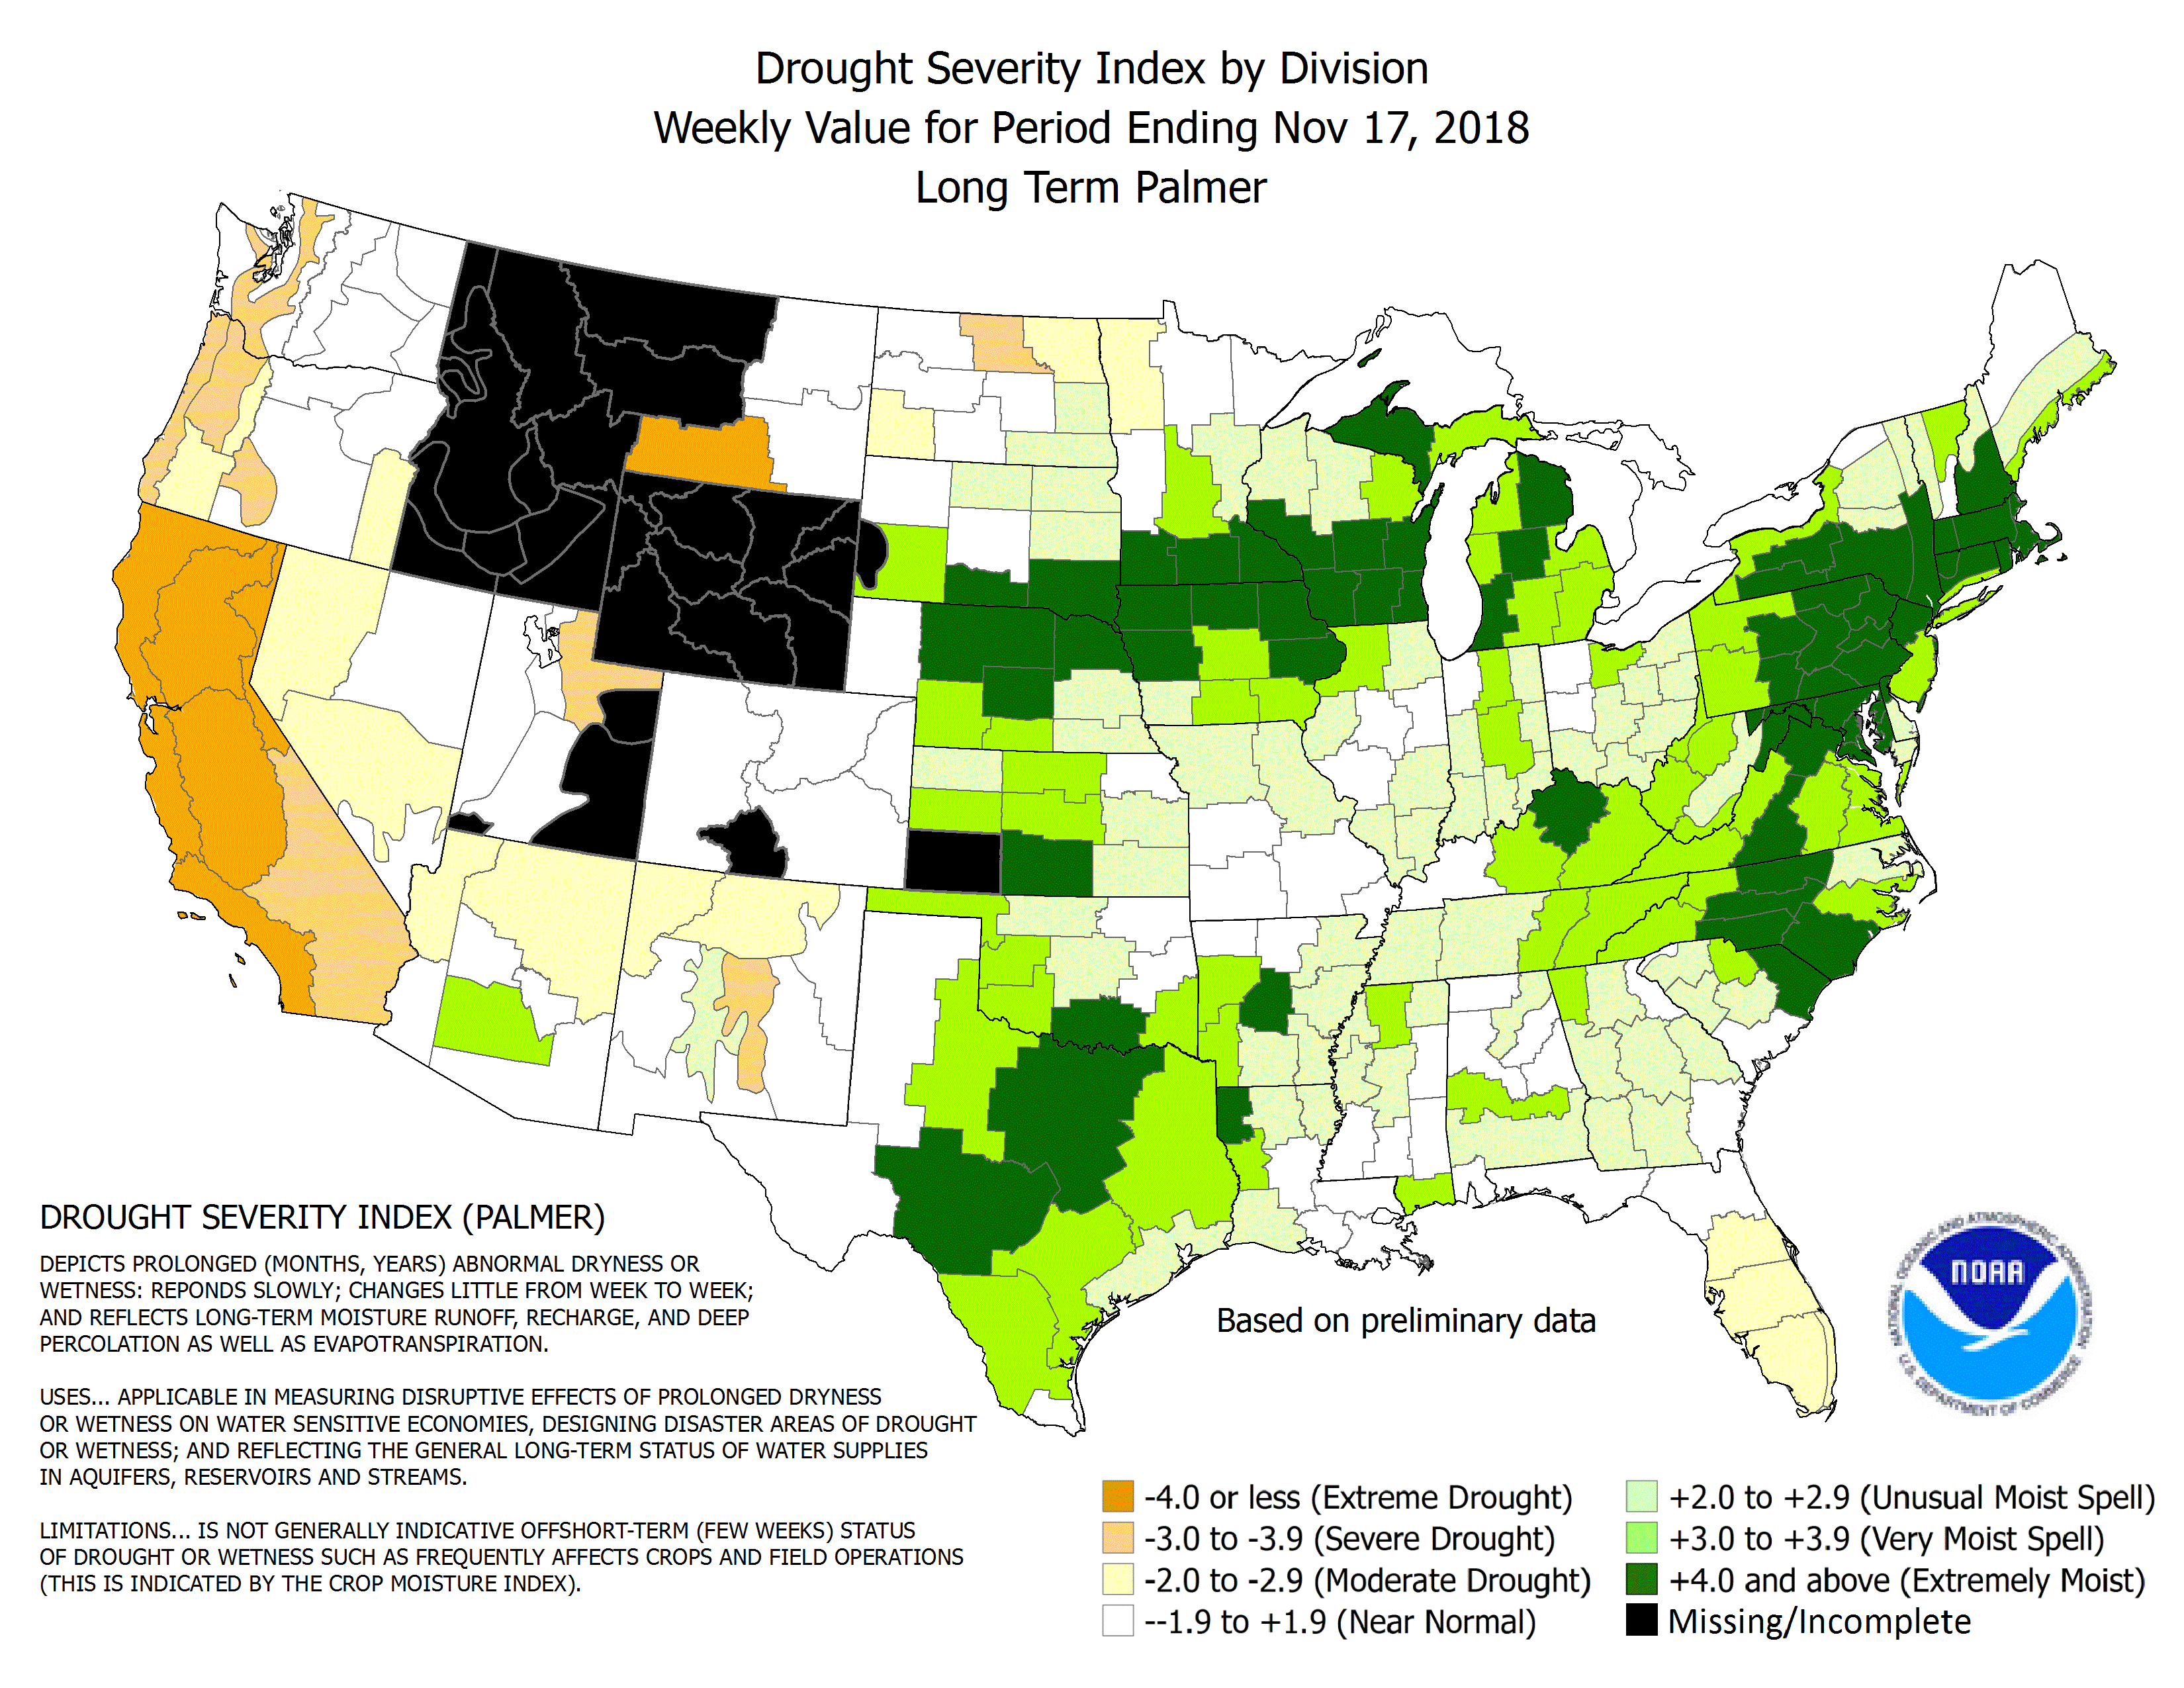
Local Area Affected: The National Drought Monitor depicts minor drought improvements over Arizona this month, with little improvement in SE California. Moderate Drought and Abnormally Dry conditions occurred over much of central and southern Arizona. Moderate to Severe drought persists across west central Arizona and much of southeast California. Only a small area of Imperial County still is experiencing Extreme drought. Extreme Drought (D3) - parts of Southeast California In California: western Imperial County Severe Drought (D2) - parts of south-central Arizona and southeast California In Arizona: much of La Paz County In California: eastern Imperial and small parts of Riverside counties Moderate Drought (D1) - parts of south-central Arizona and southeast California In Arizona: southern Gila, eastern Pinal, Yuma and parts of Maricopa counties In California: much of eastern Riverside County Abnormally Dry (D0) - parts of south-central Arizona In Arizona: western Pinal and central Maricopa counties
Local Climatology: Below are precipitation totals since the beginning of 2018 from selected locations across Arizona and southeast California:
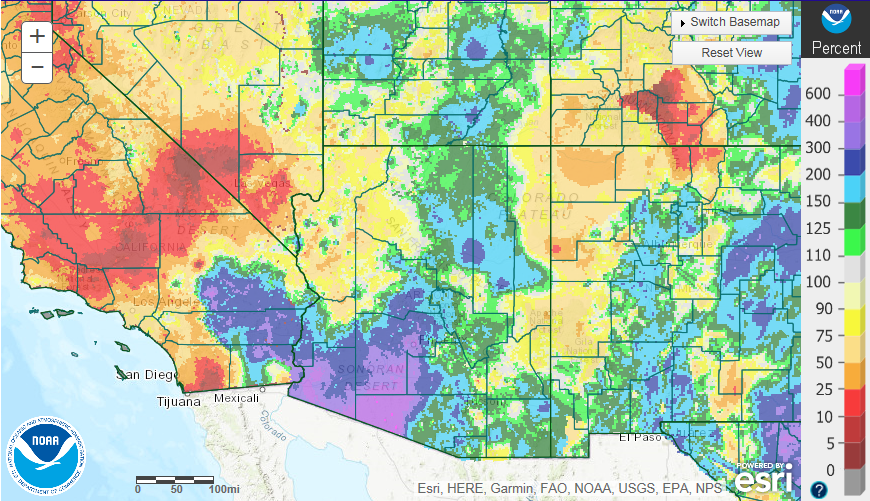
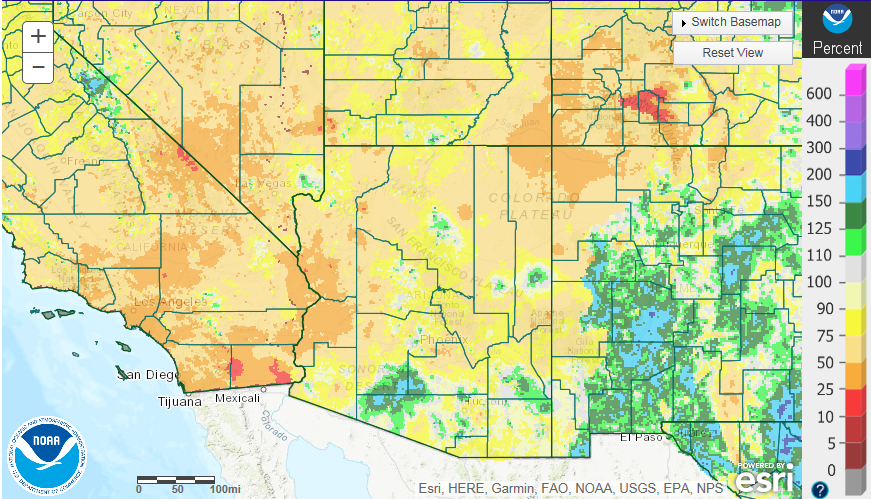
Rainfall during the first part of October was very impressive with many locations setting records for the month of October. This has also pushed year-to-date percentage near or above 100% for much of central AZ though western Arizona remains lagging near 50%.
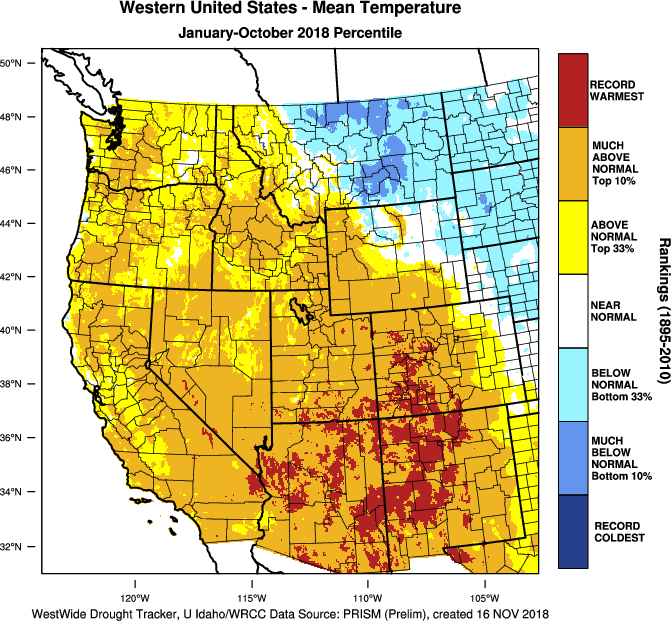
The long term drought conditions have been exacerbated by the fact that the majority of Arizona (and a good deal of the entire Southwest) experienced its warmest year in recorded history (since 1895).
|
The U.S. Drought Monitor is a weekly collaborative effort between a number of federal agencies including NOAA/NWS, U.S. Department of Agriculture and the National Drought Mitigation Center. Details and explanations of the Drought Monitor can found at the web site: http://droughtmonitor.unl.edu/ The categories of drought are defined as follows: Moderate Drought (D1) - Some damage to crops, pastures; fire risk high; streams, reservoirs, or wells low, some water shortages developing or imminent, voluntary water use restrictions requested. Severe Drought (D2) - Crop or pasture losses likely; fire risk very high; water shortages common; water restrictions imposed. Extreme Drought (D3) - Major crop/pasture losses; extreme fire danger; widespread water shortages or restrictions. Exceptional Drought (D4) - Exceptional and widespread crop/pasture losses; exceptional fire risk; shortages of water in reservoirs, streams, and wells, creating water emergencies. |
|
State and Local Actions: A Drought Emergency Declaration remains in effect for the state of Arizona as signed by the governor in accordance with the Arizona Drought Preparedness Plan. The continuation of this Drought Emergency has been recommended by the Drought Interagency Coordinating Group in their bi-annual meeting on May 29, 2018. This recommendation is based on long term precipitation deficits, along with ongoing negative impacts across the state. In northeast Arizona, the Navajo Nation has issued an emergency drought declaration to deal with extreme drought conditions.
|
Additional information concerning the drought in Arizona can be obtained via the Arizona Department of Water Resources web site at: https://new.azwater.gov/drought Additional information concerning the drought in California can be obtained via the California Department of Water Resources web site at: |
|
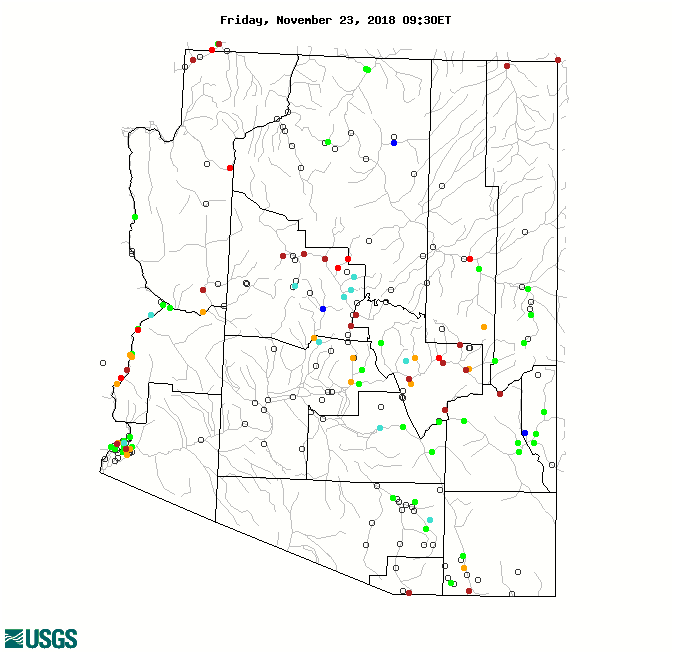
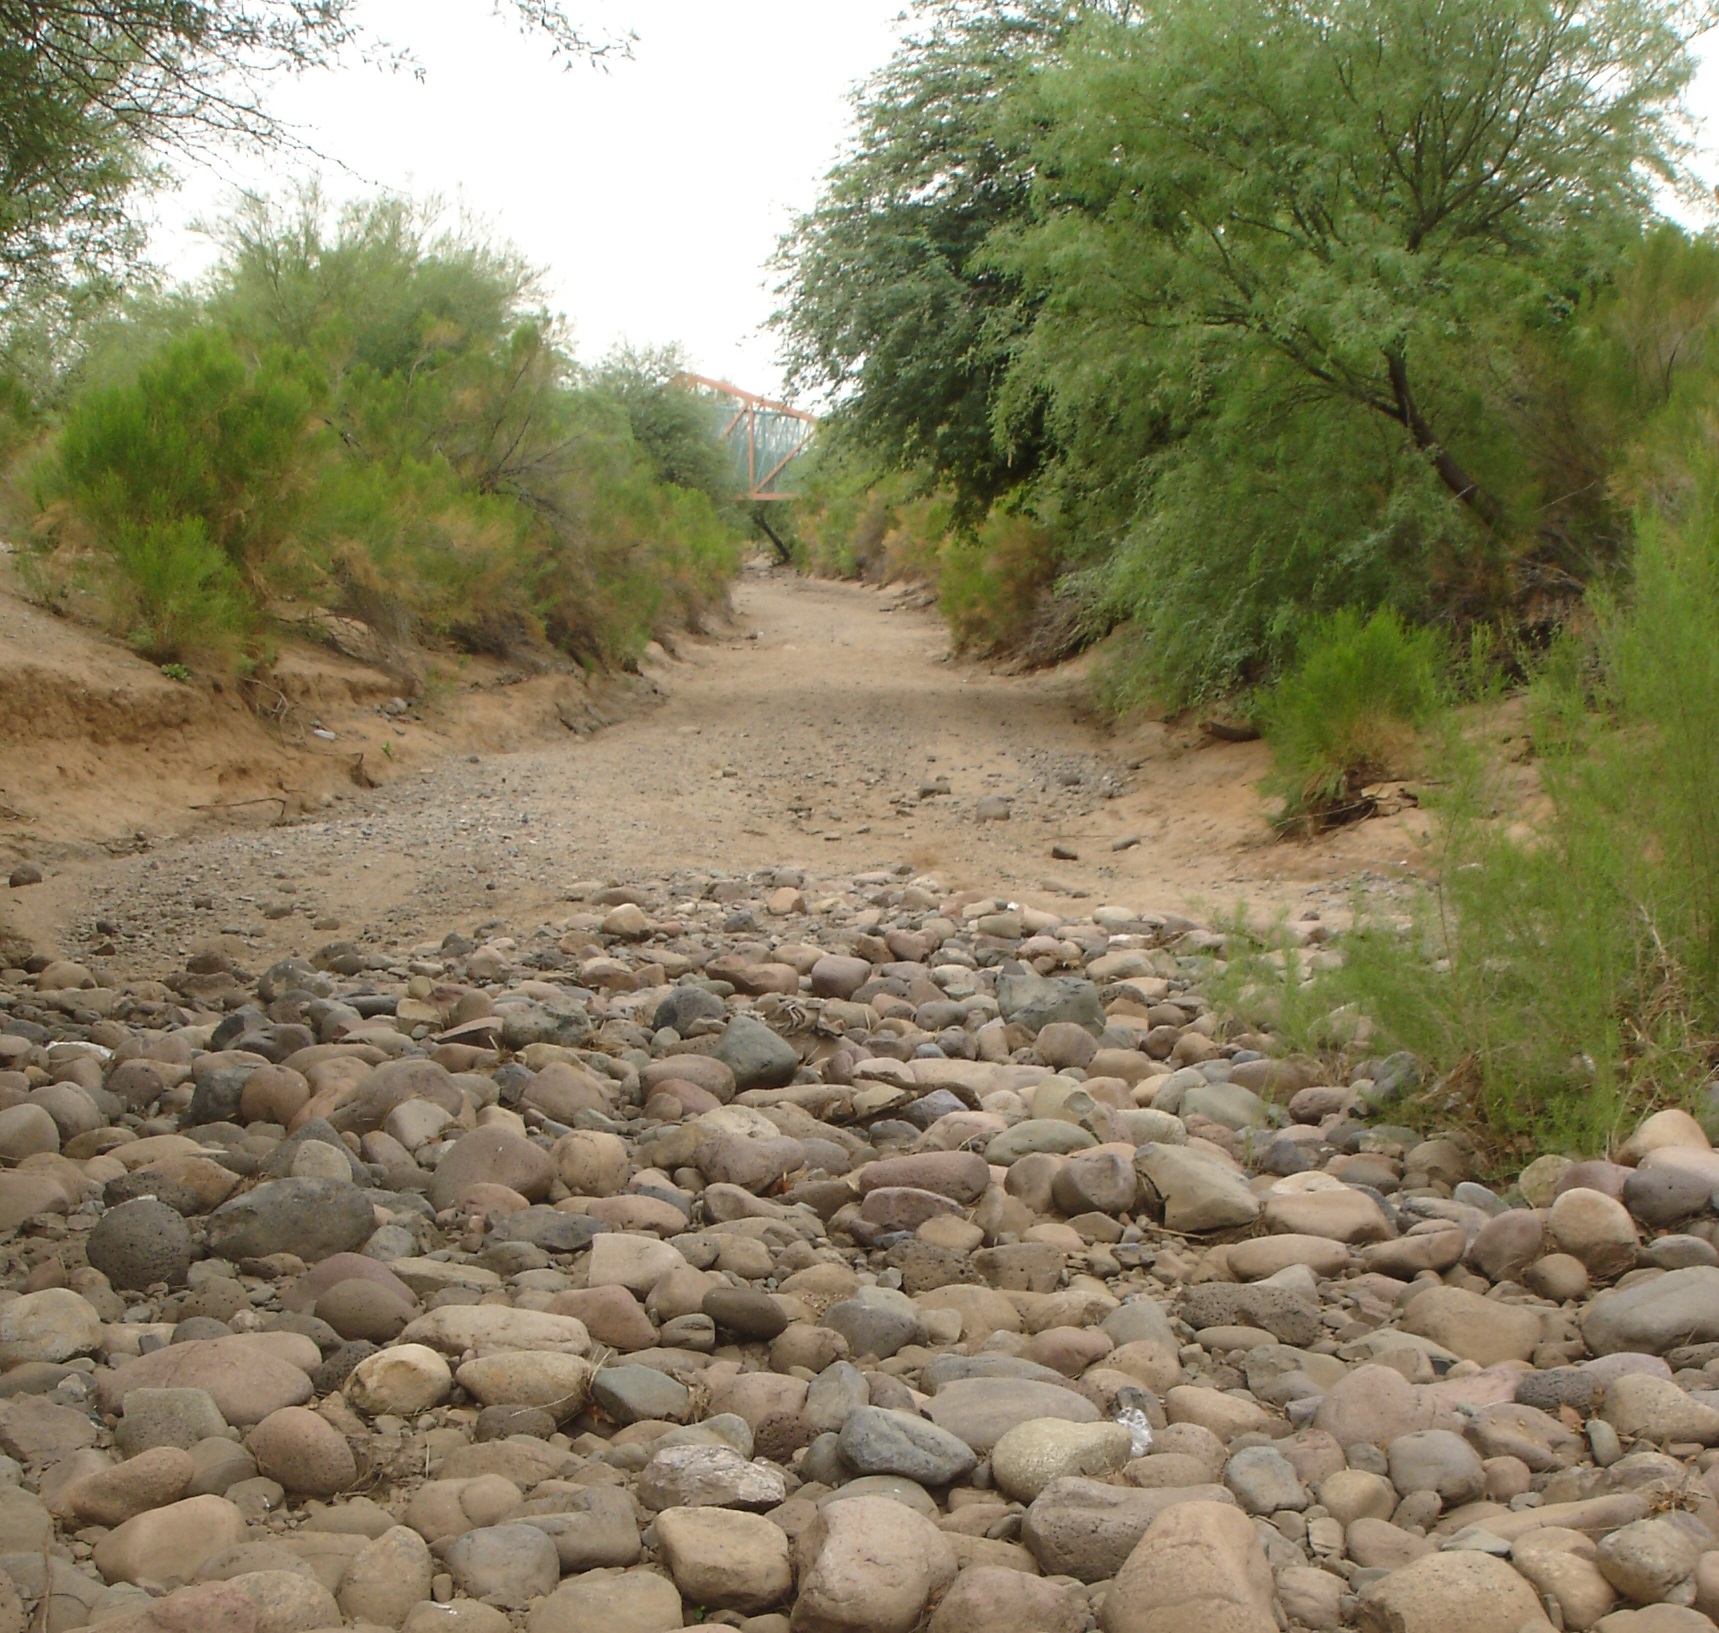
River, Stream Flow, and Reservoir Conditions: Most rivers and streams responded to the excessive October rainfall with above normal flows, though recently have fallen back from these higher levels. Some smaller streams have already fallen well below normal, though larger streams and rivers are still flowing within a normal range.
Reservoir levels remain well below levels at the same time last year, and similar to levels in 2016. October rainfall did little to help reservoir levels as the water contributed primarily to the recharge very dry soils. Better winter rain and snow will be needed to see better reservoir recharge heading into next spring.
|
Hourly and forecast river stages out to 90 days can be found at the National Weather Service's (NWS) Advanced Hydrologic Prediction Service (AHPS) web page: http://water.weather.gov/ahps2/index.php?wfo=psr Additional Current stream and river stages may be viewed at the following USGS Web Site: |
|
Agriculture Impacts: Extensive October rainfall aided in range land and pasture condition improvements though a more extensive recovery was hindered by the longer term drought and extremely dry soils. Reports from around the region indicate stock ponds have mostly refilled. Currently, 55% of the pasture and range land still is rated poor or very poor. Just one month ago, around 59% of range land was rated poor or very poor versus just 25% at this time last year. |
For additional information on agriculture impacts may be viewed at the United States Department of Agriculture (USDA) National Agricultural Statistics Service NASS Web Site: |
|
Fire Danger Hazards: The National Fire Danger Rating: Low to Moderate category for the entire area The current KDBI: Southwest Arizona and southeast California: Ranging from High and Extreme in SE California and much of SW Arizona to Moderate in southern Arizona and the higher elevations north and east of Phoenix
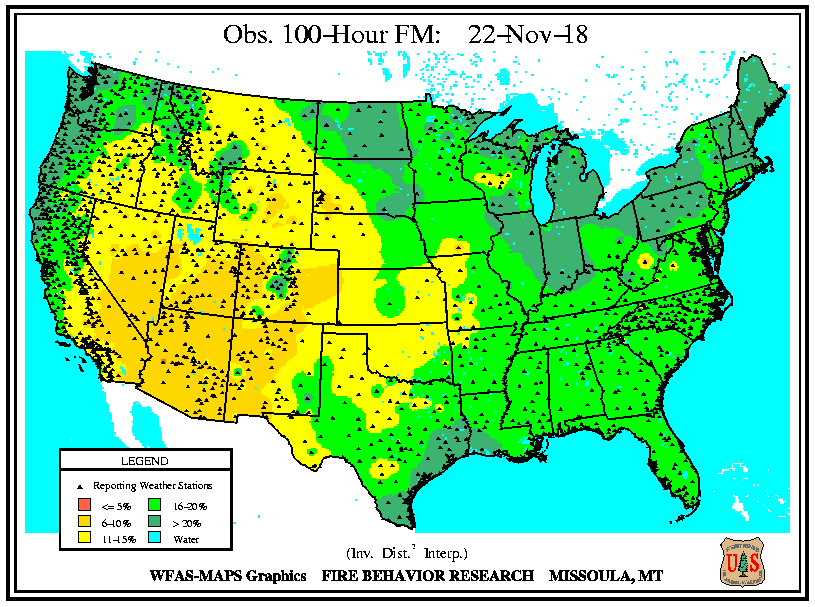
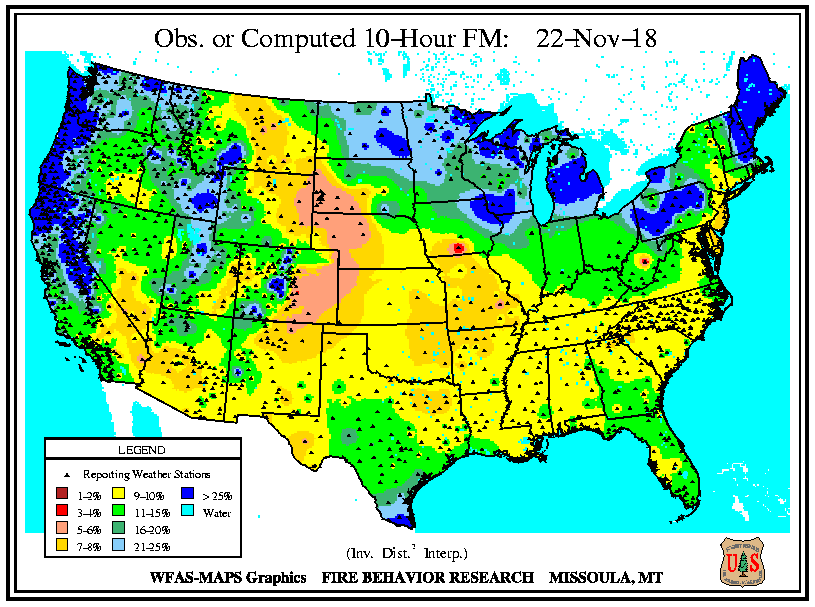
The cooler and more humid fall weather have allowed 100-hour dead fuel moisture values to improve to around 10% for all of central and eastern Arizona. Smaller sized 10-hour dead fuel moisture values have also increased above 7% for the entire area with many areas now approaching 10%. Fire weather threat will be muted until the warmer and drier spring weather arrives.
|
The Keetch-Byram Drought Index (KBDI) is a drought index that is specifically related to fire potential. The KDBI is broken into four categories which indicate the susceptibility of ground fuels to fire danger. Below are the four categories and a brief description of each.
KBDI and Dead Fuel Moisture data can be found on the Wildland Fire Assessment System (WFAS) web site at: |
||||||||||||
|
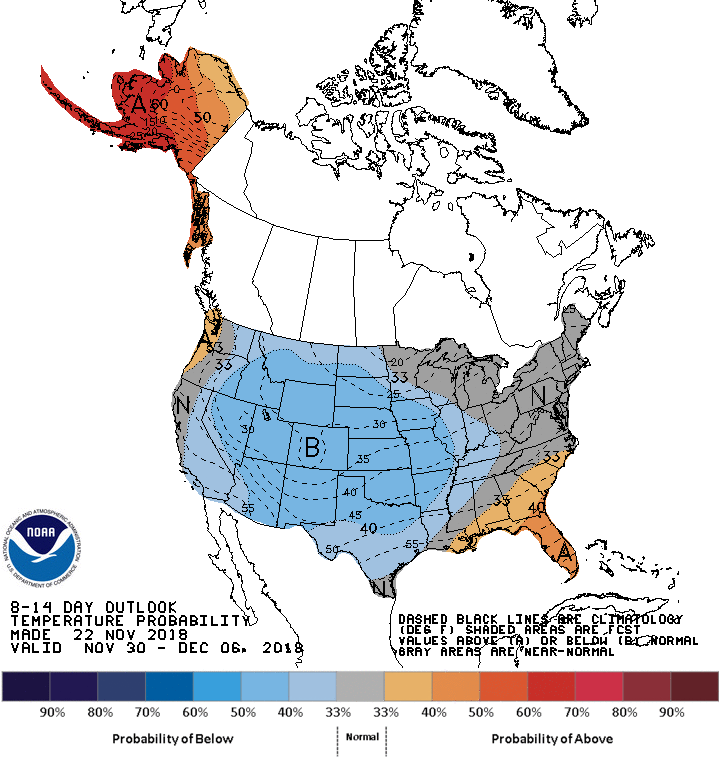
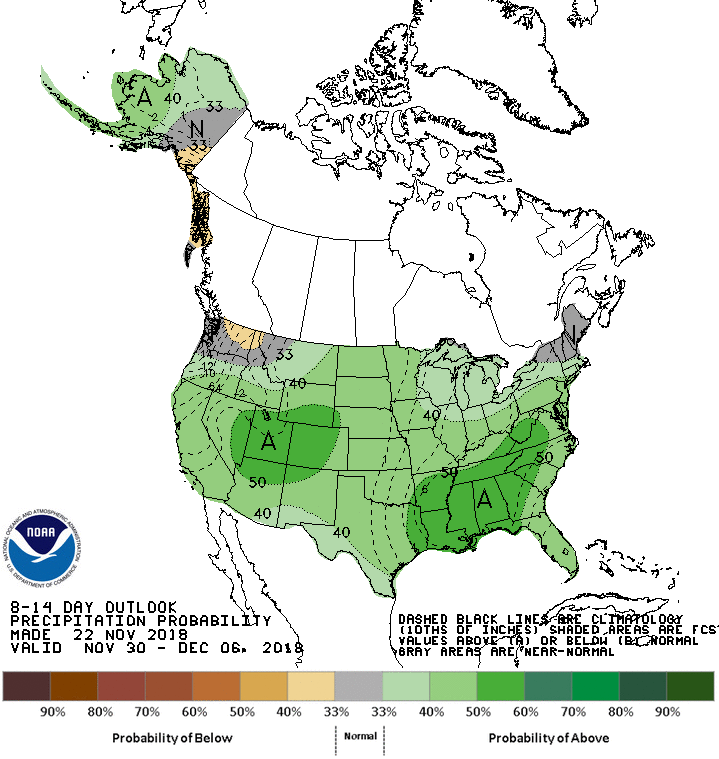
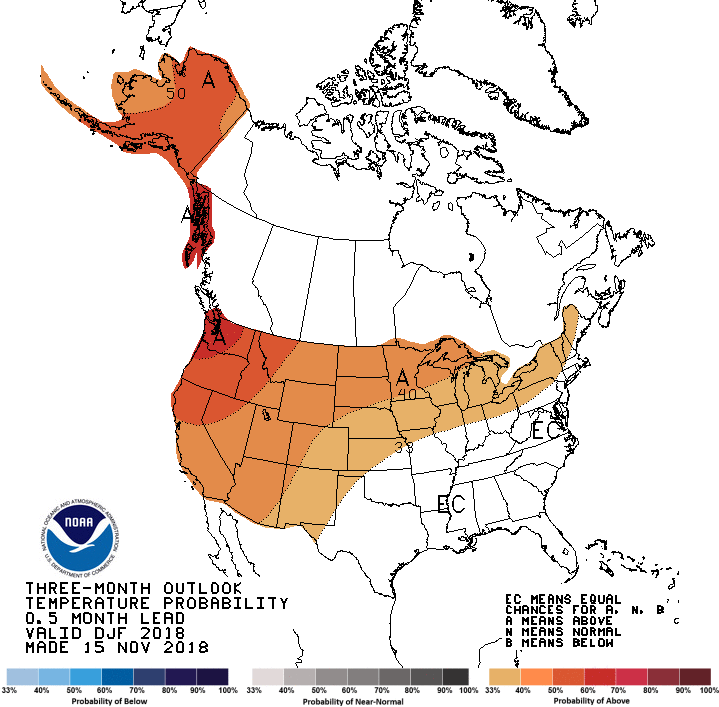
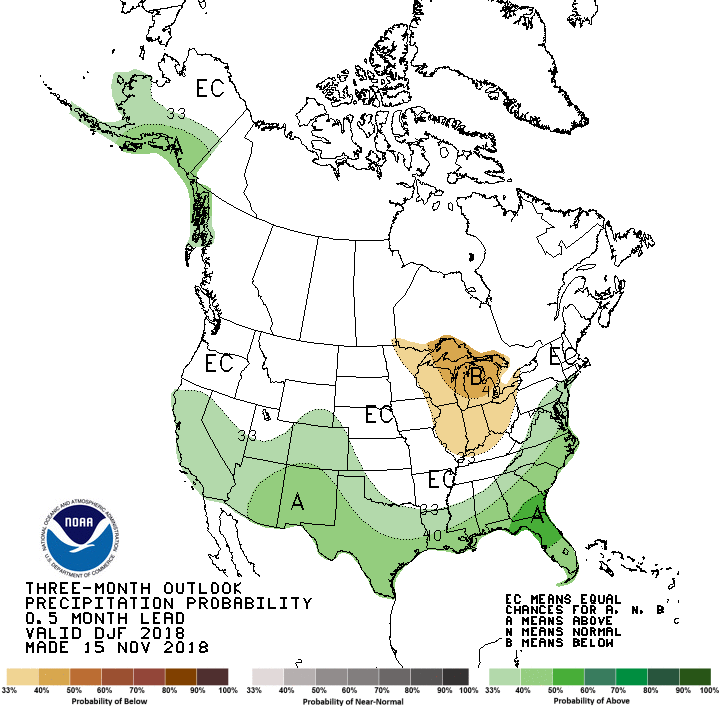
Precipitation/Temperature Outlooks: The 8-14 day temperature outlook for Nov 30-Dec 8 period calls for better chances of below average temperatures and slightly better chances for above average rainfall. The 30 day outlook for December 2018 (not shown) indicates better chances for above average temperatures and a very slight chance of above average precipitation. The 90 day outlook for the period December 2018 through February 2019 indicates better chances for above average temperatures and slightly enhanced odds of above average precipitation.
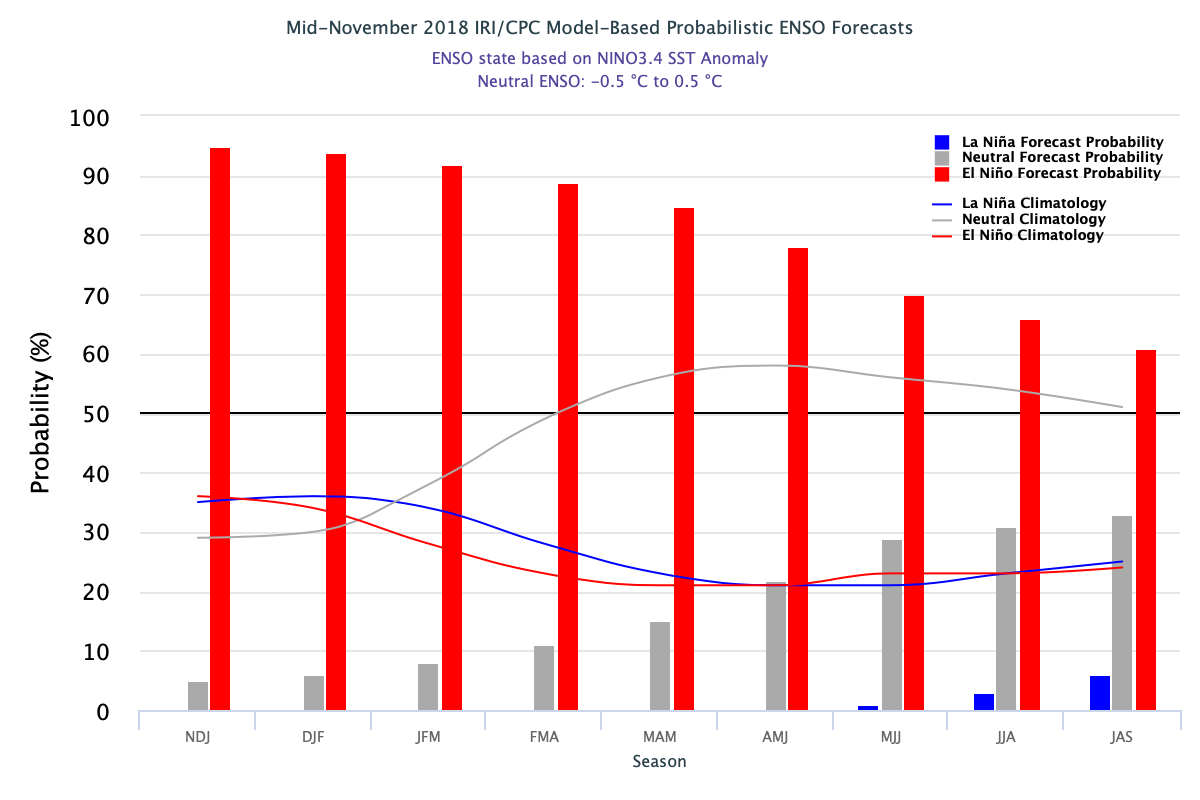
The tropical Pacific is currently transitioning to an El Nino episode and confidence is now high that this El Nino will peak during the middle of the winter and persist into the spring. This episode should only reach a weak category, but could briefly touch into the moderate category. While many other factors contribute to the atmospheric circulation pattern, there may be a slight tilting of the odds towards wetter conditions later in the year due to this El Nino cycle.
|
For updated temperature and precipitation probabilities consult the following Climate Prediction Center (CPC) Web Sites: 8 to 14 Day Outlook: http://www.cpc.ncep.noaa.gov/ 30 Day Outlook: http://www.cpc.ncep.noaa.gov 90 Day Outlook: |
|
Questions or Comments: If you have any questions or comments about this information |
Other Contacts: For state climate impacts: http://www.stateclimate.org |
|
Acknowledgements: The Drought Monitor is a multi-agency effort involving NOAA’s National |
Related Websites : NWS - http://www.weather.gov/phoenix CPC - http://www.cpc.ncep.noaa.gov Drought Monitor - http://droughtmonitor.unl.edu/ |