Continued Monsoon Rainfall Results in Additional Drought Improvement
|
 |
|
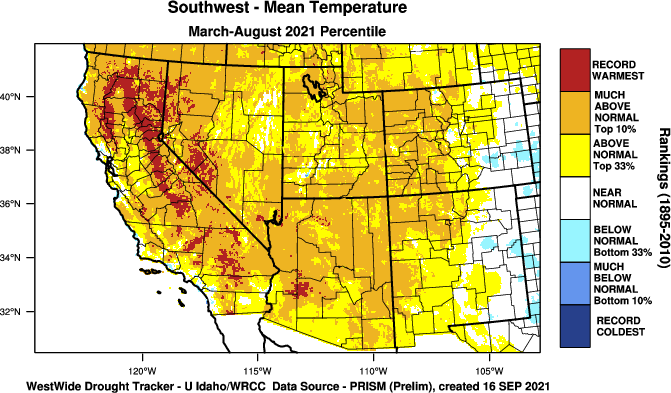
Summary: Numerous rounds of widespread thunderstorms with heavy rainfall were common in July and August resulting in many parts of Arizona experiencing their wettest monsoon in decades. In fact, a few
Local Area Affected: The National Drought Monitor depicts continued modest improvements in drought measures across Arizona and SE California. Extreme Drought (D3) - part of SE California In SE California: eastern Riverside County Severe Drought (D2) - parts of southwest Arizona and SE California In Arizona: northern La Paz County In SE California: part of Riverside County Moderate Drought (D1) - south-central and southwest Arizona and SE California In Arizona: Gila, Pinal, most of Maricopa, southern La Paz and northern Yuma counties In SE California: Imperial County Abnormally Dry (D0) - southwest Arizona In Arizona: far southern Yuma County, and small portions of Maricopa and Gila counties
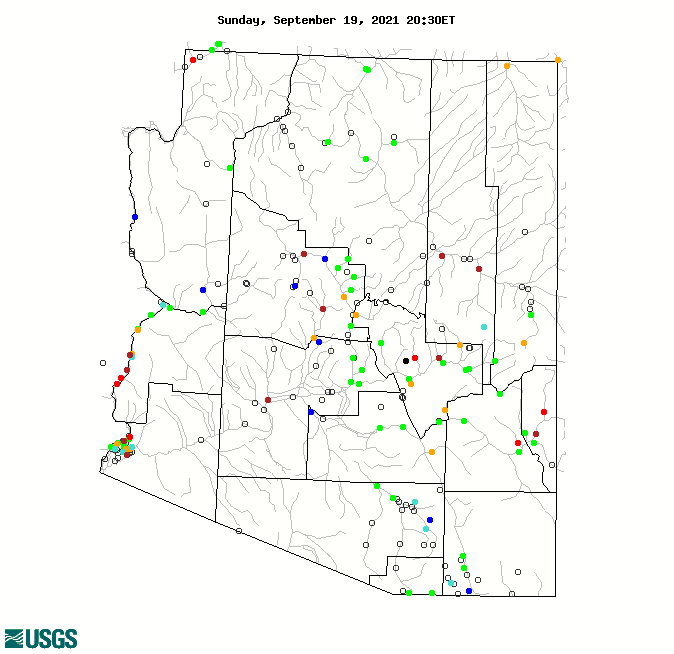
Local Climatology: Below are precipitation totals since the beginning of the 2020-21 Water Year from selected locations across Arizona and southeast California (Please note Normals have been adjusted to reflect the new 1991-2020 official climate period):
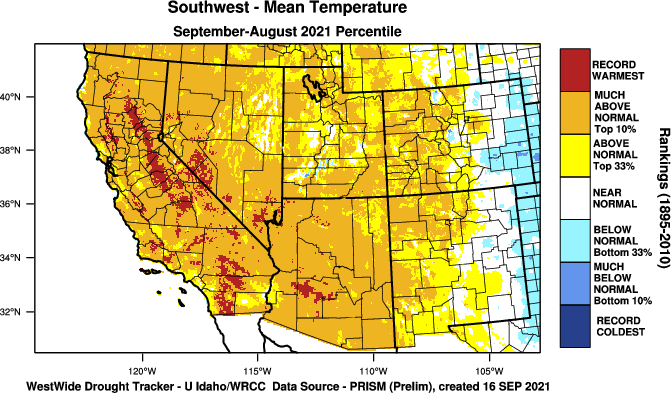
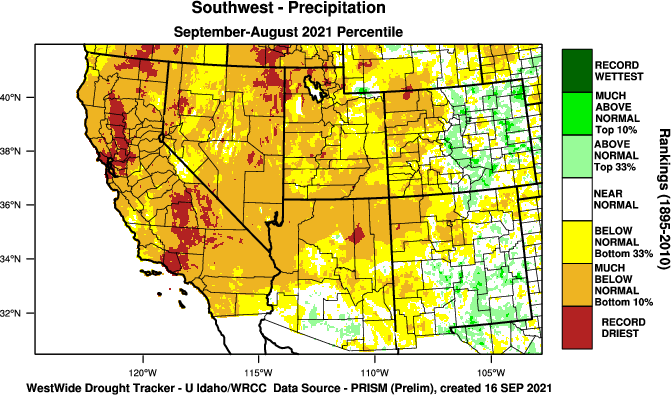
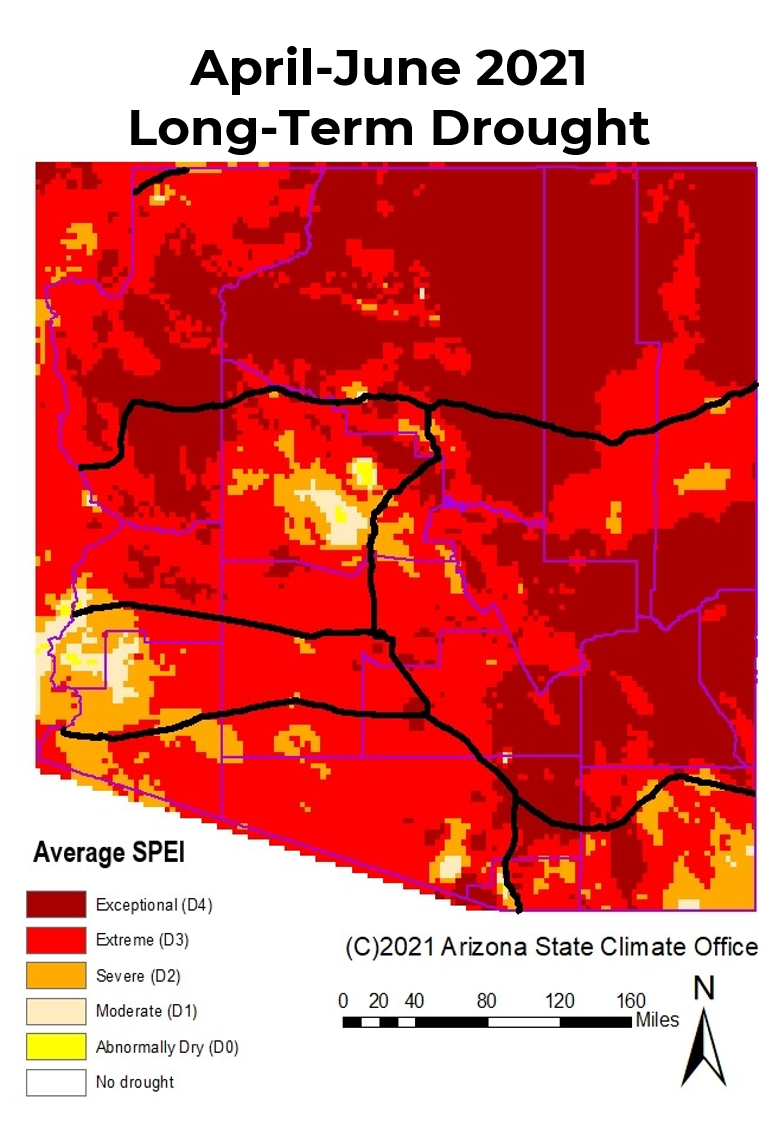
Expansive heavy monsoon rainfall has resulted in one of the wetter spring/summer seasons for the southern half of Arizona. However given the long term drought over the past year, communities with the heaviest rain have only recovered to near normal for the past 12 months, In northern Arizona and the Upper Colorado basin, long term shortages still exists. Record or near record heat over the past year have only exacerbated drought intensity though extra evapotranspiration. |
The U.S. Drought Monitor is a weekly collaborative effort between a number of federal agencies including NOAA/NWS, U.S. Department of Agriculture and the National Drought Mitigation Center. Details and explanations of the Drought Monitor can found at the web site: http://droughtmonitor.unl.edu/ The categories of drought are defined as follows: Moderate Drought (D1) - Some damage to crops, pastures; fire risk high; streams, reservoirs, or wells low, some water shortages developing or imminent, voluntary water use restrictions requested. Severe Drought (D2) - Crop or pasture losses likely; fire risk very high; water shortages common; water restrictions imposed. Extreme Drought (D3) - Major crop/pasture losses; extreme fire danger; widespread water shortages or restrictions. Exceptional Drought (D4) - Exceptional and widespread crop/pasture losses; exceptional fire risk; shortages of water in reservoirs, streams, and wells, creating water emergencies. |
|
State and Local Actions: A Drought Emergency Declaration remains in effect for the state of Arizona as signed by the governor in accordance with the Arizona Drought Preparedness Plan. The continuation of this Drought Emergency has been recommended by the Drought Interagency Coordinating Group in their bi-annual meeting on May 11, 2021. This recommendation is based on long term precipitation deficits and impacts experienced across the state.
|
Additional information concerning the drought in Arizona can be obtained via the Arizona Department of Water Resources web site at: https://new.azwater.gov/drought Additional information concerning the drought in California can be obtained via the California Department of Water Resources web site at: |
|
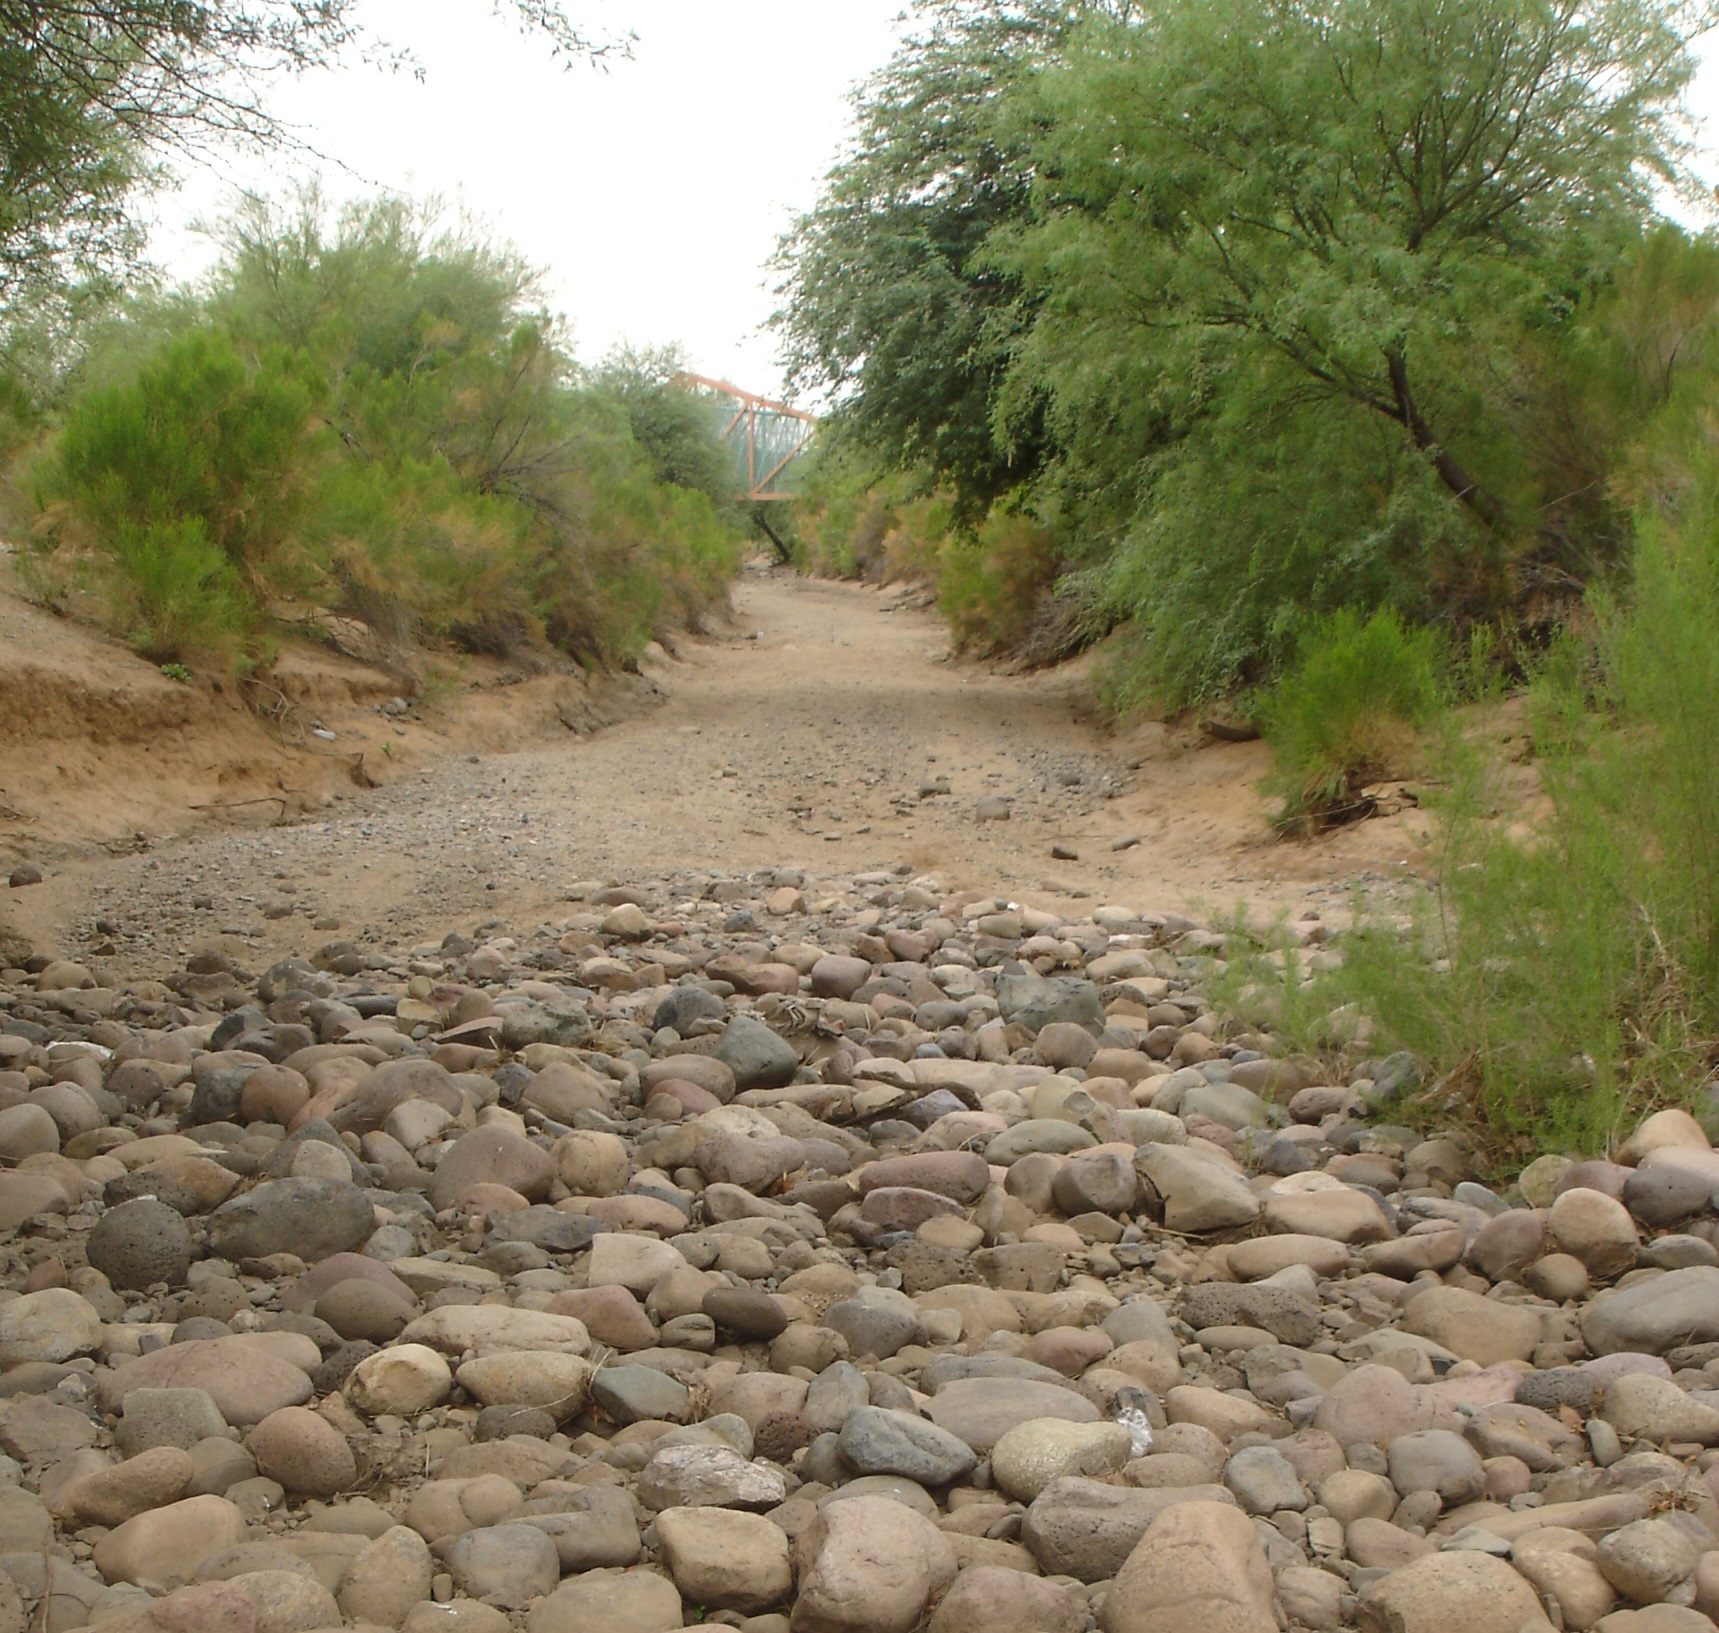
River, Stream Flow, and Reservoir Conditions: Smaller streams throughout Arizona experienced substantial responses from the repeated heavy rainfall events this summer. Some unregulated smaller streams are still flowing well above average, however extended drier periods this September have resulted in some streams falling back to minimal flow. The more highly regulated larger rivers mostly remain in a near normal flow rates due to continual management efforts.
Early monsoon rainfall helped replenish soil moisture across much of the Salt/Verde basin, then periods of heavier rain in August actually resulted in reservoir inflow. It`s common to see minor bumps in reservoir levels during the monsoon, but the notable
|
Hourly and forecast river stages out to 90 days can be found at the National Weather Service's (NWS) Advanced Hydrologic Prediction Service (AHPS) web page: http://water.weather.gov/ahps2/index.php?wfo=psr Additional Current stream and river stages may be viewed at the following USGS Web Site: |

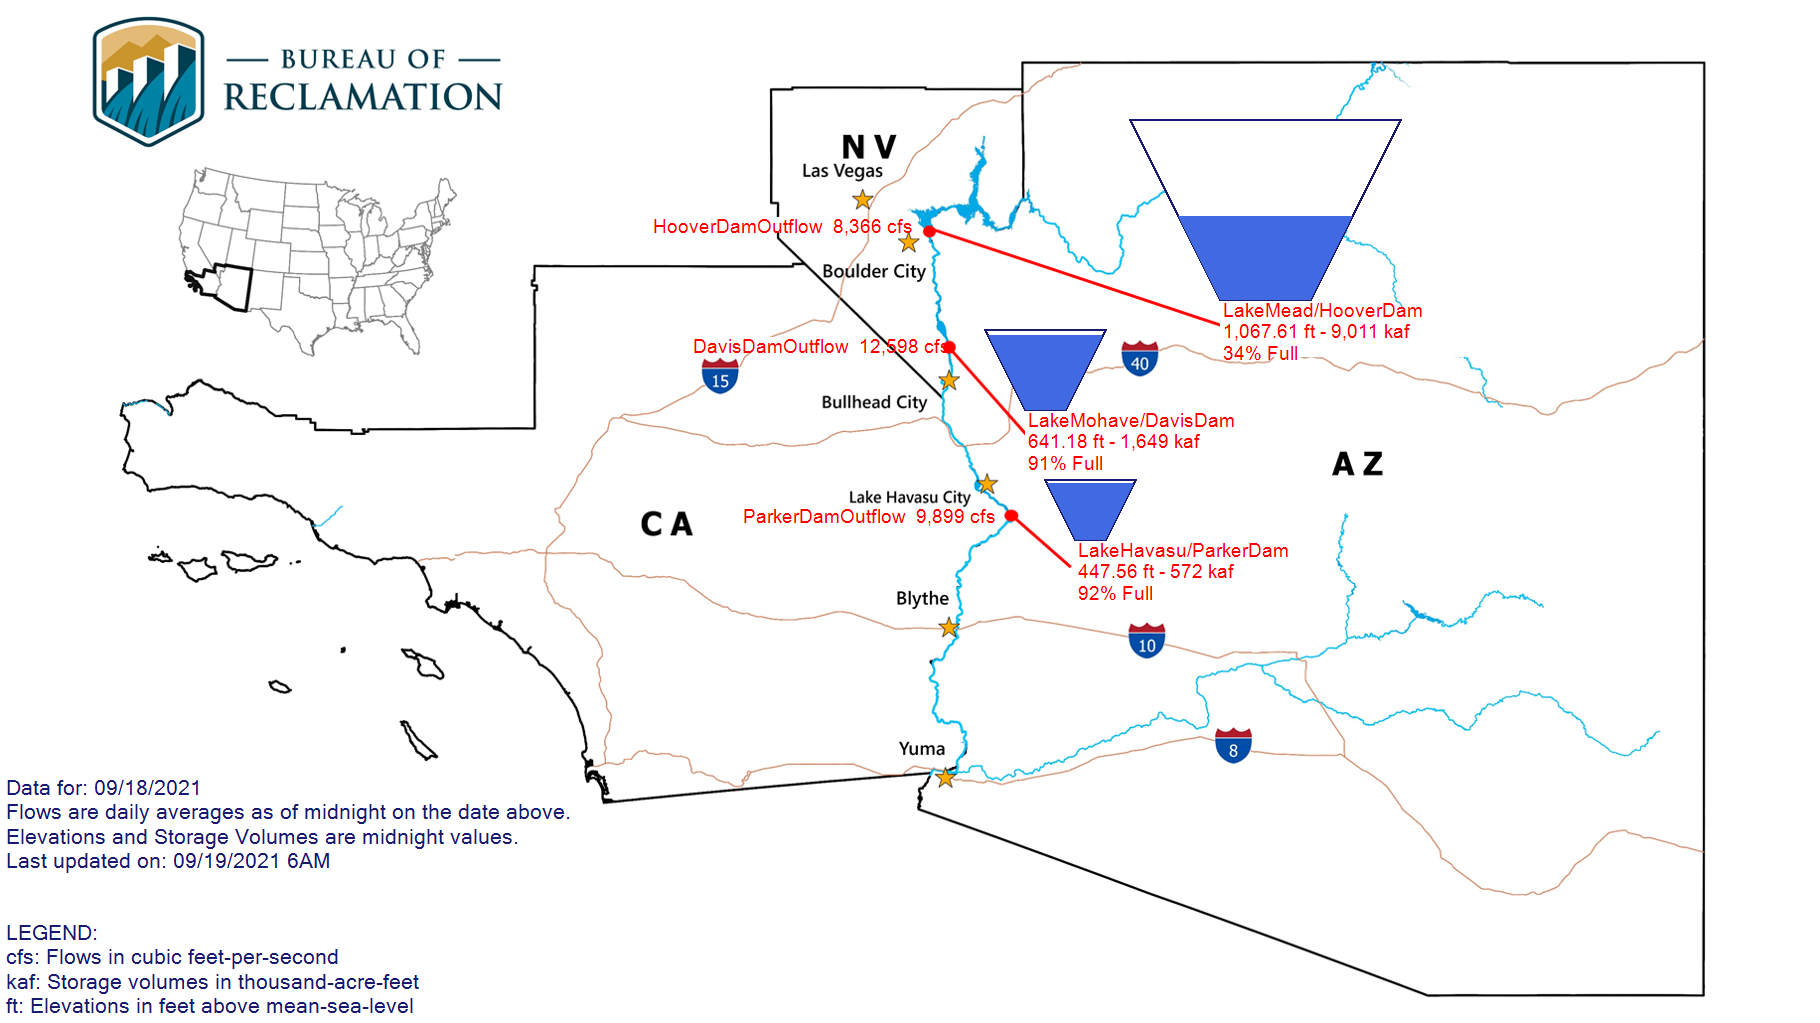
Despite adequate storage levels within the Salt-Verde basin, the greater Colorado
River basin has been hit by multiple years of drought and overextended usage. As
a result, the Bureau of Reclamation officially declared a basin shortage condition for
2022 cutting water deliveries to the state. Farmers around the state, in particularly in
Pinal County, will experienced the greatest water cuts from this delivery shortage.
|
Agriculture Impacts: Only 4% of the Arizona range and pasture land rated as poor to very poor in mid September versus 57% in August and 78% in July. Widespread beneficial monsoon rainfall has helped alleviate the most severe impacts for ranchers. In addition to forage growth, stock ponds have refilled in many areas.
|
For additional information on agriculture impacts may be viewed at the United States Department of Agriculture (USDA) National Agricultural Statistics Service NASS Web Site: |
|
Fire Danger Hazards: The National Fire Danger Rating: Moderate to Very High category across the region The current KDBI: Southwest Arizona and southeast California: Ranging from Extreme lower elevations of SE California and southwest Arizona and Low in eastern Arizona.
After a spring season of unusually dry fuels and expansive wildfire coverage, persistent and copious amounts of monsoon moisture abruptly ended the fire season in early summer. However because of the amount of area burned and intensity of the fire activity, flooding and debris flows from these burned areas were a tremendous hazards for downstream communities over the monsoon. As drier weather has been more prevalent in September, 100-hour dead fuel moisture has fallen below 10% after surging above 16% range in much of Arizona in August. Similarly, 10-hour dead fine fuels have deteriorated slightly with values under 5% for most lower elevation locations, and upwards of 7-10% at higher terrain locations of central Arizona.
|
The Keetch-Byram Drought Index (KBDI) is a drought index that is specifically related to fire potential. The KDBI is broken into four categories which indicate the susceptibility of ground fuels to fire danger. Below are the four categories and a brief description of each.
KBDI and Dead Fuel Moisture data can be found on the Wildland Fire Assessment System (WFAS) web site at: |
||||||||||||
|
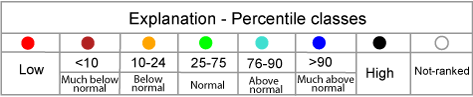
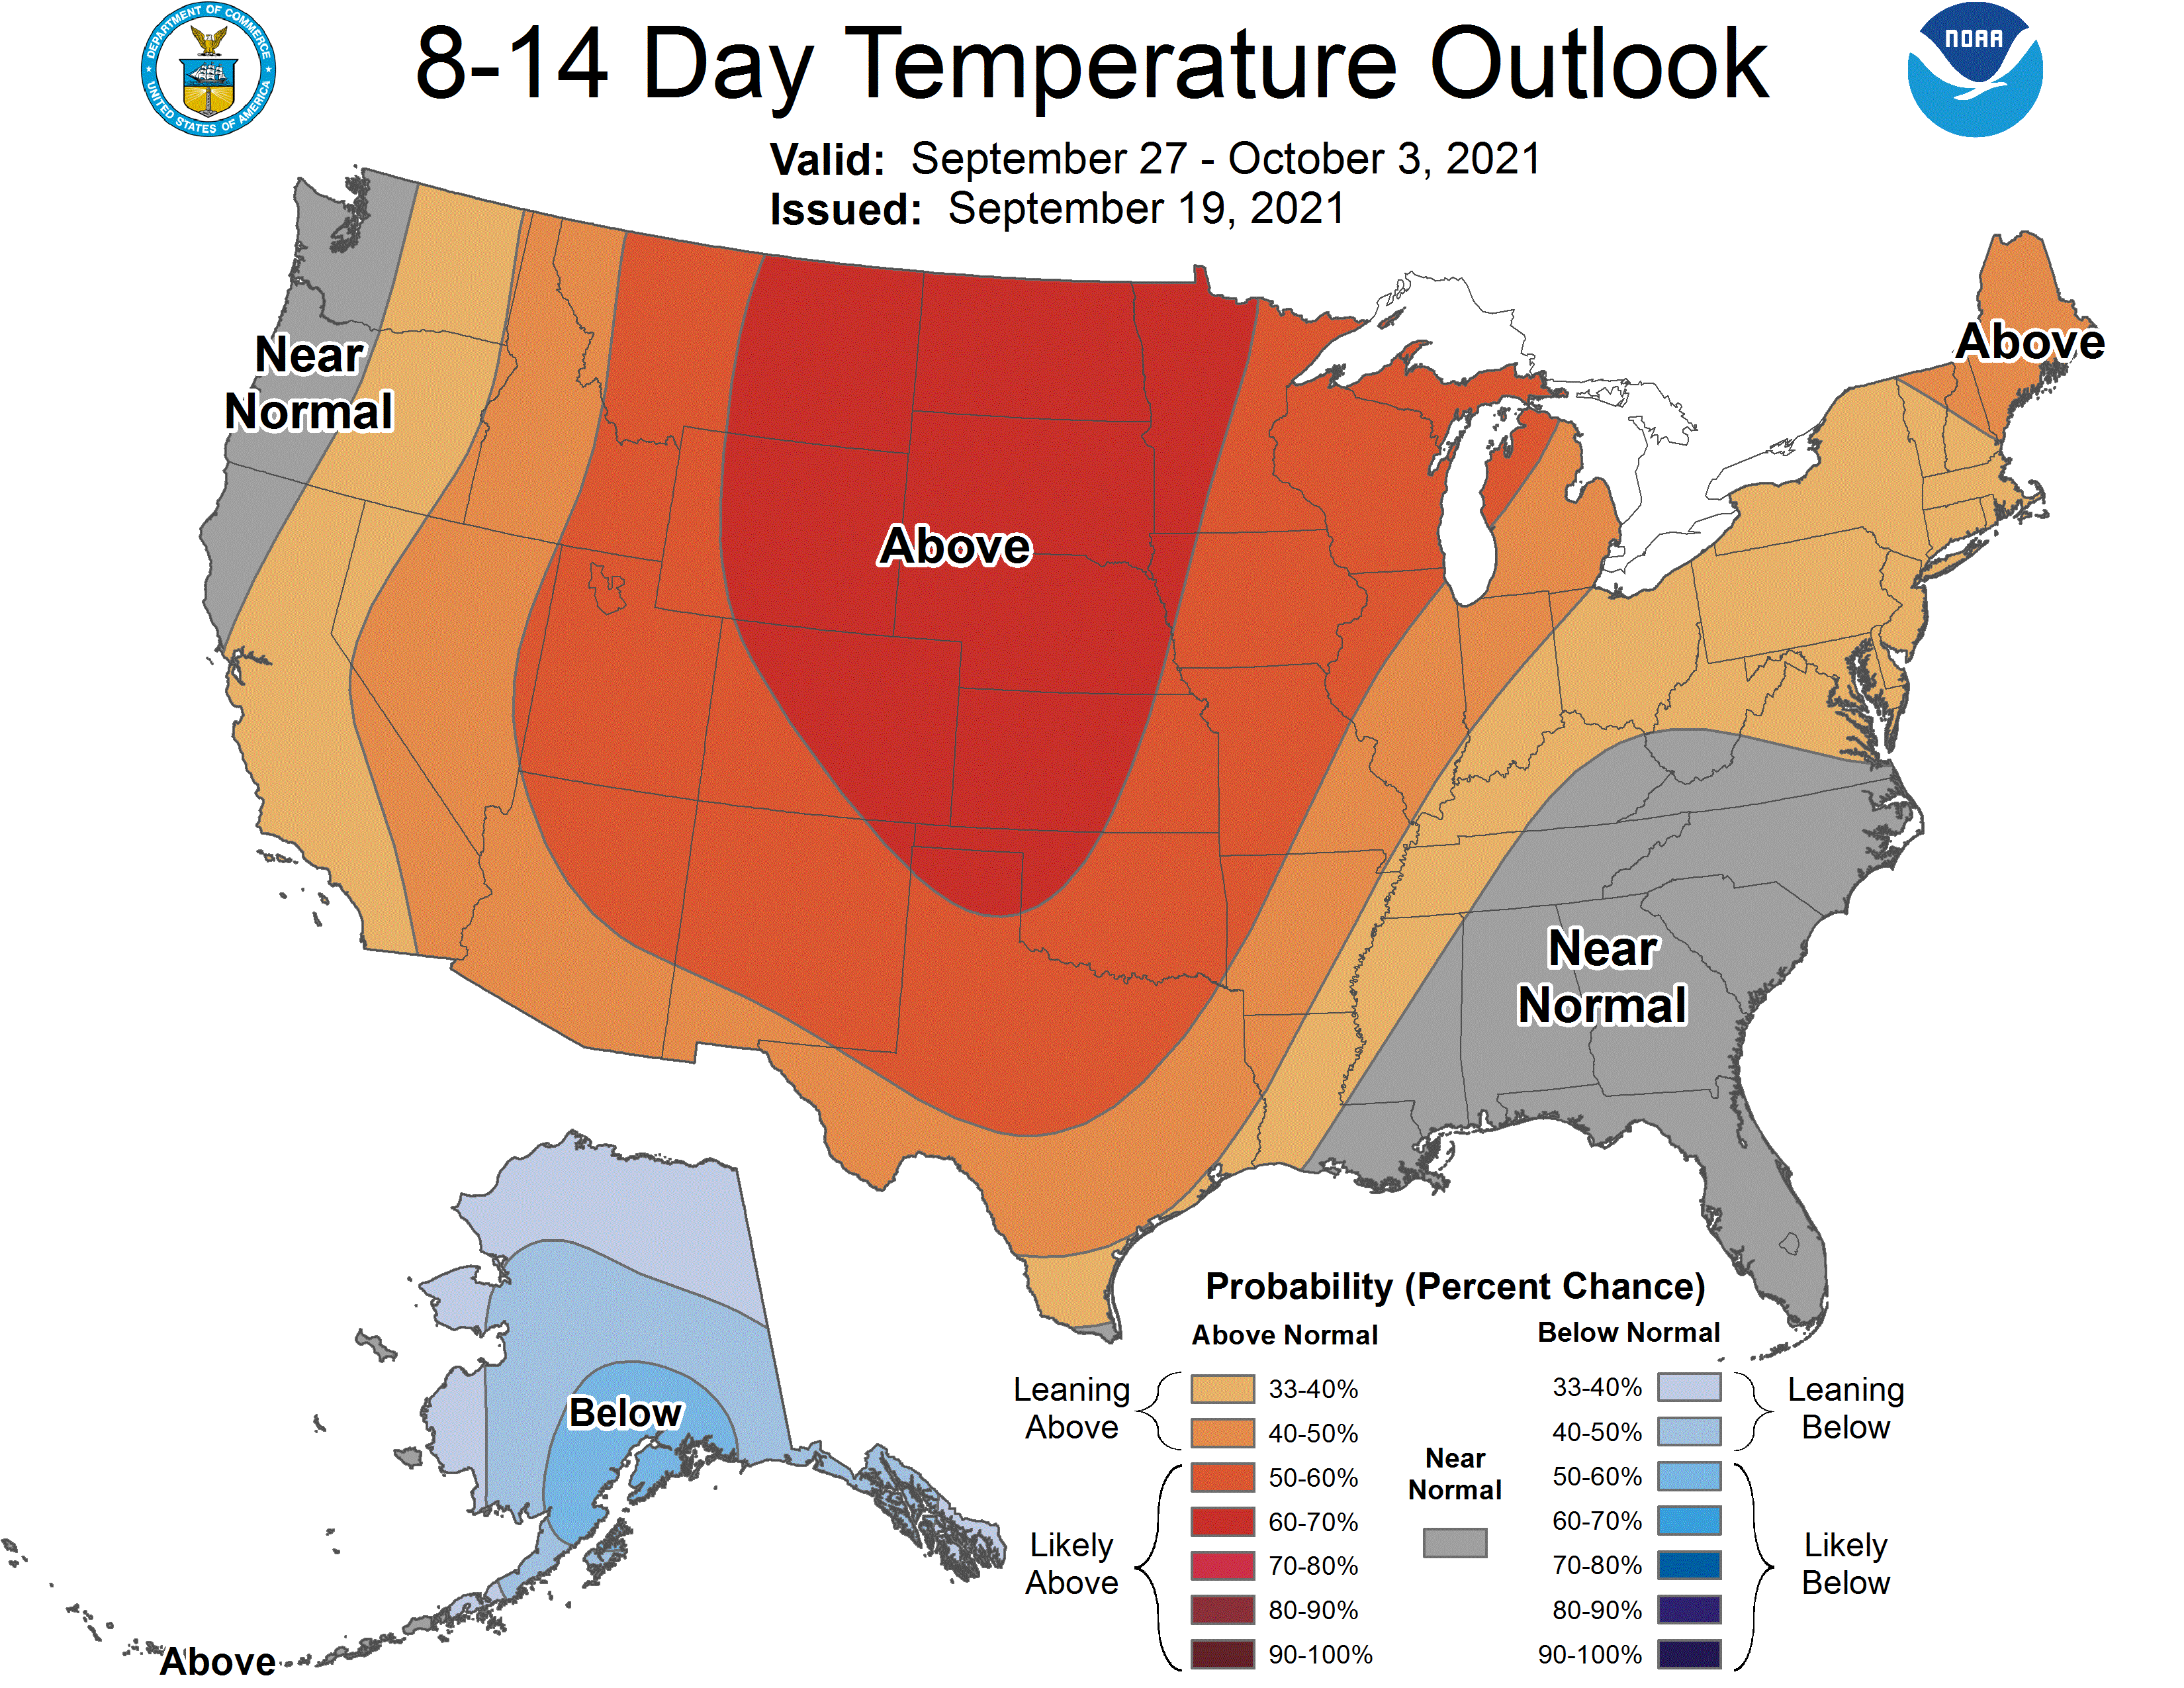
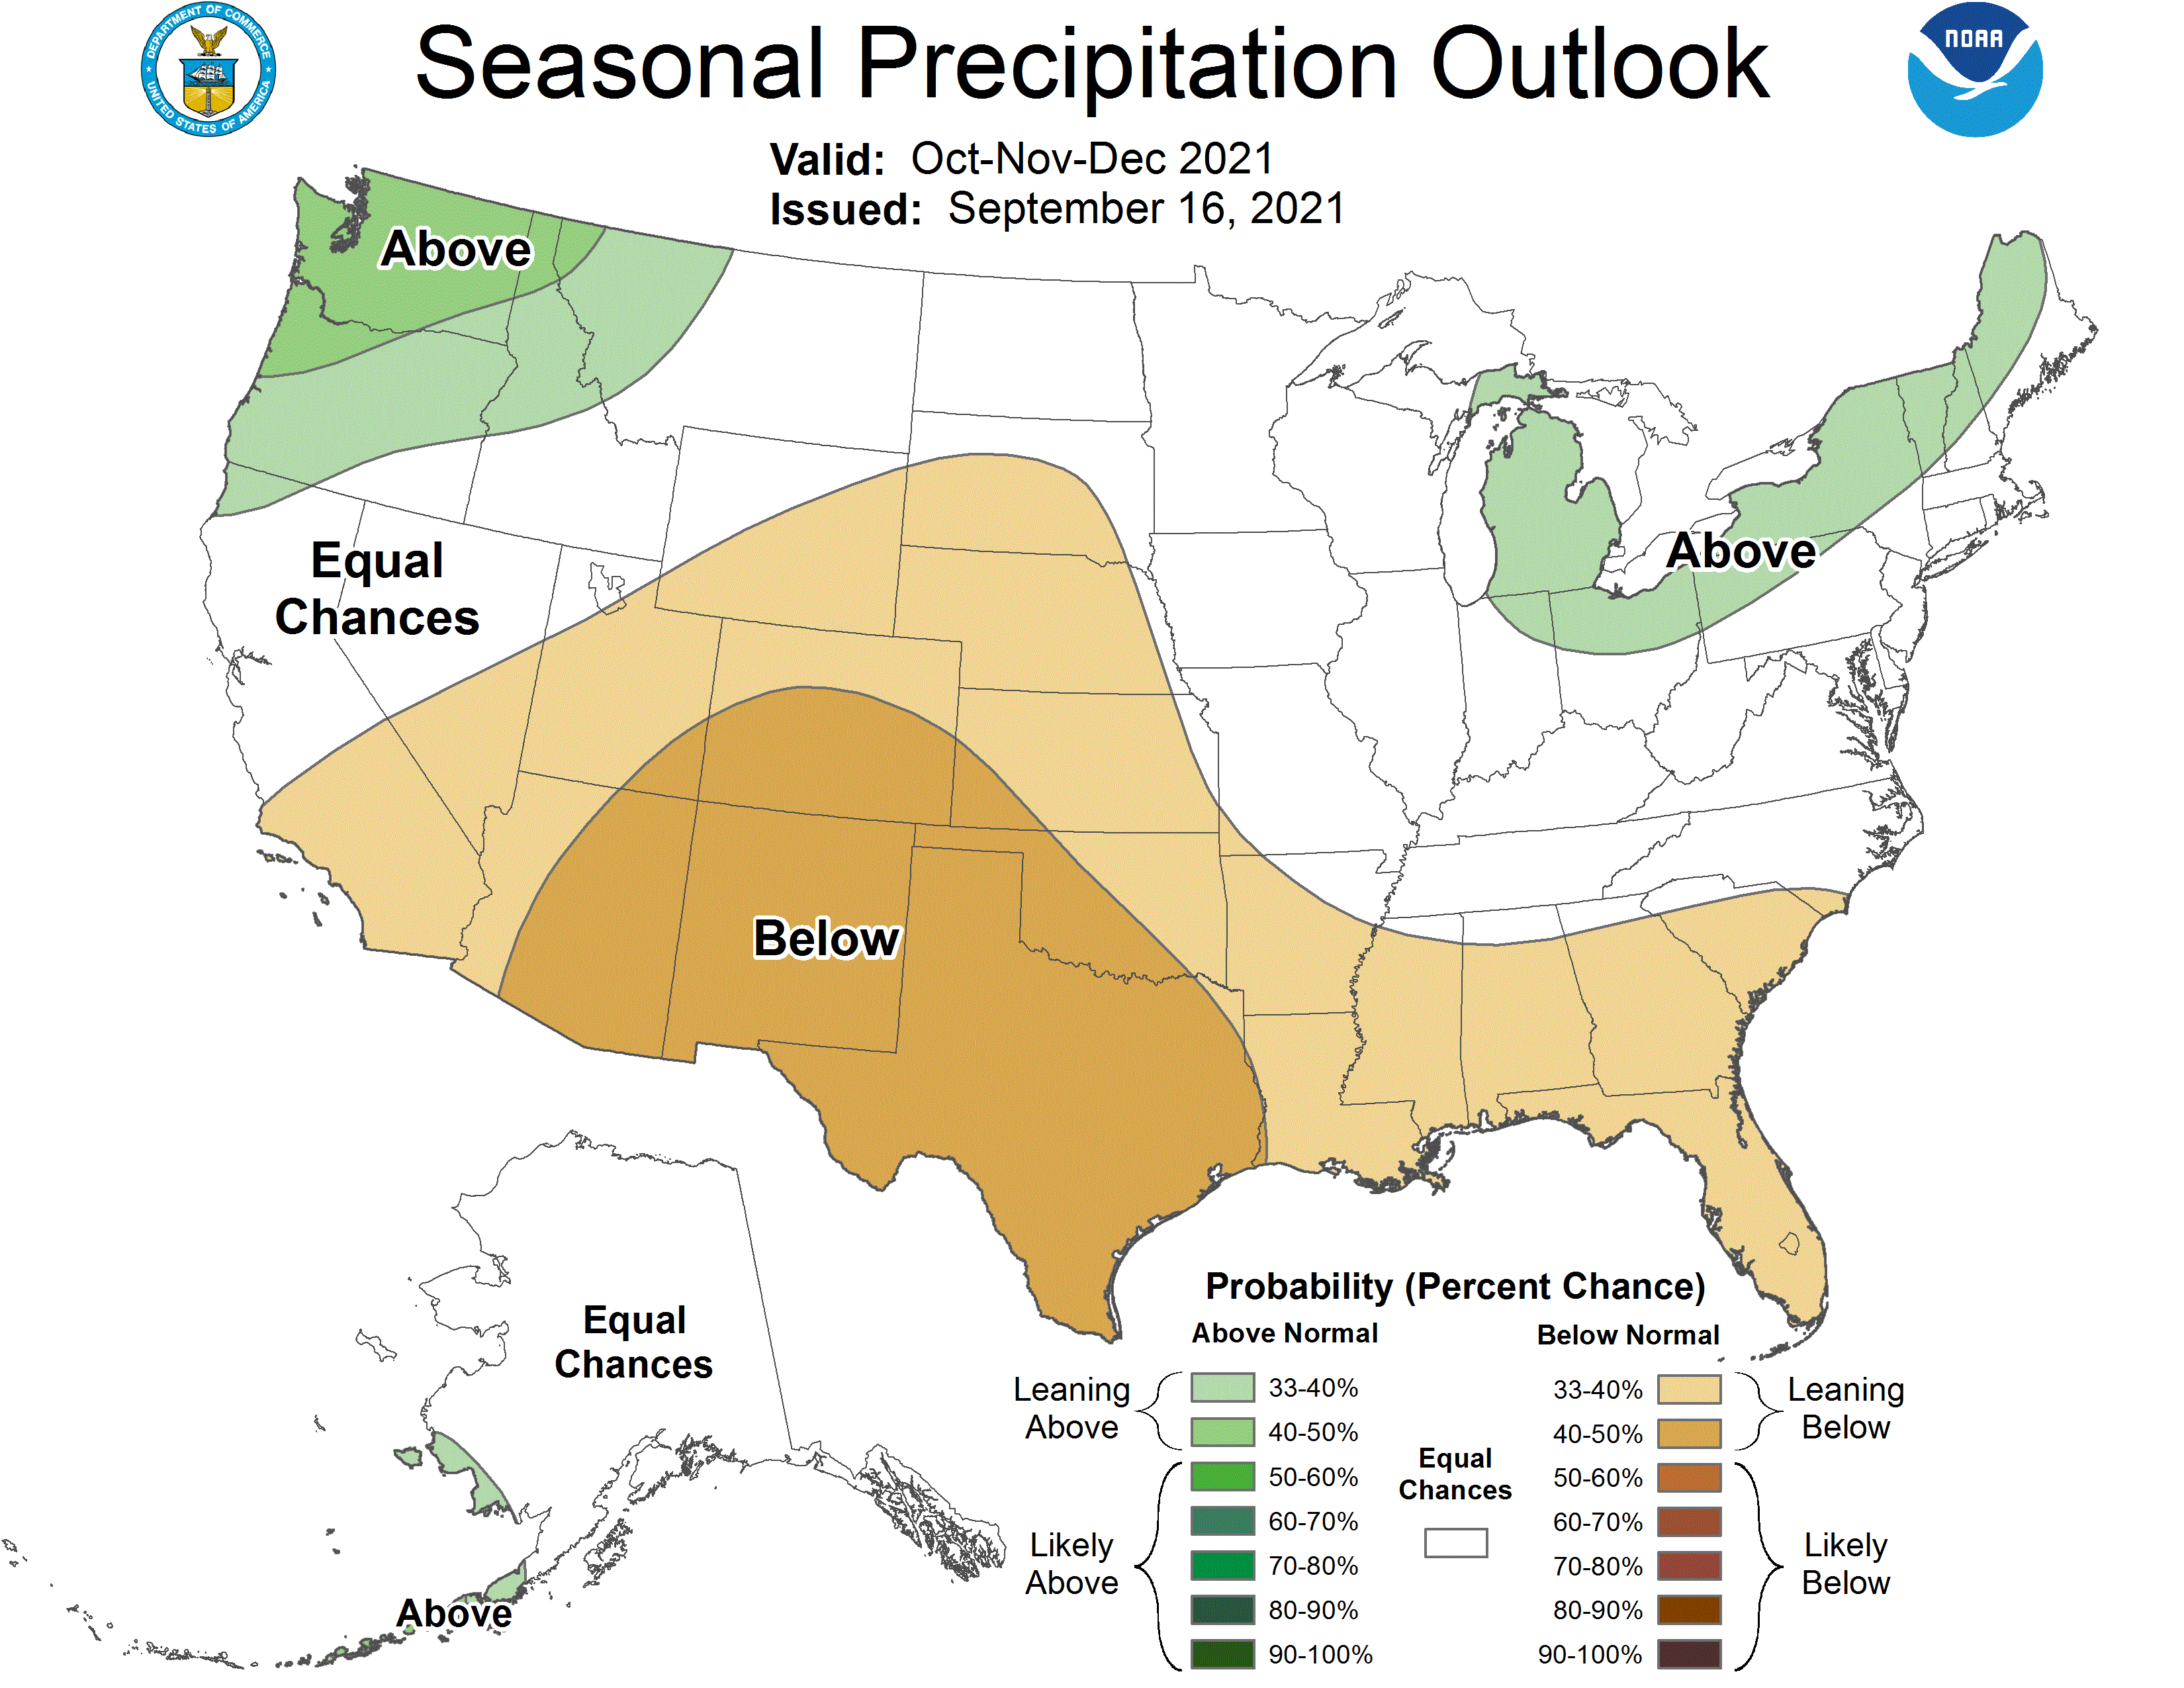
Precipitation/Temperature Outlooks: The 8-14 day temperature outlook for Sep 27-Oct 3 period calls for better chances of above average temperatures and best odds for near normal rainfall. The 90 day outlook for the period October through December 2021 indicates better chances for above average temperatures and enhanced odds for below normal precipitation.
Tropical Pacific sea surface temperatures were near average through much of the summer (ENSO neutral), however have already exhibited widespread cooling suggestive of another La Nina winter. There is approximately an 80% chance of La Nina returning this winter 2021-22 with odds favoring another cool season of below normal precipitation throughout the region.
|
For updated temperature and precipitation probabilities consult the following Climate Prediction Center (CPC) Web Sites: 8 to 14 Day Outlook: http://www.cpc.ncep.noaa.gov/ 30 Day Outlook: http://www.cpc.ncep.noaa.gov 90 Day Outlook: |
|
Questions or Comments: If you have any questions or comments about this information |
Other Contacts: For state climate impacts: http://www.stateclimate.org |
|
Acknowledgements: The Drought Monitor is a multi-agency effort involving NOAA’s National |
Related Websites : NWS - http://www.weather.gov/phoenix CPC - http://www.cpc.ncep.noaa.gov Drought Monitor - http://droughtmonitor.unl.edu/ |