On this page you learn what types of flooding are typical in California and how do you protect yourself, your family and your home. You will also find out more about significant California floods. Finally, you'll find links to NWS offices that provide forecast and safety information for California, as well as links to our partners who play a significant role in keeping you safe.
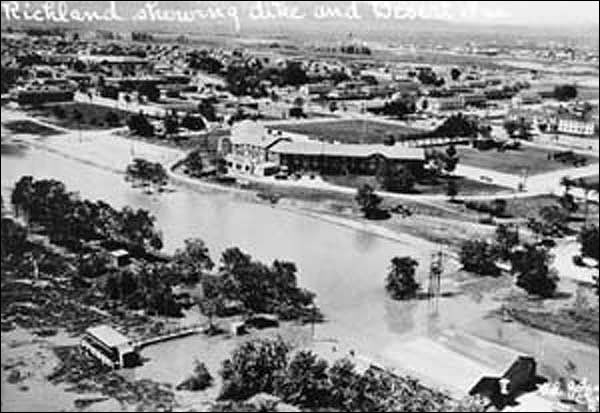
There were 324 precipitation stations mainly in southern California reporting the highest ever rainfalls for 60 consecutive days. Mount Baldy Notch reported 88.50 inches of rainfall in 60 days from January 13 to March 13, 1969. Mount Baldy Notch is 7,735 feet in the San Gabriel Mountains near the Los Angeles-San Bernardino County line. Stations reporting extremely high rainfalls for the 60 days ranged from Cottonwood Creek at an elevation of 10,660 feet in the Southern Sierra to Death Valley at 194 feet below sea level. Nineteen stations reported rainfall totals in excess of the once-in-a-thousand year storm. The stations reporting 1,000 year storms from the South Coast Basin were at higher elevations. The valley floor portion of the San Joaquin Valley also had heavy rainfalls with high return periods.
The winter of 1969 measured the second largest day rainfall for the state on February 25: 24.92 inches of rain fell at Lytle Creek Power House, at an elevation of 2,225 feet in the San Gabriel Mountains northwest of San Bernadino. There were 61 stations reporting rainfall in excess of 10 inches per day during the big storm. Five San Gabriel Mountain stream gages reported over 10 inches of runoff on January 25, 1969. Juncal Dam in Santa Barbara County received 16.31 inches on February 25.
The highest one day stream-flow for California was measured on February 25, 1969, at the USGS station Day Creek near Etiwanda, whcih measured an average daily flow of 4,070 cubic feet per second (cfs). The peak flow was 9,450 cfs. An average daily flow of 4,070 cfs is 8,070 acre-feet in 1 day or 96,850 acre-inches; 96,800 acre-inches divided by 4.58 square miles or 2,931 acres is to 33.04 inches of runoff in 1 day, well in excess of the greatest single day rainfall of 26.12 inches at Hoegees near Mt Wilson on January 23, 1943. Four other USGS stations were found to have runoff in excess of 10 inches on this day.
Rain gage records represent a very small sample of the actual rainfall, only about one part in 80 million in each square mile. It is no wonder that the peak rain misses the rain gage. I assume that if the 33 inches in one day at Day Creek were a debris-flow it would have destroyed the stream gage.
The Day Creek record was not an isolated event. The stream to the west of Day Creek, Cucamonga Creek draining the southwest slope of Cucamonga Peak, has a USGS flow record for the period 1930 to 1975. The peak flow on Cucamonga Creek was 14.91 inches in 1 day also on January 25, 1969. The peak flow on Cucamonga Creek was 14,100 cfs or 1,398 cubic feet per second, per square mile.
By April 1, 1969, a great snow pack had accumulated in the Southern Sierra. The snow pack contained more than 200 percent of average water content. In the Tulare Lake Basin, 89,000 acres of cropland had to be flooded to provide water storage the melting snow. This flood could be called the Tulare Lake Storm. Tulare Lake basin, where over 100,000 acres of crops are grown, is normally a fully cultivated dry lake-bed and the former terminus of the Kings River. Kings River is controlled by Pine Flat Dam but that dam holds only 59 percent of the mean annual flow of Kings River. Tulare Lake lies in the rain shadow of the Coast Ranges and is normally protected from large Pacific Storms. The average annual rainfall in Tulare Lake bed is 6 inches.
Learn More:
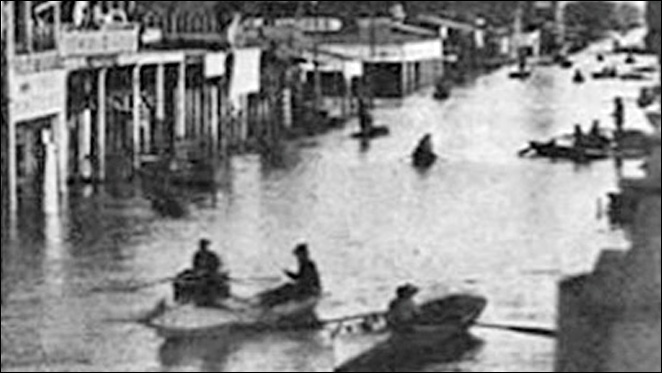
Number three on the list of the California's worst storms was centered on the North Coast on the Eel and Klamath River Basins. The 6 days from December 19-24, 1964, were the wettest ever recorded at 101 northern California stations. The North Coast had the worst flooding experienced in that region on record. Every major stream in this North Coast produced new high values of extreme peak flows; 34 counties in California were declared disaster areas. There were three major centers of activity: the Eel River, the Upper Klamath and the Yuba River in the central Sierra Nevada mountains.
The highest 6-day rainfall reported for the Eel Basin was 31.71 inches at Branscomb; 14 of 17 stations in the Eel River Basin reported the highest ever rainfalls during this storm. A telephone pole stands at the former town site of Weott along the Eel River with a sign near the top indicating the great depth of the water during the December 1964 flood. The signs serves to remind people not rebuild along the river.
The highest return periods for the storm were in the Klamath River Basin where Gazelle reported 8.09 inches. This total was 7.78 standard deviations above the mean. The associated return period is over 500,000 years. These high numbers were also reflected in the records of nearby stations of Yreka, Mt. Heborn and Callahan. This storm also produced the highest ever river stages on streams in Southern Oregon such as the Chetco River.
In all, 43 stations reported daily rainfalls of 10 inches or more on December 22, 1964. These stations were in the North Coast streams as well as the central Sierra Nevada. The highest reported rainfall in one day was 15 inches at Ettersberg in Humboldt County.
The highest ever rainfalls occurred in the Yuba and Bear River Basins, where Lake Spaulding received 32.60 inches of rain in 6 days. Six stations in the Yuba watershed reported over 10 inches of rain on December 22, 1964.
The stream flow on the Yuba River at Marysville peaked at 180,000 cubic feet per second (cfs), causing the second Christmas time flood in a decade. The December 1955 peak on the Yuba River at Marysville was 140,000 cfs.
One reason that the storm was not better documented is that several rain gages were washed away in the flood and important locations were never ever monitored (source).
Learn More:
Number four on the list of the California's worst storms was centered in the Central Sierra and in the Napa River. A series of warm tropical storms resulted on a good soaking, generally of the higher elevations: 237 stations reported the highest ever rainfalls for 10 consecutive days. Half of the average annual rain fell in the 10 days between February 11-20 at 182 stations. Four stations reported over 100% of their annual average rainfall occurred in 10 days.
Widespread drenching rains in central California led to extensive flooding and mudslides. Flooding resulted in 13 deaths, 50,000 evacuations and over $400 million in property damage. This was the storm associated with a big levee failure on the Yuba River at Linda, across the river and south from Marysville.
In the Sierra Nevada the storm affected mainly the area from Yosemite on the south to the Feather River Basin in the north. The stations of the Sierra Nevada receiving 1,000-year rainfalls ranged in a band from Clarks Peak north of Sierra Valley in the Feather River Basin to Calaveras Big Trees in the Cosumnes River Basin in the south. Four Trees, near Bucks Lake, had 17.6 inches on February 17, 1986, a new record high 24-hour rainfall for the Central Valley.
Calistoga, in the Napa River Basin, had 29.61 inches in 10 days representing a return period of 2,600 years. The previous 10-day high rainfall total at Calistoga was 20.00 inches in 1906. The rainfalls on the Russian River during this storm were heaviest on the southern end of the watershed. There was extensive flooding at Gurneville where one newspaper reported that the town had just drowned. The return period for the 10-day rainfall at Ukiah in the North end of the Russian River was 31 years where as at Granton it was 170 years.
There were 13 reports of more than 10 inches of rain on the Feb 17. Most of these reports were in the Yuba, Bear and American basins, but two were near the Napa River Basin and one on the Smith River in the Northwest corner of the state.
The Atlas Road gage on the North Slope of Atlas Peak reported 41.08 inches of rainfall in 10 days. There was a lot of flooding downstream from Atlas Peak area. Some of the streams draining the East side of Atlas Peak appeared to have had a debris flow as the stream beds were stripped of vegetation and the stream beds were lined with large boulders after the flood. Interstate Highway 80 was flooded downstream at Cordilia Junction following this event.
Learn More:
Number five on the list of the California's worst storms was centered in the southern San Jaoquin Valley. A vigorous winter cyclonic storm with wide spread flooding and mud-slides developed on the windward slopes of the South Coastal Basin on February 10, 1978. There were 18 deaths reported with this storm and $120 million in storm related damage. This storm was still quite robust as it moved northeasterly into the comparatively dry San Joaquin Valley. This is another case of an energetic storm moving into a "rain shadow" area before it dissipates.
The heaviest rainfall depth of this storm was at Matilija Canyon in Ventura County to the southwest of Buena Vista Lake Basin where an observer reported 13.31 inches in 1 day. Seven stations reported more than 10 inches of rainfall on this day. Matilija Canyon is a wet place relative to Buena Lake Basin. It receives seven times as much rain is an average year or about 35 inches per year. A rainfall of 13.31 inches in one day at Matilija Canyon has a return period of less than 30 years.
The storm of February 10, 1978, based on return period, was centered in the Buena Vista Lake Region of Kern County. Blackwells Corner received 3.90 inches on February 10, 1978, 74% of the mean annual precipitation in one day. This total was 7.41 standard deviations above the mean maximum day, with an associated return period of 28,000 years. The average rainfall in the region of 1,000 year rainfalls was only 3.48 inches; 76 stations in this study experienced the highest ever daily rainfalls on this day. In addition, 16 stations reported return periods in excess of 1,000 years and 32 stations reported return periods in excess of 100 years.
There is a strong resemblance between this storm and the tropical storm that came on shore near Santa Cruz in September 1918. Both events were robust cyclonic storms that vigorously entered the rain shadow areas to the northeast resulting in a deluge in normally dry areas (source). Learn More: Report on the Southern California Flash Flood
Learn More:
|
||||||